조사료와 농후사료의 급여 비율이 착유유의 우유생산성과 대사산물에 미치는 영향*
6)
엄준식
**†․이신자
***†․이수경
****․이예준
**․김현상
**․최유영
**․기광석
*****․
정하연
*****․김언태
*****․이상석
******․정창대
******․이성실
*******Effects of Different Roughage to Concentrate Ratios on the Changes of Productivity and Metabolic Profiles in Milk of Dairy Cows
Eom, Jun-Sik․Lee, Shin-Ja․Lee, Su-Kyoung․Lee, Yae-Jun․Kim, Hyun-Sang․
Choi, You-Young․Ki, Kwang-Seok․Jeong, Ha-Yeon․Kim, Eun-Tae․
Lee, Sang-Suk․Jeong, Chang-Dae․Lee, Sung-Sill
This study was conducted to evaluate roughage to concentrate ratio on the changes of productivity and metabolic profiling in milk. Six lactating Holstein cows were divided into two groups, T1 group was fed low-concentrate diet (Italian ryegrass to concentrate ratio = 8:2) and T2 group was fed high-concentrate diet (Italian ryegrass to concentrate ratio = 2:8). Milk samples were collected and its components and metabolites were analyzed by
1H-NMR (Nuclear magnetic resonance). The result of milk components such as milk fat, milk protein, solids-not-fat, lactose and somatic cell count were not significantly different between two groups. In carbohydrate metabolites, trehalose and xylose were significantly higher (P<0.05) in T1 group, however lactose was not significantly different between two groups. In amino acid metabolites, glycine was the highest concentration however, there was no signifi-
*******
본 논문은 농림수산식품기술기획평가원(과제번호 : 319015-01-1-HD020) ‘Development of biomarker
and establishment of specific metabolites related to metabolic disorder in dairy cow’ 에서 지원 받았음.
*******
경상대학교 응용생명과학부(BK21Plus)
*******
경상대학교 농업생명과학연구원&중점연구소
*******
경상대학교 농업생명과학연구원
*******
국립축산과학원 낙농과
*******
순천대학교 동물자원과학과
*******
Corresponding author, 경상대학교 응용생명과학부(BK21Plus), 농업생명과학연구원&중점연구소
([email protected])
†
These authors contributed equally to this work as the first authors.
cant difference observed between two groups. Urea and methionine were signifi- cantly higher (P<0.05) in the T2 group. In lipid metabolites, carnitine, choline and O-acetylcarnitine there were no significant difference observed between the two groups. In benzoic acid metabolites, tartrate was significantly higher (P<0.05) in T2 group. In organic acid metabolites, acetate was significantly higher (P<0.05) in T1 group and fumarate was significantly higher (P<0.05) in T2 group. In the other metabolites, 3-methylxanthine was only significantly higher (P<0.05) in T2 group and riboflavin was only significantly higher (P<0.05) in T1 group. As a result, milk components were not significantly different between two groups. However, metabolites concentration in the milk was significantly different depends on roughage to concentrate ratio.
Key words : concentrate, Holstein, italian ryegrass, milk,
1H-Nuclear magnetic resonance
Ⅰ. 서 론
원유의 성분은 수분, 유지방, 유단백질 그리고 유당 등이 있으며, 평균적으로 수분 87.3%, 유지방 3.5%, 유단백질 3.4%, 그리고 유당 4.6% 등으로 구성되어 있다(Korea dairy committee, 2016). 그리고 젖소가 섭취하는 사료의 종류와 비율에 따라 성분이 변화되면 원유등급이 달 라 질수 있으므로(Ki et al., 2016) 조사료와 농후사료의 종류 및 섭취비율이 매우 중요하다.
젖소에게 양질 조사료 및 섭취비율을 높일 것을 권장하고 있다. 그 이유는 대사성 질병 예방에 효과적이고(Spahr, 1977), 타액 분비를 촉진시켜 소화에 도움을 주며(Han et al., 1996), 반추위 pH를 안정시켜 미생물 활력이 증가하기 때문이다(Bartely, 1976). 또한 반추위 내 acetate : propionate 비율이 높아지면서 산유량 및 유지방 함량이 증가에 효과가 있기 때 문이다(Henry, 2006).
최근에는 조사료와 농후사료 섭취 비율이 45% : 55%에서 60% : 40% 이상으로 변화하고 있다. 국내에서는 생산비율이 가장 높고 영양소 함량이 낮은 볏짚과 국외에서 양질의 조사 료를 수입하여 같이 섭취하고 있다. 그러나 원유 생산량을 증가시키기 위해 조사료 섭취비 율을 낮추고 농후사료 섭취 비율을 증가시키는 국내 낙농가가 있으므로(Ko et al., 2014) 조 사료와 농후사료 섭취 비율을 달리하여 원유의 성분 및 유량 비교에 관한 연구가 필요할 것으로 사료된다.
국외에서 생산되는 원유 품질 평가는 유지방, 유단백질, 유당, 무지고형분 함량 및 체세 포 수 등의 분석과 함께 대사산물에 관한 연구도 같이 진행되고 있다. 그 이유는 원유 내 대사산물의 변화에 따라 유지방과 유단백질의 특성에 대해 연구할 수 있으며, 최종적으로 원유의 영양 및 품질의 최적화의 기초자료로 쓰일 수 있기 때문이다(Sundekilde et al., 2013). 그러나 국내에서는 시유의 관능적 품질 특성 평가(Chung et al., 2008) 및 휘발성분
패턴 분석(Kim et al., 2011) 등의 연구는 진행되어 있지만 원유 내 대사산물에 대한 연구는 미비한 실정이다. 그러므로 국내에서 생산되는 원유 내 대사산물 분석이 이루어진다면 원 유 품질평가 뿐 아니라 더 나아가 젖소의 질병 진단에도 도움이 될 것으로 사료된다.
대사산물 분석은 GC-MS, LC-MS, CE-MS 및 NMR (Nuclear Magnetic Resonance) 등을 이 용하고 있으며, 그 중 NMR은 GC-MS, LC-MS 및 CE-MS에 비해 감도는 낮지만 측정시간이 짧고, 시료의 전처리가 비교적 간단하다는 장점이 있을 뿐 아니라 많은 대사산물의 분석이 가능한 장점이 있다(Hong, 2014; Ramautar et al., 2015). 또한 여러 가지 식품의 성분 분석에 널리 이용되고 있으며(Wishart, 2008), 국외에서는 NMR을 이용한 원유 내 대사산물에 대한 연구가 많이 수행되고 있으므로(Sundekilde et al., 2014; Li et al., 2016; Mazzei and Piccolo, 2018) 원유 내 다양한 대사산물 분석에 적합할 것으로 판단된다.
따라서 이번 연구의 목적은 젖소에게 조사료인 이탈리안 라이그라스와 농후사료 급여 비율을 각각 8:2와 2:8로 급여한 후 유생산량, 유지방, 유단백질, 유당, 무지고형분 및 체세 포 수 분석과 1H-NMR기기를 이용한 원유 내 대사산물의 변화를 확인하였다.
Ⅱ. 재료 및 방법
1. 공시축 및 사양관리연구 절차 및 공시축의 사양관리는 국립축산과학원 축산자원개발부 실험동물 복지 윤리 법에 따라 수행 되었으며 홀스타인 6두(평균 체중 : 598 ± 90 kg, 평균산차 : 1~3산)를 이용하 였다. 사료의 총 급여량은 국립축산과학원 낙농과 사양기준에 따랐으며, 홀스타인 3두는 이 탈리안 라이그라스와 농후사료 급여비율을 8:2(이탈리안 라이그라스 : 4 kg, 농후사료 : 1 kg), 나머지 3두는 2:8(이탈리안 라이그라스 : 1.6 kg, 농후사료 : 6.5 kg)로 하여 1일 2회 급여하였 고, 물과 미네랄 블록은 자유섭취토록 하였으며, 이탈리안 라이그라스 및 농후사료 영양성 분 함량은 Table 1과 같다.
Table 1. The chemical composition of Italian ryegrass and concentrate used in the experiment
Chemical composition (% DM) Italian ryegrass Concentrate
Moisture 7.40 11.20
Crude protein 5.60 20.01
Ether extract 0.84 2.00
Crude ash 4.84 6.43
2. 원유 생산량 및 성분 분석
홀스타인의 원유 생산량은 파이프라인 착유시스템에 의해 총 2주간 측정하였으며, 그 중 3일치 원유를 아침과 저녁에 채취하여 용기에 잘 섞은 후 4℃에서 보관하였다. 그 후 샘플 50 mL를 40℃ 항온수조에서 15분간 안정시킨 후 Milko-scan 4000 series (Foss Electric Co, Denmark) 장비를 이용하여 유지방, 유단백질, 유당, 무지고형분 및 체세포수를 측정하였다.
3. 대사산물 분석
1H-NMR을 이용한 대사산물 분석을 위해 -80℃ deep freezer에 보관 중인 원유 샘플을 실 온에서 해동시킨 후 4,000 g 15분간 4℃를 유지하여 원심분리하여 상층에 분리된 지질층 제거 후 하층부 300 µL와 TSP 용액 300 µL를 혼합하였다. 그 후 혼합된 원유 샘플 500 µL 5 mm NMR tube에 옮겨 담아 SPE-800 mHz NMR-MS Spectrometer (Bruker BioSpin AG)를 이용하여 분석을 하였다.
1) 1H-NMR 분석 조건
원유 샘플에 대한 1H-NMR 스펙트럼은 Noesy 1D sequence를 사용하여 결과를 얻었다. 분 석은 25℃에서 진행하였으며, 측정 조건은 다음과 같다. Spectral width 20 ppm, acquisition time 2s, time domain 64k의 조건으로 128번 스캔하였다. 용매인 물의 피크를 최소화하기 위 해 pre-saturation 방법을 사용하였으며, 이때 saturation delay 1.5초 saturation power는 6인 saturation frequency에서 측정하였다.
2) 데이터 정량값 산출
각 시료에 대하여 1H-NMR 데이터를 얻은 후 Chenomx 소프트웨어(Chenomx NMR Suite 8.4, Chenomx Inc., Edmonton, Alberta, Canada)를 사용하여 baseline과 phase를 동일하게 맞추
Chemical composition (% DM) Italian ryegrass Concentrate
Crude fiber 34.84 20.00
Ca 0.21 0.80
P 0.13 0.51
Acid detergent fiber 38.95 6.86
Neutral detergent fiber 66.54 19.81
었다. 전체스펙트럼 범위는 0~10 ppm이며 기준 물질로 사용한 TSP는 피크의 위치와 적분 값을 일정하게 맞추기 위해 사용하였고, 마지막으로 Chenomx 8.4 소프트웨어와 1H-NMR Suite 라이브러리를 이용하여 대사산물에 대한 정량 값을 산출하였다.
4. 통계분석
시험 결과에 대한 통계분석은 SAS package program (2002)의 general linear model (GLM) procedure를 이용하여 분산분석을 하였고, Duncan’s multiple range test (Duncan, 1955)의 다 중검정방법으로 평균 간의 유의성을 검정하였다.
Ⅲ. 결과 및 고찰
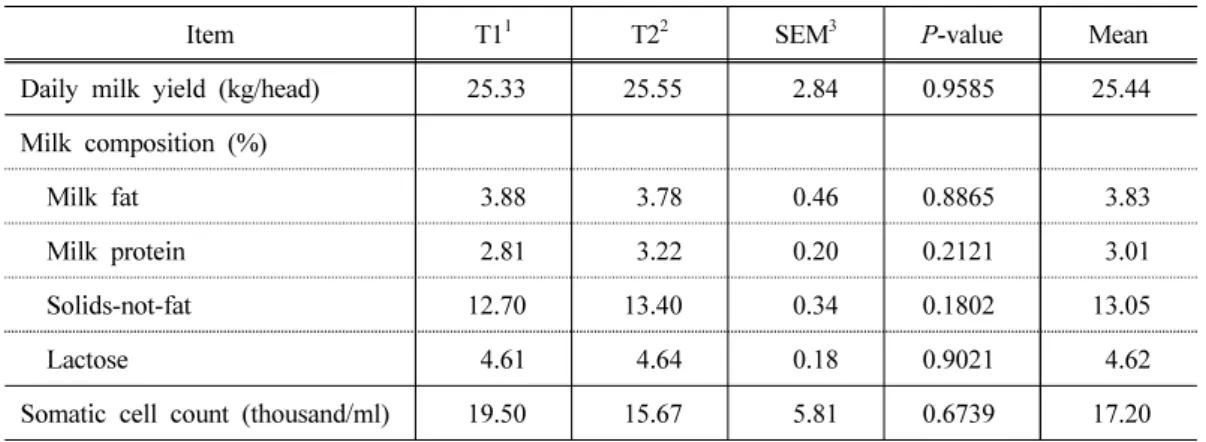
1. 원유 생산량 및 성분 분석이탈리안 라이그라스와 농후사료 급여 비율에 따른 원유 생산량 및 성분 분석에 대한 결 과는 Table 2와 같다. 원유 생산량은 두 급여구간 유의적(P>0.05)인 차이는 나타나지 않았 다. 유지방 및 유단백질 함량 역시 두 급여구간 유의적(P>0.05)인 차이는 나타나지 않았으 며 Lawrence 등(2015)의 결과와 유사하였다. 농후사료 섭취량을 증가시키면 원유 생산량이 증가하고, 양질의 조사료 섭취량을 증가시켜 유지방 함량을 높이는 효과가 있다는 연구결
Item T1
1T2
2SEM
3P-value Mean
Daily milk yield (kg/head) 25.33 25.55 2.84 0.9585 25.44
Milk composition (%)
Milk fat 3.88 3.78 0.46 0.8865 3.83
Milk protein 2.81 3.22 0.20 0.2121 3.01
Solids-not-fat 12.70 13.40 0.34 0.1802 13.05
Lactose 4.61 4.64 0.18 0.9021 4.62
Somatic cell count (thousand/ml) 19.50 15.67 5.81 0.6739 17.20
1T1 : Italian ryegrass to concentrate ratio = 8:2.
2T2 : Italian ryegrass to concentrate ratio = 2:8.
3SEM : Standard error of the mean.
Table 2. Effects of different Italian ryegrass to concentrate ratio on milk yield, milk composition and somatic cell count
과가 있었으나(Henry, 2006; Ko et al., 2014), 이번 연구에서는 원유 생산량 및 성분에는 유 의적(P>0.05)인 차이가 나타나지 않은 결과를 보였다.
2. 1H-NMR을 이용한 원유 내 대사산물
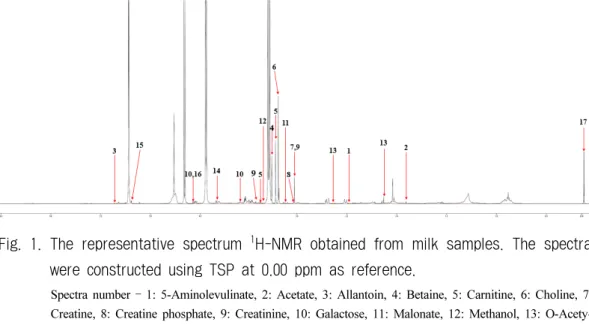
이탈리안 라이그라스와 농후사료 급여 비율에 따른 원유 샘플 내 대사산물은 총 46개 측 정 되었으며 carbohydrate 계열 6종류, amino acid 계열 8종류, lipid 계열 3종류 그리고 기타 계열 28종류로 대사산물을 분류하였다. 총 6가지 원유 샘플의 1H-NMR 스펙트럼 피크의 양 상은 비슷하였으나, 3-methylxanthine, acetate, creatinine, fumarate, homovanillate, methionine, riboflavin, tartrate, trehalose, urea 및 xylose 대사산물은 이탈리안 라이그라스와 농후사료 급 여 비율에 따라 유의적(P<0.05)인 정량적 차이가 나타나는 것을 확인할 수 있었다. Fig. 1은
1H-NMR을 이용한 원유 샘플의 스펙트럼 결과이며, 3가지 이상으로 측정된 multiple peak 대사산물 lactose, glucose 등을 제외한 single 또는 double peak으로 측정된 대사산물을 표기 하였다.
Fig. 1. The representative spectrum 1H-NMR obtained from milk samples. The spectra were constructed using TSP at 0.00 ppm as reference.
Spectra number – 1: 5-Aminolevulinate, 2: Acetate, 3: Allantoin, 4: Betaine, 5: Carnitine, 6: Choline, 7:
Creatine, 8: Creatine phosphate, 9: Creatinine, 10: Galactose, 11: Malonate, 12: Methanol, 13: O-Acety- lcarnitine, 14: Tartrate, 15: Trehalose, 16: Xylose, 17: TSP.
3. 원유 내 대사산물 확인 및 변화
1) Carbohydrate 계열 대사산물
원유 내 carbohydrate 계열의 대사산물 중 단당류인 galactose, glucitol, trehalose 및 xylose 와 이당류인 cellobiose 및 lactose가 측정되었다(Table 3). Sorbitol로도 불리며 glucose 및 fructose
전구물질로서 당을 수송하는 역할(Park and Lee, 2012)을 한다고 알려져 있는 glucitol은 두 급여구간 유의적(P>0.05)인 차이가 나타나지 않았다. Trehalose는 요구르트의 풍미에는 영 향을 주지 않으며 동결변성방지제로서의 효과(Woo et al., 2010)가 있다고 알려져 있으며, 본 연구 결과 T2 급여구에서 유의적(P<0.05)으로 높았다. Xylose는 탄소수가 다섯 개인 오 탄당 종류이며, 식품의 저장 과정에서 갈변반응에 영향을 미칠 수 있다고 알려져 있다(Ryu et al., 2003; Jung, 2017). 본 연구 결과 T2 급여구에서 유의적(P<0.05)으로 높은 것으로 보아 농후사료 섭취 비율이 높은 젖소에서 생산된 원유를 우유로 가공하기 전 냉장보관 기간이 길어진다면 갈변반응이 일어날 수 있을 것으로 사료된다. 원유의 약 3.4% 비중을 차지하고, 에너지의 약 30%를 가진 lactose가 가장 많이 검출된 것을 확인할 수 있었다. 또한 농후사 료 섭취가 많아지면 반추위 내 glucose 함량이 높아지고(Son et al., 2011), 유선조직 내 lactose 함량이 높아져 원유 내 lactose 농도에 영향을 미친다고 보고되어져 있다(Annison et al., 1974). 그러나 이번 연구 결과에서는 두 급여구간 유의적(P>0.05)인 차이가 나타나지 않 았으며, 이와 같은 결과는 Lee 등(2013)과 유사하였다.
Table 3. List of carbohydrate metabolites in milk according to different Italian ryegrass to concentrate ratio
Metabolites (µM/L) T1
1T2
2SEM
3P-value Mean
Carbohydrates
Galactose 338.60 336.40 64.29 0.9819 337.50
Glucitol (mM/L) 3.39 3.55 0.59 0.8532 3.47
Trehalose 118.73
b220.70
a12.46 0.0044 169.72
Xylose 108.45
b209.10
a16.37 0.0490 158.78
Cellobiose 243.37 215.27 41.39 0.6562 229.32
Lactose (mM/L) 40.84 50.76 4.92 0.3979 47.47
abMeans with different superscripts in the same column differ significantly (P<0.05).
1T1 : Italian ryegrass to concentrate ratio = 8:2.
2T2 : Italian ryegrass to concentrate ratio = 2:8.
3SEM : Standard error of the mean.
2) Amino acid 및 lipid 계열 대사산물
원유 내 대사산물 중 amino acid 및 lipid 계열의 대사산물 결과는 Table 4와 같다. 2014년 부터 국내 원유의 유지율 평가에 유단백질 함량을 추가되었으므로(Won et al., 2016), 아미 노산 계열 대사산물 종류 및 변화에 대한 분석이 필요할 것으로 사료된다. Methionine은 유 단백질 함량에 미치는 비중이 큰 대사물질로 비유 초기, 중기 착유우의 원유 내 부족한 유 단백질 함량을 보충해주기 위해 농후사료를 급여하여 생산량을 높인다고 하였으며(Lee et
al., 2008), 본 연구 결과 T2 급여구에서 유의적(P<0.05)으로 높았다. 그러나 젖소가 농후사 료를 과다 섭취하게 하면 단백질 과잉 공급으로 이어져 혈액 및 우유 내 아미노산 농도가 증가하여 요소태 질소 함량이 높아져 수태 성적이 나빠 질 수 있다고 보고되어져 있다 (Choi, 2004). 그 중 Urea는 원유 내 요소태 질소(MUN)를 증가시킬 수 있는 물질로서, T2 급여구에서 유의적(P<0.05)으로 높았으며, Lee 등(2013)의 결과와 유사하였다. Yang 등 (2016)에 의하면 valine은 branch chain 아미노산으로서 acetyl-CoA에 연관이 있고 각기 다른 착유우의 다른 대사과정에서 생성되는 물질로 알려져 있다. 연구 결과, 유의적(P>0.05)인 차이를 보이지 않는 것으로 보아 조사와 농후사료 급여 비율과 valine의 농도 변화에는 연 관이 없는 것으로 사료된다. Sunekilde 등(2011)에 의하면 응고가 잘되는 원유는 지방대사산 물인 choline은 농도가 높아지고, carnitine는 낮아진다고 알려져 있다. 본 연구결과에서는 유 의적(P>0.05)인 차이가 나타나지 않은 것으로 보아 원유의 응고반응에는 영향을 끼치지 않 는 것으로 보인다. 1H-NMR에서는 탄소 수가 높은 지방계열 대사산물 측정이 어렵기 때문 에 많은 종류의 대사산물이 측정되지 않았다.
Table 4. List of amino acid and lipid metabolites in milk according to different Italian ryegrass to Concentrate ratio
Metabolites (µM/L) T1
1T2
2SEM
3P-value Mean
Amino acids
Anserine 6.30 4.10 1.56 0.3757 5.20
Creatine 105.93 16.97 32.63 0.1261 61.45
π-Methylhistidine 4.57 3.37 1.22 0.5238 3.97
Glycine (mM/L) 1.78 1.99 0.08 0.1617 1.88
Methionine 15.90
b32.00
a0.97 0.0274 21.27
N-Acetylglucosamine 127.80 116.30 28.53 0.7898 122.05
Urea 201.57
b408.17
a12.41 0.0003 304.87
Valine 8.37 8.53 0.70 0.8740 8.45
Lipids
Carnitine 90.43 81.20 13.74 0.0867 86.74
Choline 364.87 255.07 38.78 0.1159 309.97
O-Acetylcarnitine 85.40 64.47 1.26 0.0749 6.95
abMeans with different superscripts in the same column differ significantly (P<0.05).
1T1 : Italian ryegrass to concentrate ratio = 8:2.
2T2 : Italian ryegrass to concentrate ratio = 2:8.
3SEM : Standard error of the mean.
3) 기타 대사산물
원유 내 대사산물 중 기타 대사산물의 결과는 Table 5와 같다. Benzonic acid 계열 대사산 물 tartrate는 T2 급여구에서 유의적(P<0.05)으로 높았다. 반추위 내 acetate 농도는 유지방 함 량 증가에 연관이 되어져 있으며, 원유 내 생성되는 acetate는 ethyl acetate, butyrate와 함께 미생물에서 유래된 대표적인 대사산물이라고 알려져 있고, 유방염에 걸린 착유우의 원유 내 acetate는 Staph.aureus 또는 E. coli에 의해 생성된 것으로 알려져 있다(Hettinga et al., 2009). 본 연구 결과 T1 급여구에서 acetate가 유의적(P<0.05)으로 높았는데, 이는 조사료 섭 취 비율이 높아 반추위 내 acetate 농도가 높아져 원유에서도 높게 측정된 것으로 보인다.
Maher 등(2013)에 의하면 fumarate는 우유 내 trimethylamine의 농도와 역 상관관계를 나타낸 다고 하였다. 본 연구결과 trimethylamine의 전구물질인 trimethylmaine N-oxide의 농도가 T2 급여구에서 낮았으며, fumarate 농도가 유의적(P<0.05)으로 높게 측정되었다. 3-Methylxanthine 은 최종적으로 요산으로 변환되는데, 농후사료 섭취 비율이 높은 T2 급여구에서 유의적 (P<0.05)으로 높았다. 이와 같은 결과는 T2 급여구에서 urea가 높게 측정된 것과 연관이 있 는 것으로 사료된다. Riboflavin은 비타민 B2로서 우유 내 칼슘 함량 다음으로 높은 비율을 차지한다(Rhie and Lee, 2015). 본 연구 결과 T1 급여구에서 유의적(P<0.05)으로 높았는데, 조사료 섭취량이 높은 젖소의 원유 내 영양소 함량이 높기에 이와 같은 결과가 나타났다고 사료 된다. 농후사료 섭취가 많아지면 반추위 내 propionate 전구물질인 fumarate가 높아지 면서 propionate가 증가하여 원유 생산량이 증가한다고 알려져 있다(Ha et al., 2013). 본 연 구 결과 T2 급여구에서 유의적(P<0.05)으로 높았지만, 원유 생산량 증가의 결과는 나타나지 않았다.
Table 5. List of others metabolites in milk according to different Italian ryegrass to concentrate ratio
Metabolites (µM/L) T1
1T2
2SEM
3P-value Mean
Alcohols
Methanol 10.13 9.97 0.53 0.8364 10.05
Aliphatic acylic compounds
O-Phosphocholine 5.55 64.40 28.25 0.2390 40.86
Trimethylamine N-oxide 123.80 3.00 85.00 0.3718 63.40
Amines
Histamine 2.80 2.50 0.65 0.7616 2.65
Sarcosine 54.27 45.90 9.09 0.5507 50.08
abMeans with different superscripts in the same column differ significantly (P<0.05).
1T1 : Italian ryegrass to concentrate ratio = 8:2.
2T2 : Italian ryegrass to concentrate ratio = 2:8.
3SEM : Standard error of the mean.
Metabolites (µM/L) T1
1T2
2SEM
3P-value Mean
Benzoic acids
4-Hydroxy-3-methoxymandelate 2.20 4.50 0.42 0.0618 3.35
Tartrate 72.87
b82.53
a2.37 0.0448 77.70
Carboxylic acids
3-Hydroxyisovalerate 18.30 57.83 10.50 0.0563 38.07
5-Aminolevulinate 69.20 27.63 19.54 0.2069 48.42
cis-Aconitate 9.90 3.27 4.04 0.3317 5.92
Creatine phosphate 134.47 362.63 81.61 0.1192 248.55
Guanidoacetate (mM/L) 4.85 7.04 1.12 0.2362 5.94
Homovanillate 1.23
b2.30
a0.21 0.0383 1.66
Malonate 32.50 54.73 6.21 0.0645 43.62
Imidazolinones
Allantoin 13.53 10.30 3.00 0.5030 12.24
Creatinine 132.17
a33.10
b19.75 0.0239 82.63
Organic acids
Acetate 31.77
a13.07
b2.89 0.0102 22.42
Fumarate 1.80
b7.90
a0.37 0.0013 4.24
O-Acetylcholine 6.30 7.60 5.97 0.5070 74.93
Isocitrate 317.30 351.60 146.78 0.7995 328.73
Etc
3-Methylxanthine 1.23
b1.80
a0.08 0.0156 1.46
4-Pyridoxate 1.25 1.10 0.11 0.4226 1.18
Betaine 192.97 158.20 18.94 0.2642 175.58
Pyridoxine 1.23 1.20 0.06 0.7244 1.22
Riboflavin 3.57
a1.50
b0.40 0.0352 2.74
sn-Glycero-3-phosphocholine 325.03 410.37 64.75 0.4042 367.70
Theophylline 1.23 0.80 0.26 0.3235 1.06
τ-Methylhistidine 1.83 1.83 0.23 1.0000 1.83
Ⅳ. 요 약
조사료와 농후사료의 급여 비율이 우유생산성과 대사산물에 미치는 영향에 대한 연구를 수행하였다. 공시축은 국립축산과학원 축산자원개발부 홀스타인 6두를 이용하여 3두는 이 탈리안 라이그라스와 농후사료 급여비율을 8:2, 나머지 3두는 2:8로 하여 1일 2회 분할 급 여하여 원유 생산량, 유성분 및 1H-NMR를 이용한 원유 내 대사산물 분석을 실시하였다. 원 유 생산량, 성분 분석 및 체세포수는 두 급여 간 유의적(P>0.05)인 차이가 나타나지 않았지 만, 급여 비율별 원유 생산량 및 유성분 변화는 선행연구 결과와 유사하였다. Carbohydrate 계열 대사산물 trehalose와 xylose는 T1 급여구에서 유의적(P<0.05)으로 높았으나, lactose 함량은 두 급여 간 유의적(P>0.05)인 차이가 나타나지 않았다. Amino acid 계열 대사산물 중 glycine 함량이 가장 높았지만, 두 급여 간 유의적(P>0.05)인 차이가 없었으며, Urea와 methionine는 T2 급여구에서 유의적(P<0.05)으로 높았다. Lipid acid 계열 대사산물 carnitine, choline 및 O-acetylcarnitine은 두 급여 간 유의적(P>0.05)인 차이는 나타나지 않았다. Benzoic acid 계열 대사산물 tartrate는 T2 급여구에서 유의적(P<0.05)으로 높았다. Organic acid 계열 대사산물 acetate는 T1 급여구에서 유의적(P<0.05)으로 높았으며, fumarate는 T2 급여구에서 유의적(P<0.05)으로 높았다. 기타대사산물로 분류되어 있는 3-methylxanthine은 T2 급여구에 서 유의적(P<0.05)으로 높았으며, 비타민 B2로 불리는 riboflavin은 T1 급여구에서 유의적 (P<0.05)으로 높았다. 이번 연구결과에서는 이탈리안 라이그라스와 농후사료 급여 비율을 달리하였을 때 유생산량, 유지방, 유단백질, 유당, 무지고형분 및 체세포 수 분석 결과 유의 적(P>0.05)인 차이가 나타나지 않았지만, 원유 내 여러 대사산물은 유의적(P<0.05)인 차이 가 나타나는 것을 확인할 수 있었다.
국외의 1H-NMR을 이용한 원유 내 대사산물을 비교하였을 때 acetate, furmarate 및 lactose 등과 같은 주요 대사산물의 정량화를 확인하였다. 또한 국내의 원유 내 대사산물 연구에 기초적 자료로 쓰일 수 있을 것이며, 추후 질병과 직접적 상관관계에 있는 대사산물에 대 한 연구가 이루어진다면 착유우의 질병 예방에 도움을 줄 수 있을 것으로 사료된다.
[Submitted, July. 30, 2018 ; Revised, October. 1, 2018 ; Accepted, November. 26, 2018]
References
1. Annison, E. F., R. Bickerstaffe, and J. L. Linzell. 1974. Glucose and fatty acid metabolism in cows producing milk of low fat content. J. Agric. Sci. 82: 87-95.
2. Bartely, E. E. 1976. Bovine saliva: production and function of buffers in ruminant phy- siology and matabolism. Church and Dwight Co., Inc., New York.
3. Chung, S. J., C. R. Lim, and B. S. Noh. 2008. Understanding the sensory characteristics of various type of milk using descriptive analysis and electronic nose. Korean J. Food Sci.
Technol. 40(1): 47-55.
4. Choi, B. R. 2004. Nutritional supplementing ways on feeding and management of dairy cow.
Journal of Veterinary Clinics, Proceedings of the congress Korean society of veterinary clinics. pp. 5-22.
5. Duncan, D. B. 1955. Multiple range and multiple F test. Biometrics. 11: 1-6.
6. Ha, J. K., S. S. Lee, Y. S. Moon, C. H. Kim, S. W. Seo, M. K. Beak, S. S. Lee, S. Y.
Lee, W. S. Lee, J. S. Jang, and N. J. Choi. 2013. Ruminant Nutrition and Physiology. Seoul National University press.
7. Han, I. K., J. K. Ha, T. H. Moon, S. S. Lee, C. H. Kim, and H. D. Kim. 1996. The effects of source and level of forage on VFA production and fermentation characteristics in the rumen of sheep. Kor. J. Anim. Nutr. Feed. 20(1): 77-86.
8. Henry, E. C. 2006. Milk and milk product. Tata Mc Graw Hill Publishing Company Limited.
9. Hettinga, K. A., H. J. F. van Valenberg, T. J. G. M. Lam, and A. C. M. van Hooijdonk.
2009. The origin of the volatile metabolites found in mastitis milk. Vet. Microbial. 137:
384-387.
10. Hong, Y. S. 2014. Nutritional metabolomics. J. Korean. Soc. Food. Sci. Nutr. 43(2):
179-186.
11. Jung, S. W. 2017. Seven wonders of sugar. J. Korean. Soc. Food. Sci. Nutr. 22(1): 29-32.
12. Ki, K. S., D. H. Lim, T. I. Kim, S. M. Park, H. J. Lim, and K. C. Choi. 2016. Comparison of nutritive values of diets collected from organic dairy farms and conventional dairy farms from Chungnam and Jeonbuk in Korea. J. Kor. Grassl. Forage Sci. 36(1): 29-33.
13. Kim, K. H., E. J. Hong, S. J. Park, J. W. kang, and B. S. Noh. 2011. Pattern recognition analysis for volatile compounds of the whole, skim, UHT-, HTST-, and LTLT-milk under LED irradiations. Korean J. Food Sci, Ani. Resour. 31(4): 596-602.
14. Ko, M. J., D. S. Kim, S. Y. Jeong, B. Kim, O. D. Kang, S. C. Lee, and W. S. Lee. 2014.
The effect of sodium bicarbonate and liquid buffer on milk yield, milk composition and blood metabolites of Holstein dairy cows.
15. Korea dairy committee. 2016. Dairy statistics yearbook.
16. Lawrence, D. C., M. O’Donovan, T. M. Boland, E. Lewis, and E. Kennedy. 2015. The
effect of concentrate feeding amount and feeding strategy on milk production, dry matter intake, and energy partitioning of autumn-calving Holstein-Friesian cows. J. Dairy. Sci. 98(1):
338-348.
17. Lee, B. H., J. G. Nejad, H. S. Kim, and K. I. Sung. 2013. Effect of forage feeding level on the milk production characteristics of Holstein lactating cows. J. Kor. Grassl. Forage Sci.
33(1): 45-51.
18. Lee, J. M., I. S. Nam, and J. H. Ahn. 2008. Effects of supplementation of ruminally pro- tected amino acids on in vitro ruminal parameters and milk yield and milk composition of dairy cows in mid-lactation. J. Anim. Sci. & Technol. (Kor.). 50(2): 199-208.
19. Li, Q., Z. Yu, D. Zhu, X. Meng, X. Pang, Y. Liu, R. Frew, H. Chen, and G. Chen. 2016.
The application of NMR-based milk metabolite analysis in milk authenticity identification. J.
Sci. Food. Agric. 97: 2875-2882.
20. Maher, A. D., B. Hayes, B. Cocks, L. Marett, W. J. Wales, and S. Rochfort. 2013. Latent biochemical relationships in the blood-milk axis of dairy cows revealed by statistical integra- tion of 1H NMR spectroscopic data. J. Proteome. Res. 12(3): 1428-1435.
21. Mazzei, P. and A. Piccolo. 2018. NMR-based metabolomics of water-buffalo milk after conventional or biological feeding. Chem. Biol. Techol. Agric. 5: 3.
22. Park, H. J. and J. H. Lee. 2012. Transcriptional analysis responding to propanol stress in Escherichia coil. J. Life. Sci. 22(3): 417-427.
23. Ramautar, R., Govert W. Somsen, and Gerhardus J. de Jong. 2015. CE-MS for metabolomics:
Developments and applications in the period 2012-2014(Review). Electrophoresis. 36: 212- 224.
24. Rhie, S. G. and E. K. Lee. 2015. Milk and dairy intake and acceptability in fifth- and sixth-graders in Hwaseong, Korea. Korean. J. Community. Living. Sci. 26(3): 499-509.
25. Ryu, S. Y., H. J. R, B. S. Noh, S. Y. Kim, D. K. Oh, W. J. Lee, J. R. Yoon, and S. S.
Kim. 2003. Effects of various sugars including tagatose and their molar concentrations on the maillard browning reaction. Korean J. Food Sci. Technol. 35(5): 898-904.
26. Sundekilde, Ulrik K., P. D. Frederiksen, M. R. Clausen, L. B. Larsen, and H. C. Bertram.
2011. Relationship between the metabolite profile and technological properties of Bovine milk from two dairy breeds elucidated by NMR-based metabolomics. J. Agric. Food. Chem.
59: 7360-7367.
27. Sundekilde, Ulrik K., Lotte B. Larsen, and Hanne C. Bertram. 2013. NMR-based milk metabolomics. 2013. Metabolites. 3(2): 204-222.
28. Sundekilde, Ulrik K., F. Gustavsson, Nina A. Poulsen, M. Glantz, M. Paulsson, Lotte B.
Larsen, and Hanne C. Bertram. 2014. Association between the bovine milk metabolome and rennet-induced coagulation properties of milk. J. Dairy. Sci. 97: 6076-6084.
29. Son J. K., C. Y. Choe, S. R. Cho, H. J. Lim, S. J. Park, K. S. Baek, S. B. Kim, E. G.
Kwon, Y. S. Jung, N. H. Bok, and D. S. Son. 2011. Relationship between transferable embryos and blood urea nitrogen, glucose and total cholesterol concentration in Hanwoo donors. Reprod. Dev. Biol. 35(3): 335-339.
30. Wishart David S. 2008. Metabolomics: applications to food science and nutrition research (Review). Trends. Food. Sci. Technol. 19: 482-493.
31. Won, J. I., C. K. Dang, H. J. Lim, Y. S. Jung, S. K. Im, and H. B. Yoon. 2016. Estimation of genetic parameter for milk production and linear type traits in Holstein dairy cattle in Korea. J. Agric. Life. Sci. 50(1): 167-178.
32. Woo, S. H., J. W. Jhoo, W. B. Yoon, and G. Y. Kim. 2010. Effect of trehalose and sugar alcohol on the viability of lactic acid bacteria and quality characteristics during frozen storage of yoghurt. Food. Eng. Prog. 14(1): 14-20.
33. Yang, Y., N. Zheng, X. Zhao, Y. Zhang, R. Han, J. Yang, S. Zhao, S. Li, T. Guo, C. Zang, and J. Wang. 2016. Metablomic biomarkers identify differences in milk produced by Holstein cows and other minor dairy animals. J. Proteomics. 136: 174-182.