콩의 생산과정에서 발생하는 탄소배출량 산정 및 전과정평가
소규호*·이길재1·김건엽·정현철·유종희·박정아2·이덕배
국립농업과학원 농업환경부 기후변화생태과, 1농업기술실용화재단, 2에코네트워크(주)
Estimation of Carbon Emission and LCA (Life Cycle Assessment) from Soybean (Glycine max L.) Production System
Kyu-Ho So*, Gil-Zae Lee1, Gun-Yeob Kim, Hyun-Cheol Jeong, Jong-Hee Ryu, Jung-Ah Park2, and Deog-Bae Lee
National Academy of Agricultural Science, Suwon, 441-707, Korea
1Foundation of Agri. Tech. Commercialization & Transfer Suwon, 441-857, Korea
2Econetwork Co., Ltd. Seoul, 137-888, Korea
This study was carried out to estimate carbon emission using LCA (Life Cycle Assessment) and to establish LCI (Life Cycle Inventory) database of soybean production system. Based on collecting the data for operating LCI, it was shown that input of organic fertilizer was value of 3.10E+00 kg kg-1 soybean and it of mineral fertilizer was 4.57E-01 kg kg-1 soybean for soybean cultivation. It was the highest value among input for soybean production. And direct field emission was 1.48E-01 kg kg-1 soybean during soybean cropping. The result of LCI analysis focussed on greenhouse gas (GHG) was showed that carbon footprint was 3.36E+00 kg CO2-eq kg-1 soybean. Especially CO2 for 71% of the GHG emission. Also of the GHG emission CH4, and N2O were estimated to be 18% and 11%, respectively. It might be due to emit from mainly fertilizer production (92%) and soybean cultivation (7%) for soybean production system. N2O was emitted from soybean cropping for 67% of the GHG emission. In CO2-eq. value, CO2 and N2O were 2.36E+
00 kg CO2-eq. kg-1 soybean and 3.50E-01 kg CO2-eq. kg-1 soybean, respectively. With LCIA (Life Cycle Impact Assessment) for soybean production system, it was observed that the process of fertilizer production might be contributed to approximately 90% of GWP (global warming potential). Characterization value of GWP was 3.36E+00 kg CO2-eq kg-1.
Key words: LCI, Carbon footprint, LCIA, LCA, Soybean production system
접수 : 2010. 11. 15 수리 : 2010. 11. 24
*연락저자 : Phone: +82312900230 E-mail: [email protected]
서 언
전과정평가 (Life Cycle Assessment, LCA) 개념은 1960년대 말 환경평가 의뢰로 공산품의 환경성 평가 에 적용된 이후 산업분야에서 광범위하게 사용되어 오고 있다. 1990년대 이후부터 농업분야에도 적용되기 시작 하였는데, 바이오에너지 환경성 평가와 농업작부체계 및 영농방법의 환경성 평가가 수행되었다 (Nam et al., 2008). 영국의 경우 생산 및 수입하고 있는 7가지 주요 농수축산물 (토마토, 사과, 딸기, 감자, 소, 돼지, 닭)에 대한 자원 사용 및 환경부담을 규명하기 위해 전과정평 가를 통한 환경영향평가와 LCI (Life Cycle Inventory)
구축이 이루어지고 있다 (Dalgaard, 2003).
콩은 단일식물로 15~25℃ 범위에서 온도가 높을수록 생육이 조장되고 개화 시기도 앞당겨 지며, 콩 함유성 분은 품종, 재배지역, 파종기, 온도 등을 달리한 조건 에서 함량 변이가 발생한다 (Ok et al., 2008). 콩의 생산규모는 2007 농축산물소득자료를 기준으로 재배면 적은 79,779 ha, 평균생산 171 kg 10a-1, 총생산 136 ton이었다 (RDA, 2008). 국내 콩 재배면적은 1970년 295 천 ha을 정점으로 1990년 152 천 ha로 90년대 이 후 지속적인 감소 추이를 보이고 있으나, 최근 소득증대 및 국민의 건강에 대한 관심이 높아지면서 웰빙식품으 로서 콩의 수요는 계속 증가하고 있는 실정이다 (Hong et al., 2010).
본 연구는 우리나라에서 재배되는 주요 식량작물 중 콩의 생산체계에 대한 1차 농산물 및 농자재의 LCI D/B 구축과 탄소원단위 산정 및 전과정 영향평가를 위하여
콩의 생산과정에서 발생하는 탄소배출량 산정 및 전과정평가 899
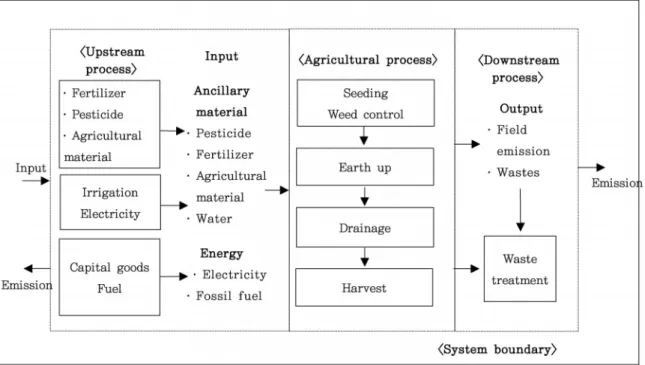
Fig. 1. System boundary (gate to gate) for production of soybean.
파종에서 수확까지 1년 1기작을 기준으로 수행되었다.
재료 및 방법
본 연구에서는 환경경영체제에 관한 국제표준 ISO 14040의 규격에 의거하여 연구목적 및 범위, 전과정 목록분석, 전과정 영향평가, 해석의 단계로 전과정평가 (LCA, Life Cycle Assessment)를 수행하였다 (ISO, 2006).
연구 목적 및 범위 (Goal and Scope definition) LCA 수행의 첫 단계인 연구의 목적과 시스템범위 정의는 다 음과 같다. 연구목적은 콩의 탄소원단위값 산정을 위한 LCI 구축 및 콩 생산체계에 대한 전과정평가이며, 정의 된 콩의 기능은 식용 및 각종 식품 제조의 원료이며, 기능 단위는 식품 및 식품 제조의 원료용으로 사용되는 콩 1kg 생산이다. 콩의 생산 시스템 경계는 농작물 생 산단계 (육묘, 정식, 재배, 수확)에 사용되는 원료물질 (종자, 묘), 보조물질 (농약, 비료, 농자재 등) 생산단 계, 에너지 (전기, 경유 등)생산 단계 등 농작업에서 투 입되는 물질과 대기, 수계, 토양으로 배출되어 부하되는 환경부하물질 및 고형폐기물을 포함하는 gate to gate (GtG)를 원칙으로 정의하였다 (Fig. 1).
전과정 목록분석 (Life Cycle Inventory Analysis) 2007 농축산소득자료집 (RDA, 2008)을 바탕으로 관련
통계, 문헌자료, 설문조사, 전문가 인터뷰, 현장방문을 통하여 콩생산체계의 입 ・ 출력 자료를 수집하여 GtG (Gate-to-Gate) 목록을 작성하고 LCI D/B를 구축하 였다. 여기서 데이터 수집 및 품질 요건은 시간적 경계 를 가급적 최근 5년 이내의 최신데이터와 지역적 경계 로서 국내 식량작물 생산 시스템을 기준으로 하는 국 내・외 데이터, 현재 국내에서 상용화된 기술을 기준으로 하는 동일시스템이나 유사시스템에 관한 데이터의 기술 적 경계를 기준으로 하였다. 콩 재배공정을 중심으로 관 련된 상 ・ 하위 공정의 흐름을 LCI D/B와 연결하여 전 과정 목록분석을 하였다. LCI 분석을 할 때 사용하는 D/B는 환경부, 지경부의 국내 D/B와 해외 D/B (스위스 Ecoinvent database)를 사용하였다. 인벤토리 목록을 구성할 때, 투입량은 사용량에서 유효성분함량을 고려한 값으로 바꾸는 작업이 필요하다. 그러므로 비료의 사용 량은 유효성분사용량을 바탕으로 추정하였고, 농약사용 량은 작물별 농약 사용가중치를 적용한 지수를 사용하여 계산하였으며 (KCPA, 2007a, b), 연료 사용 및 비료 사 용으로 인한 대기배출물은 IPCC (Intergovernmental Panel on Climate Change, 2006) 1996 배출계수를 통 해 배출량을 산출하였다. 영농폐기물 배출 및 처리량은 농 업폐기물 통계 (KWA, 2007; MIFAFF, 2004)등의 자료를 토대로 산정하였다.
위와 같이 수집된 입출력 데이터를 LCI 평가도구인 PASS software로 분석한 후 결과를 교토의정서 규정 6대 온실가스의 대기배출값을 CO2값으로 환산하여 나타 내었다 (Fig 2). 여기서 6대 온실가스 (GHG, Green-
Fig. 2. Carbon footprint of soybean system calculated by LCI.
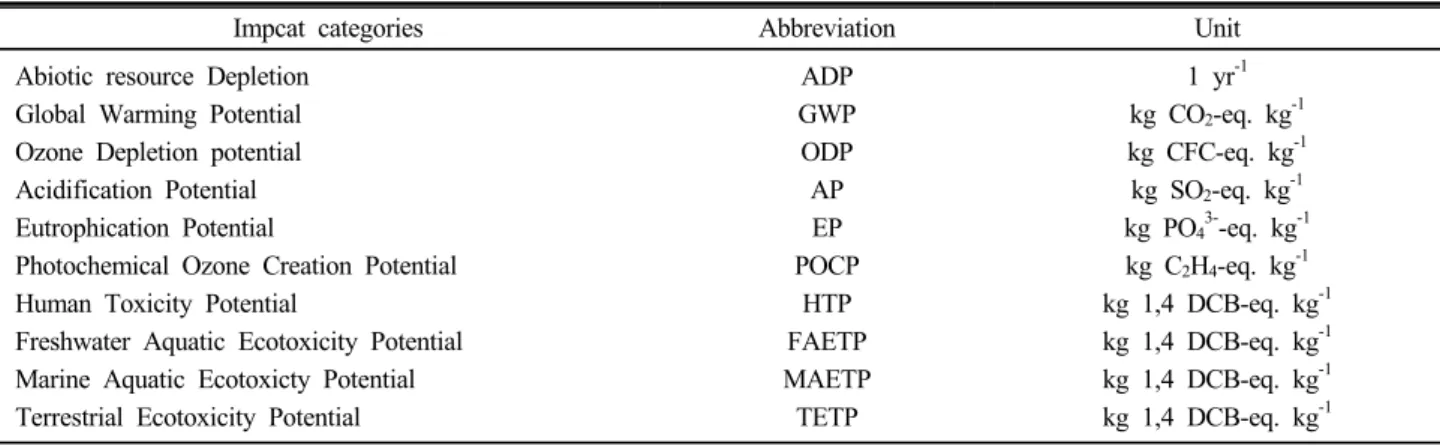
Table 1. Impact categories in LCIA (by MKE, Ministry of knowledge Economy methodology).
Impcat categories Abbreviation Unit
Abiotic resource Depletion Global Warming Potential Ozone Depletion potential Acidification Potential Eutrophication Potential
Photochemical Ozone Creation Potential Human Toxicity Potential
Freshwater Aquatic Ecotoxicity Potential Marine Aquatic Ecotoxicty Potential Terrestrial Ecotoxicity Potential
ADP GWP ODP AP EP POCP
HTP FAETP MAETP TETP
1 yr-1 kg CO2-eq. kg-1 kg CFC-eq. kg-1 kg SO2-eq. kg-1 kg PO43--eq. kg-1 kg C2H4-eq. kg-1 kg 1,4 DCB-eq. kg-1 kg 1,4 DCB-eq. kg-1 kg 1,4 DCB-eq. kg-1 kg 1,4 DCB-eq. kg-1
house Gases)는 이산화탄소 (CO2), 메탄 (CH4), 아산화 질소 (N2O), 수소불화탄소 (HFCs), 육불화황 (SF6), 과 불화탄소 (PFCs)이며, 농산물의 전과정 탄소성적은 식 (1)의 방법으로 산정되었다.
전과정 탄소성적 (kg CO2-eq.) =
∑{온실가스 배출량 (kg GHG) × GWP} 식 (1)
여기서, GWP (Global Warming Potential, 지구온 난화지수)는 온실가스가 100년 동안에 대기에 머물며 지구에 미치는 온난화 효과를 CO2를 1로 하였을 때 환 산된 값으로 CH4는 21, N2O는 310, HFC-134a가 1300, HFC-152a는 140, HFC-23은 11700, SF6은 23900, PFCs는 6500의 값을 갖는다 (IPCC 2001).
전과정 영향평가 (Life Cycle Impact Assessment) 전과정 영향평가는 분류화, 특성화, 정규화, 가정화로 구성되어 있는데, 이중 분류화와 특성화는 의무수행사항
이고 정규화와 가정화는 선택 사항이다 (ISO 14040).
본 연구에서는 분류화와 특성화만 수행하였다. 전과정 영향평가의 산정결과 (특성화 결과)는 특성화 값으로 표 시하며, 단위는 각 영향범주와 관련된 물질들 중 대표물 질에 대한 상응값으로 표시하였다 (Table 1). 전과정 영 향평가 도구는 지식경제부에서 개발한 PASS (4.1.3) software를 사용하였다.
결과 및 고찰
전과정 목록분석 콩생산체계의 GtG 목록작성 결 과, 기능단위 즉, 콩 1 kg 생산 당 투입되는 퇴구비, 무 기질 비료, 농자재 (육묘용 플러그판), 에너지 (전기, 화 석연료)양은 각각 3.10E+00 kg, 4.57E-01 kg, 6.29E-02 kg, 8.48E-02 kg이었다. 밭농사에서 주로 배출되는 온 실가스는 CO2, CH4, N2O이다 (IPCC 2001, Lee and Suh, 1993). 그러므로콩 생산단계에서 발생하는 직접 대기배 출물 (CO2, CH4, N2O)의 배출량을 IPCC 배출계수를 대
콩의 생산과정에서 발생하는 탄소배출량 산정 및 전과정평가 901
Table 2. Data of inputs and outputs for the production of soybean.
Input/Output Unit Quantity Data source
Input seed, seedling composts N fertilizers K fertilizer compound fertilizers lime
silicate fertilizer pesticides
electricity fossil feul vinyl pot Output
direct emissions (CO2, CH4, N2O) waste treatment product (soybean)
kg kg kg kg kg kg kg kg
kw L m kg kg kg kg
kg-1 product 7.19E-02 3.10E+00 7.02E-03 2.34E-03 3.18E-01 8.48E-02 4.44E-02 2.25E-03
2.57E-02 4.89E-02 1.41E-02 6.29E-02 1.48E-01 5.62E-02 1.00E+00
agro-livestock incomes data (RDA, 2007) incomes data (RDA, 2007) incomes data (RDA, 2007) incomes data (RDA, 2007) incomes data (RDA, 2007; KFIA, 2007)
incomes data (RDA, 2007) incomes data (RDA, 2007)
Agrochemical year book, Agrochemical use guide book (KCPA, 2007a, b)
incomes data (RDA, 2007) incomes data (RDA, 2007) incomes data (RDA, 2007)
IPCC 1996
KWA, 2007 MIFAFF, 2004 incomes data (RDA, 2007)
Fig. 3. Contribution of soybean productin system to environmental effects with one kilogram of soybean production by LCIA.
입하여 산정한 결과 배출총량이 1.48E-01 kg였다. 유 기질비료 (84%), 무기질 비료 (12%)는 전체 투입량의 96%
를 차지하였다. 다음은 육묘용 모판이 2%의 투입비중을 차지하였다 (Table 2).
콩 생산 시스템에서 대기 중으로 배출되는 온실가스 는 kg CO2-eq kg soybean 단위로 산출한 탄소성적으 로 표시되며, 교토의정서에서 규정한 6대 온실가스 대 상 물질로 하여 전과정 목록분석한 결과를 Fig. 2에 나 타내었다. 분석결과 콩 생산체계의 탄소원단위 성적은 3.36E+00 kg CO2-eq kg-1 soybean였다. CO2, CH4,
N2O의 CO2-eq. 환산 성적은 각각 2.36E+00, 6.41E-01, 3.50E-01 kg CO2-eq kg-1 soybean였다. 온실가스 발 생량 비중을 비교하면 CO2가 71%, CH4 18%, N2O 11%
이었다.
전과정 영향평가 콩 생산체계에 대한 전과정 영향 평가 결과 (특성화값)을 비료생산, 농약생산, 콩생산, 농 자재 생산, 에너지 생산으로 구분하여 각각의 영향범주 에 대한 공정별 기여도를 Fig. 3에 나타내었다. 콩 생 산 단계는 지구온난화지수 (GWP)에 약 12%의 기여도
Fig. 4. Contribution to GHG emission of soybean production system.
를 나타내었고 다른 영향범주에는 거의 영향을 주지 않 는 것으로 타나났다. 질소시비에 의한 아산화질소의 대 기배출은 GWP의 주요한 기여인자이다 (Bouwman, 1990).
광화학산화물 생성범주에서 육묘용 플러그 생산에 의한 환경영향 기여도가 약 30%정도를 나타냈다. 농약생산 공정은 주로 생태독성 관련범주에서 10% 내외의 기여도 를 보였고, 모든 영향범주에 가장 큰 영향을 주는 것은 비료생산공정이었고, GWP의 특성화값은 3.36E+00였다.
해석 (Interpretation) LCI 분석으로 산정된 보리생 산체계의 탄소성적을 비료 생산공정, 농약 생산공정, 에 너지 생산공정, 농자재 생산공정, 콩생산공정, 폐기물처 리공정으로 구분하여 밭 작물에서 발생하는 온실가스를 공정간 기여도로 비교하였다 (Fig. 4). CO2는 비료생산 (약 92%)과 콩생산 (약 7%)에서 주로 발생하였고, N2O 의 주요 발생원은 콩 생산 (약 67%)과 비료생산 (약 32%)이었다. CH4은 비료생산이 발생에 거의 대부분을 차 지하였다. 포장에서 발생하는 온난화가스 (CO2, CH4, N2O) 의 주요원인은 농기계사용으로 인한 화석연료의 연소와 질소비료 시용에 기인한 대기로의 아산화질소의 발생이 었다 (Lee and Suh, 1993). 콩생산체계에서 발생하는 CO2와 N2O는 각각 2.36E+00 kg CO2 kg-1, 1.13E-03 kg N2O kg-1였다. Shin 등의 연구결과 콩 작기 중 ha 당 아산화질소 발생량은 품종별 최대 4.7 kg N2O, 최 소 3.0 kg N2O였다 (Shin et al. 2003)
분석결과 전과정평가를 시행한 쌀을 비롯한 5작물과 마찬가지로 비료생산과 비료시용이 주요 발생원이므로 비료투입을 줄이는 영농법의 개발이 필요할 것으로 판 단되었다. 또한 콩재배의 경우 작물잔사와 콩재배에 의 한 질소고정 및 지력증진에 효과가 전과정평가에 포함 될 수 있는 방법론의 개발이 필요할 것으로 사료되었다.
요 약
투입되는 퇴구비, 무기질 비료, 농자재 (육묘용 플러 그판), 에너지 (전기, 화석연료)양은 각각 3.10E+00 kg kg-1 soybean, 4.57E-01 kg kg-1 soybean, 6.29E-02 kg kg-1 soybean, 8.48E-02 kg kg-1 soybean이었 고, 콩 생산단계에서 발생하는 직접 대기배출물 (CO2, CH4, N2O)의 배출량은 1.48E-01 kg kg-1 soybean였 다. LCI 분석 결과 콩 생산체계의 탄소원단위 성적은 3.36E+00 kg CO2-eq kg-1 soybean였고, 온실가스 발 생량 비중을 비교하면 CO2가 71%, CH4 18%, N2O 11%
이었다. CO2는 비료생산 (약 92%)과 콩생산 (약 7%)에 서 주로 발생하였고, N2O의 주요 발생원은 콩 생산 (약 67%)과 비료생산 (약 32%)순이었는데, CO2, N2O의 CO2-eq.
환산 성적은 각각 2.36E+00 kg CO2-eq kg-1 soybean 과 3.50E-01 kg CO2-eq kg-1 soybean였다. 전과정 영향평가 수행결과 GWP의 특성화값은 3.36E+00 kg CO2-eq kg-1였고, 콩 생산과 비료 생산이 주요한 원인 이었다.
인 용 문 헌
Bouwman, A.F. 1990. Exchange of greenhouse gases between terrestrial ecosystems and atmosphere. pp. 61-127.
In Bouwman, A.F. (Ed) Soils and greenhouse effect.
Wiley, Chicchester, USA.
Dalgaard, R., N. Halberg, I.S. Kristensen, and I. Larsen.
2003. Proceeding from the 4th International Conference, Bygholm, Denmark, An LC Inventory based on repre- sentative and coherent farm types.
Hong, S.B., S.J. Lee, Y.H. Kim, Y.S. Hwang, K.H. Yoon,
콩의 생산과정에서 발생하는 탄소배출량 산정 및 전과정평가 903
S.I. Lee, M.Y. Nam, L.S. Song, I.Y. Baek, H.K. Kim, and M.G. Choung. 2010. Variation of protein, oil, fatty acid, and sugar contents in black soybean cultivars according to different latitudes. Korean J. Environ. Agr. 29:120-128.
IPCC (Intergovernmental Pannel on Climate Change), 2001.
Climate change 2001, Radioactive forcing of climate change, The scientific basis. Cambridge University press, UK. pp.
388-390.
IPCC 2006. 2006 IPCC Guidelines for national greenhouse gas inventories, Prepared by the National Greenhouse Gas Inventories Programme, Eggleston H.S., L. Buendia, K. Miwa, T. Ngara, and K. Tanabe (eds). IGES, Japan.
ISO (International Organization for Standardization). 2006.
ISO 14040:2006(E) Environmental Management - Life Cycle Assessment - Principles and Framework.
KCPA (Korea Crop Protection association). 2007a. Agro- chemical use guide book. Korea Crop Protection association.
Seoul, Korea.
KCPA (Korea Crop Protection association). 2007b. Agro- chemical year book. Korea Crop Protection association.
Seoul, Korea.
KFIA (Korea Fertilizer Industry Association). 2007. Fertilizer production data. Korea Fertilizer Industry Association.
Seoul, Korea. www.fert-kfia.or.kr.
KWA (Korea Waste Association). 2007. Agricultural waste data. Korea Waste Association. Seoul, Korea. www.
kwaste.or.kr/data/.
Lee, S.K. and J.S. Suh. 1993. Emission of Greenhouse in the agricultural environment. 1. The cropping system and emssion of the greenhouse -CO2, CH4, N2O- under different cropping system. Journal of Korean soc. soil sci. fert. 26:49-56.
MIFAFF (Ministry for Food, Agriculture, Forestry and Fisheres). 2004. A study on Establishing effective man- agement system for equipped agricultural input wastes.
C2004-A1. Ministry for Food, Agriculture, Forestry and Fisheres. Seoul, Korea.
Nam, J.J., Y.S. Ok, B.S. Choi, S.T. Lim, Y.S. Jung, Y.S.
Jang, and J.E. Yang. 2008. Methodology of life cycle assessment (LCA) for environmental impact assessment of winter rapeseed in double-cropping system with rice.
Korean J. Environ. Agr. 27:205-210.
Ok, H.C., Y.H. Jeong, J.C. Jeong, O.S. Lee, C.W. C.G.
Kim, and C.G. Cho. 2008. Yield and isoflavone contents of soybean cultivar in highland area. Kor. J. Crop Sci.
53:102-109.
RDA (Rural Development Administration). 2008. 2007 Agro-livestock incomes data book. Rural Development Administration. Suwon, Korea.
Shin, Y.K. J.W. Ahn, M.H. Koh, and J.C. Shim. 2003.
Emission of greenhouse gases from upland rice and soybeen. Korean J. Soil Sci. Fert. 36:256-262.