28(12); 1183~1197; December 2019 https://doi.org/10.5322/JESI.2019.28.12.1183
ORIGINAL ARTICLE
Anyang Citizens’ Awareness of the Effects of City Parks on City Dwellers
Tony Marshall, June-Ho Jang
1), Boong-Hoon Eom
2)*Department of Urban Information Engineering, The Graduate School, Anyang University, Anyang 14028, Korea
1)Faculty of Urban Information Engineering, Urban Planning, Anyang University, Anyang 14028, Korea
2)Faculty of Landscape Architecture, Landscape Architecture, Daegu Catholic University, Gyeongsan 38430, Korea
Abstract
This study aimed to investigate educational, social, and environmental effects of city parks on the citizens of Anyang, South Korea. The study conducted a questionnaire survey for 30 days on a sample of 1,080 Anyang residents. Parks can be used for different purposes that have benefits like improving the appeal of the local environment as well as promoting health. The respondents highlighted preferred activities including participating in events, learning eco-practices at school, volunteering, and collaborating with the government to enforce environmental quality laws. The identified effects of parks on citizens according to this study were the benefits obtained from parks in the city, the improvement of their quality of life, and enhancing the environmental quality and sustainability. The study also undertook a correlational analysis to establish the relationship between the citizens’ experience in the park and the level of satisfaction they demonstrated in the study for continuity purposes. The data collected was divided into 2 data forms entailed in a comparative analysis chart for the city’s 12 parks at different times of the day, and a clustered analysis using 4 data clusters grouped based on the profiles of survey responders. The study concluded that the educational, social, and environmental effects of the parks are significant, suggesting an array of programs that can be used to enhance urban redevelopment and showed the role of parks in environmental awareness for cities in the future.
Key words : Urban parks, Park programs, Environmental awareness, Future development, Sustainability
1)
1. Introduction
Korea has a total population of 51.5 million people with 91.8% of the entire population living in urban areas and an annual population increase of 5.9%. Anyang, the 20th largest city in South Korea, has about 600,000 residents and is faced by the challenges of urbanization like pollution, environmental interruption, loss of biodiversity and damage to the ecosystem as well as the
urban heat island effect (Jang, 2006). City parks can help alleviate challenges associated with the city’s concrete jungle by restoring the ecosystems, enhancing the quality of life and encouraging the consumption of food that is environmentally friendly (Eom and Jang 2016;
Panduro et al., 2018). The quality of life is enhanced by natural assets and resources like water resources and trees which are largely found in urban areas (Hakimizad et al., 2015). In South Korea, city residents enjoy many
Received 30 October, 2019; Revised 5 December, 2019;
Accepted 5 December, 2019
*Corresponding author: Eom Boong-Hoon, Department of Landscape Architecture, Daegu Catholic University, Gyeongsan 38430, Korea Phone: +82-53-850-3189
E-mail: [email protected]
ⓒ The Korean Environmental Sciences Society. All rights reserved.
This is an Open-Access article distributed under the terms of the Creative Commons Attribution Non-Commercial License (http://
creativecommons.org/licenses/by-nc/3.0) which permits unrestricted non-commercial use, distribution, and reproduction in any medium, provided the original work is properly cited.
benefits of having city parks like improving the quality of life by increasing the value of green spaces and urban parks.
The green spaces and urban parks play the role of enhancing the aesthetics and beauty of cities as well as reducing pollution using trees. Parks also grant citizens environmental benefits like reducing the effect of warmer temperatures not common in the surrounding countryside. This is called the urban heat island effect and is caused by the city’s dark, flat, and concrete surfaces (Bristow et al., 2009). The parks further provide an avenue for absorbing excess storm-water as they have unpaved grounds to absorb this water (Nurdogan, 2017).
Other benefits from urban parks include the equal right for access to facilities that promote a community spirit, meeting and interacting with different park goers, and other indirectly linked services when enjoyed visiting parks. Urban parks make cities attractive and more liveable, which is an important aspect in the city culture and the quality of life (Chiesura, 2004). The Anyang city offers several events and programs in its 12 parks with the city’s redevelopment plan aimed at increasing the value and usability of Anyang’s parks for improved quality of life for the residents (Kim and Kim, 2011).
This study’s overall objectives are to establish the elements and properties of the parks that attract visitors and the recreational experience quality obtained. The specific objectives include to highlight the park feature’s diversity for the respective activity and experience they are known for and understanding how it correlates to its attractiveness to visitors. They also include to identifying the forces of supply and the demand of urban park services in Anyang, finding solutions to the problems posed by the encryption of these parks, and highlighting what law enforcement and security developers should do to ensure the parks meet the demands of park goers. This will guide the planning and management of the park facilities for city dwellers with different interests (Voigt et al., 2014).
2. Literature Review
2.1. Benefits of urban park
Chiesura(2004) established that urban parks are important for cities as they promote city dwellers' quality of life and allow them to enjoy social and environmental benefits. This was seconded by Wijewardhana and Ramanayaka(2010) who suggest paying attention to the design of the park and the activities offered in a manner that considers the cultural, social and psychological needs of the different people. Making park's ambiance appealing to city dwellers ensure that they will visit the parks and enjoy their benefits. Jeong et al.(2012) and Eom and Jang(2016) have found benefits of urban green spaces like physical and mental strength, promoting health, environmental benefits, and the cultivation of a sense of community. City dwellers’ motivation to visit parks is increased by the knowledge of these benefits while the visual quality of the park determines the perception of the parks thus determining its level of satisfaction (Eom and Han, 2011). This study will address the case of the city of Anyang in South Korea and establish the effects of the park on city residents while looking at the level of satisfaction and preferences in park activities (Kim et, al., 2010; Kim and Kim, 2011).
2.2. Mental health theory with respect to Anyang city residents
There are several aspects that are linked the significance of the green spaces and parks’ role in boosting the morale of the individuals and improving their quality of life (Oblinska, 2018). The research carried out in this field takes a different approach to handle the situations closely linked to the mental health issues among the overall health and environmental problems experienced in the city under study (Yun et. al., 2014). The literature recommends that the participation of the citizen in forming the forces used to reduce delinquency cases, especially in the industrial cities such as Anyang (Kim and Kim, 2011; Yoon and Yoon, 2011).
It is important to note that there are some issues in the
current world. The criteria of one’s life corresponds with the idea of resolving issues that are linked to the right way Korean families should live. The intersection and interaction between Anyang city and the mental health in the program within the city leads to the realization that there are some issues that still needs to be handled, depending on the level of urgency. However, this paper refutes the idea because every significant or confusing situation has to be handled as soon as possible.
2.3. Validity and reliability of questionnaire survey Validation of the questionnaire items were done to guarantee that the questionnaire was a reliable instrument, and thus, a valid instrument for data collection (Eom and Han, 2011). The reliability test of the questionnaire items was conducted by testing the internal consistency of the items using Cronbach's α.
Cronbach's reliability test uses a score above 0.80 to indicate a high reliability, meaning that the questionnaire items' are valid regarding the study objectives (Panduro et al., 2018). The respondents of the questionnaire were then recruited based on results of this test, meaning that the methodology selected was intended to help with the process of data collection in terms of phrasing questions to make the respondent gave only the required information.
The method of participant selection was non-discriminative as the survey sought to capture a good representation of the city residents. The only limitation was the maximum number of surveys to be conducted in the 12 parks allowing only one questionnaire to be filled in for the three different times of the day. This yielded three questionnaires daily over a span of 30 days, which totaled 90 questionnaires per park (Panduro et al., 2018). The results obtained highlighted information that can be used to redevelop parks in the city. In total, ninety respondents per park were selected to assess their knowledge of the parks to ensure even investigation using a sample which was representative of all the city dwellers (Madakam and
Holmukhe, 2019). The results were analyzed both individually according to the corresponding cohort of respondents as well as in a group to guarantee the reliability of the factors considered in establishing the overall impacts of parks on city dwellers and the preference of respondents regarding park activities.
3. Research Method
3.1. Criteria in selecting the study site
With the escalated levels of education and increased income in the 1960s, there was enormous economic growth in the region and this gesture led to the institutionalisation of the modern urban parks. During this period, Anyang residents developed the parks in the region and concentrated on the green space technology in managing the environment within the town (Madakam and Holmukhe, 2019). The awareness of the individuals increased based on the transformations of animal and plant parks to sports and culture parks (Kim et, al., 2010; Kim and Kim, 2011). This led to the diversification of the functions of the parks in Anyang city. From the year 1990, there was a paradigm shift in the meaning of the parks, where they came to be seen as utilities for the citizens and in the improvement of the environment as well. Moreover, with the escalated modernization and urbanization rates in the region, there is a change from the traditional agricultural lifestyle to a five-day work week. This led to the development of green spaces and beautiful parks that are deemed significant in the quality life in the city (Kim et, al., 2010; Kim and Kim, 2011; Eom and Jang, 2016;
Oblinska, 2018).
The survey was preceded by a pilot interview on 20
citizens living in Anyang city and followed by the actual
study conducted by randomly selecting a sample
population from the visitors to the parks. Respondents
were informed about the survey prior to conducting the
process and taken through the objectives and the study
and process of answering the questions. A total 1080
Name of park Type by law Location Area
(m2) Characteristics
Pyeonghwa Neiborhood Buheung-dong, Dongan-gu 10,019 Residential, flat urban forest, walkways
Hwemang Neiborhood Hogye-dong, Dongan-gu 9,635 Residential, flat urban forest, walkways
Hakwoon Neiborhood Pyeongchon-dong,
Dongan-gu 52,843 Riverside, flat sports facilities(soccer), walkways, parking lot
Pyeongchon Neiborhood Burim-dong, Dongan-gu 39,499 Business district, flat lawn and trees, walkways
Jayu Neiborhood Hogye-dong, Dongan-gu 192,491 Residential, mountain forest, art hall, playground, walkways
Myeonghak Neiborhood Anyang 8-dong, Manan-gu 11,314 Residential, flat urban forest, playground, walkways
Woongog Neiborhood Bisan 3-dong, Dongan-gu 30,148 Residential, hilly forest, memorial, wildflowers, walkways
Pyeongchon
Central Neiborhood Pyeongchon-dong,
Dongan-gu 119,843 Business district, flat lawn and trees, plaza, sports, walkways
Samdeok Neiborhood Anyang-dong, Manan-gu 19,376 Riverside, flat urban forest, playground, plaza, walkways
Bottleneck
Citizen’s Athletic Anyang-dong, Manan-gu 91,728 Suburban, mountain forest, walkways, lawn playground, parking lot
Bisan Athletic Athletic Pyeongchon-dong,
Dongan-gu 58,594 Mountain valley, sports grounds, Seoksu
Athletc Athletic Anyang-dong, Manan-gu 77,786 Mountain foot, sports (baseball, soccer, footsal) Anyang art Culture Seoksu-dong, Manan-gu 211,364 Mountain valley, museum, culture park, parking lot Table 1. List of parks in Anyang as survey sites
visitors answered to the survey and the results computed based on the percentage and frequency; then a 5-point Likert scale was utilized in the analysis of the opinions on the mode and methods of expanding the green spaces and the parks (Eom and Han, 2011).
The questionnaire survey was conducted in 12 urban parks of Anyang, namely Pyeonghwa, Hwemang, Hakwoon, Pyeongchon, Jayu, Myeonghak, Woongog, Pyeongchon Central, Samdeok, Bottleneck Citizen’s, Bisan Athletic, Seoksu Athletic and Anyang Art. The study followed the questionnaire survey research methodology where questionnaires were issued across the 12 parks of Anyang at 3 different times of the day, every day for 30 days. To make the sampling equal
across all the parks, one park visitor was allowed to participate in each of the parks so that 3 questionnaires could be answered in a day for each park. The main sources of materials used for the study include a number of peer-reviewed journal articles, survey results and discussions of the existing surveys (Kim et, al., 2010;
Kim and Kim, 2011). The respondents made up a sample group of 30 participants per park, totalling 1,080 final survey to be data analyzed. The list of parks, type by law, location, areas, characteristics are shown in Table 1.
3.2. Research design
Research papers were reviewed and reworked into
survey questions on the preference of types and activities
in urban parks (Kim et, al., 2010; Kim and Kim, 2011;
Jeong et al., 2012; Jeong et al., 2013; Eom and Jang, 2016; Oblinska, 2018). Validating the questionnaire items was done to guarantee that the questionnaire was a reliable instrument, and thus, a valid instrument for data collection. The reliability test of the questionnaire items was conducted by testing the internal consistency of the questionnaire items using Cronbach’s α value.
Cronbach’s α value test uses a score above 0.80 to indicate a high reliability, meaning the questionnaire items’ validity regarding study objectives.
Expert professors examined the survey items for validating the assessment tools. The professor's input was helpful in guaranteeing the validity of the questionnaire as they helped to assess its face validity by reading through the items of the survey and assessing the psychometrics of the study. The advice on pilot testing the survey was helpful as it was able to highlight weak points of the study and irrelevant sections that could be dropped. Consultation with professors aided to identify underlying principal components and factor loadings being measured by the survey questions by identifying common themes (Yoon and Yoon, 2011). Identifying the factors aided to guarantee the validity of the study, as the aspects being measured by the survey should be the emerging factors in the valid survey. The professors' input was essential for confirming the questionnaire's internal consistency of the identified factors in the principal component analysis by Cronbach's alpha test to ensure the study's reliability. Finally, the professors helped to revise the assessment tool based on the data gained in Cronbach's alpha and the Principal Component Analysis to identify the questions that had their own individual weight. The survey covered one demographic characteristic, eight awareness items and 40 Likert-scale items on the awareness of urban parks.
The questionnaires were administered at the individual parks to visitors who visited the park at three different times of the day. The method of participant requirement was non-discriminative as the survey
sought to capture a good representation of the city residents. The only limitation was the maximum number of surveys to be conducted in the 12 parks, allowing only one questionnaire to be filled in for the three different times, yielding three questionnaires daily and answered over a span of 30 days totalling 90 questionnaires per park.
3.3. Data analysis
The data collection was carried out through a questionnaire coded and cleaned for analysis using an internet-based program known as Google Forms along with an MS-Excel data analysis add-on known as XLSTAT. To obtain the demographic characteristics of the respondents, a frequency analysis was conducted, and the meaning and variance of the results were compared for both the activities preferred and the awareness levels of there effects. Reliability tests were conducted using Cronbach’s alpha, while the validity of the variables was analyzed using the varimax rotation exploratory factor analysis.
4. Results and Discussions
Demographic characteristics questions were included in the questionnaire to identify characteristics like age, ethnicity, gender, income, education level, years of experience, type of the visitor, and even where the respondents came from in Anyang city. A frequency analysis was used to identify the demographics and indicated an equal result of 33.33% for different times, as summarized in Table 2. The intention in using the time of day variable was to identify when people with different demographic characteristics go to the park.
4.1. Demographics of respondents
The item for demographic characteristics was the
current time of the day. The result of the frequency
analysis for this demographic characteristic is shown in
Table 2. In the morning, mid-day and evening were all
equal at 33.33%.
Variable Categories Frequency %
Time of day
Morning 360 33.33
Mid-day 360 33.33
Evening 360 33.33
Total 1080 100.0
Table 2. Demographics of respondents
Variable Categories Frequency %
Experience period
Less than 1 year 260 24.07
1 ~ 4 years 314 29.07
5 ~ 9 years 220 20.37
More than 10 years 286 26.48
Total 1080 100
Satisfaction of experience
Very dissatisfied 43 3.98
Dissatisfied 23 2.13
Neither dissatisfied nor satisfied 101 9.35
Satisfied 679 62.87
Very satisfied 234 21.67
Total 1080 100
Future ongoing intention
Definitely no 8 0.74
No 8 0.74
Not sure 86 7.96
Yes 536 49.63
Definitely yes 442 40.93
Total 1080 100
Table 3. Experience extents of urban parks
The study involved collecting data at different times of the day. During the morning, data was collected for a total of three hours from 8 a.m. to 11 a.m. During the mid-morning, the data was collected from 11 a.m. to 2 p.m. For the evening section, data was collected from 2 p.m. to 5 p.m. From this, it was observed that the demographic frequency was at 360, and therefore, resulting in a 33.33% distribution.
4.2. Awareness on urban parks experience 4.2.1. Parks experience, satisfaction and ongoing
intention
The respondents’ experience of urban parks are
shown in Table 3. The respondents with <1-year experience in the parks make up 24.07% while those whose experience is between 1 and 4 years made up 29.07%. Subsequent experience cohorts 5-9 years and
>10 years obtained scores of 20.37% and 26.48%,
respectively. This shows that over 75% of the
respondents had more than a year’s experience of the
parks, indicating a strong park-going culture. The results
also demonstrate a high level of satisfaction with the
parks experiences and activities as > 84% of respondents
were more than moderately satisfied, confirming the
claim that more satisfactory experiences encourage more
benefits. The results also demonstrated strong intentions
Categories Frequency %
To increase the city’s air, water, and visual quality. 156 14.44
For hobbies and leisure. 275 25.46
To increase the physical and mental health of its citizens. 511 47.31
To provide “outdoor classrooms” for children. 77 7.13
To be a place for community interaction. 28 2.59
To be a place for animals to live. 11 1.02
To help reduce the noise and temperature of the city. 22 2.04
Total 1080 100.0
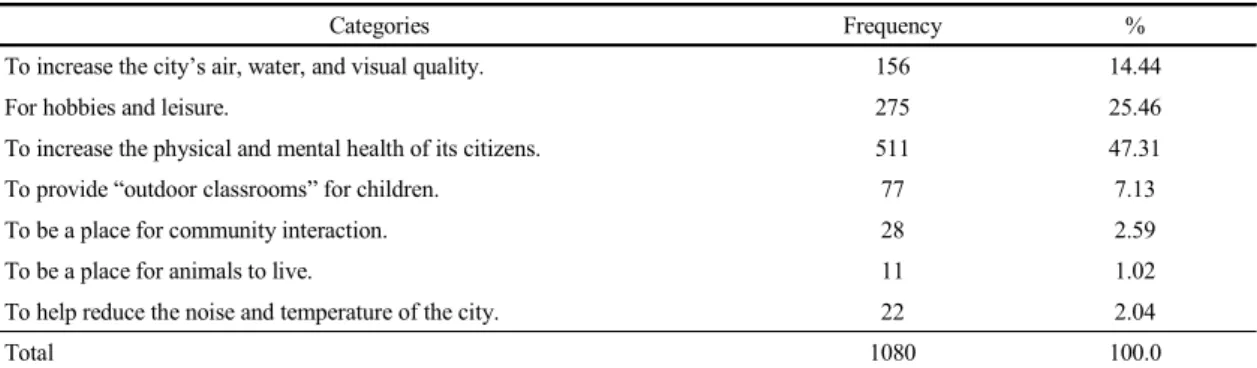
Table 4. Purpose for urban park activities
for future park visit: >90% of respondents more than moderately agreed that they had intentions to pursue more activities in the future.
4.2.2. The goal of park activities
The most popular goals according to the response were the promotion of mental and physical health and creating spaces for leisure and hobby activities, with high frequencies of 47.31% and 25.46% respectively.
Further, the motivation of improving the air, water, and environmental quality also had a significant score of 14.44%, while that of giving animals a home was lowest at 1.02%, as detailed in Table 4. This indicates that the park participation by city dwellers is for them to enjoy the benefits that having parks in cities offers.
4.2.3. Knowledge of existing park activities The frequency of awareness on urban park is shown in Table 5. The most popular way to experience park activities according to the respondents was with family and spouse, at a score of 48.52%, while colleagues and friends came in at 38.06%. The study established that information sources about the park activities were friends, family, and community at 56.20%, while media platforms were less common at only 9.81%; other sources had a frequency score of 25.46%. In total, 47.41% showed an intention to visit the park again in the future, while 20.93% were sure they would visit the park in the future. The implication of high participation with family shows that the city has created a strong park
culture that involves both families and friends. Initially, 68.34% of the respondents strongly agreed to participate, implying there was a risk of the visitors being influenced by the park architecture to participate in more activities. This implies that the culture is expected to grow as more and more people are motivated to go and experience the different activities in the parks.
4.3. Knowledge of park effects
Twenty variables were used to establish the knowledge of the respondents on the effects of the park on city dwellers. The reliability of the values was tested using Cronbach’s α, which yielded a score of 0.885 indicating significant internal consistency. Promoting health was found to be the most significant effect, scoring 4.24 out of 5 points. The results are detailed in Table 6 and indicate that the negative impacts of the park were overlooked by the respondents. A Kaiser-Meyer -Olkin test was used to analyze the exploratory factor of the validity test and yielded a KMO value of 0.916, indicating that the factors analysed are valid and adequate because they were common in the respondents’
answers. The varimax rotation methods were used for factors with an eigenvalue >1 to guarantee that the construct validity criterion of each variable was >0.6, and thus, to verify it. The variance percentage for the health promotion factor was only 13.63% while that for psychological safety was on 10.88% and 5.16%, 7.71%
and 6.18% respectively for factors 3, 4 and 5. The
Variable Categories Frequency %
Partners
Spouse and family 524 48.52
Neighbors 63 5.83
Friends and colleagues 411 38.06
Etc. 82 7.59
Information gathering
Newspaper, broadcasting and internet 106 9.81
Related books, magazines, and brochures 11 1.02
Friends, family, and other members of the community 607 56.20
City government offices 53 4.91
Outdoor recreation professionals 28 2.59
Etc. 275 25.46
Participation intention of urban park activities
Strongly disagree 8 0.74
Disagree 24 2.22
Moderate 310 28.70
Agree 512 47.41
Strongly agree 226 20.93
Total 1080 100.0
Table 5. Frequency of awareness on urban parks
percent of factor 1 for total variance was 30.35%, factor 2 was 4.99%, factor 3 was 3.30%, factor 4 and factor 5 were 2.83% and 2.10% respectively. This clearly indicates that the city residents visited the parks because of their cognisance of the benefits and positive effects that city parks had on them.
4.4. Preference in type of park activities
As shown in Table 6, twenty variables were used to test the reliability of the preference in the types of park activities that the respondents liked. A very high Cronbach’s α value was established at 0.927 without a recommendation to exclude any variable implying a high variable reliability, and thus, internal consistency.
The preference of supporting environmental quality government laws obtained the highest score out of 5 Likert-scale points, followed closely by “Participating in health awareness events” and “outdoor sporting and camping participations” at 3.91 and 3.86 points respectively. The study also had an exploratory factor that was a KMO value of 0.941, indicating common
variables used adequately and validly. Loading factors that were at recommended levels included the “schools learning eco-practices,” “outdoor sporting and camping participation” and “agricultural and sustainable practices”
as summarized in Table 6. Citizens can thus be said to prefer activities that encourage the positive impacts of parks on the city, as in the case of participating in environmental training and leadership programs.
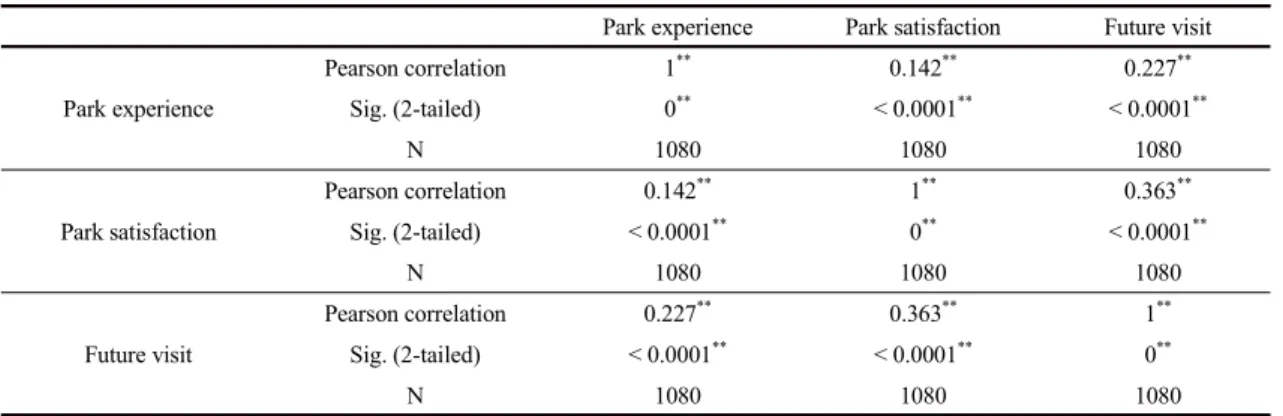
4.5. Correlation analysis of respondent’s park experience and park satisfaction
A correlation analysis was conducted to determine the relationship between the respondent’s park experience and park satisfaction using four variables, that are detailed in Table 7. The correlation results are summarized in Table 8. A Pearson correlation coefficient of < 0.0001
**was established where “park satisfaction” and “intention for future visits” met, as well as where “park satisfaction” and “park experience” met.
The correlation between “intention for future visits” and
“park satisfaction” is much stronger, and the three park
Component Factor
Loadings α Eigen value
% of
Variance Communality M±SDz
Factor1
1) Health promotion .594
.806 6.069 30.35
.386 4.24±0.72
2) Psychological sense of safety and stability .482 .328 3.87±0.79
3) Recovery of humanity through nature sympathy .613 .506 4.10±0.77
4) Revitalization of local community .691 .578 4.13±0.76
5) Effect of learning experience related to the environment .539 .432 4.02±0.80
6) Activation of recreation through local activities .457 .387 3.90±0.82
Factor2
7) Create employment in the city .608
.777 .998 4.99
.516 3.46±0.86
8) Caters to people with disabilities .561 .467 3.75±0.87
9) Promotion of urban and rural exchanges .722 .614 3.52±0.89
10) Economic benefits (Commerce) .362 .244 3.22±0.95
11) Prevention of urban floods and disasters .508 .557 3.64±0.91
Factor3
12) Positive park sanitary practices .461
.621 .659 3.30
.419 3.75±0.86
13) Adequate playground equipment and sports facilities .669 .520 3.56±0.80
Factor4
14) Mitigation of the urban heat island phenomenon .712
.746 .565 2.83
.674 3.98±0.85
15) Improving the local environment .529 .546 4.18±0.76
16) Available signage and resources on park data .372 .416 3.87±0.78
Factor5
17) Make changes in exercise .337
.560 .420 2.10
.206 3.44±0.85
18) Lack of space for park activities .504 .312 3.61±0.92
19) Occurrence of environmental pollution .511 .300 3.11±0.99
20) Caters to urban wildlife (ex. squirrels, birds, etc.) .416 .304 3.50±0.96
zMean±Standard Deviation Cumulative % = 43.56, KMO = .916,
Mean = Average value of 5-point Likert Scale (1=strongly disagree, 5=strongly agree) Table 6. Cognition of the overall effect of urban parks
experience and park satisfaction variables are not strongly correlated. This indicates weaker positive and negative correlations, implying that the citizens were motivated to visit the park in the present and in the future due to the satisfaction they felt with the effects and benefits of urban parks.
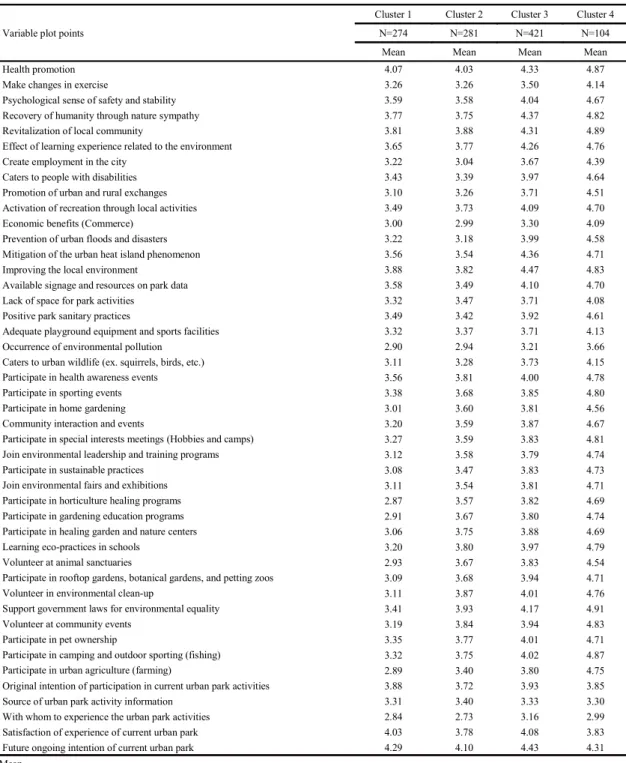
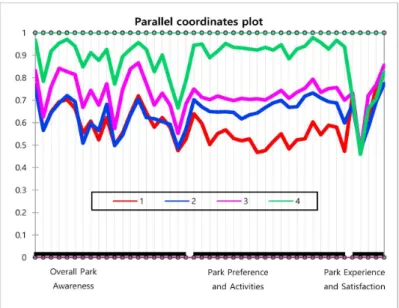
4.6. Cluster analysis and parallel Analysis of respondent’s factor of awareness
Both multiple parallel and cluster analyses on the
respondent’s knowledge of the parks were conducted for all 1,080 participants recruited through the random sample of park visitors, based on a total of 45 variables.
With the foundation on the proximity of the parks to the initial respondent cluster, 4 dendrogram clusters were used to show the differences in the characteristics of the 45 variables used in the questionnaire, as described in Fig. 1. and Table 9.
The results of the parallel analysis indicate four clear
profiles of the respondents, as indicated in the
Variables N M±SDz You usually participate in the activities that you plan for at this city park. 1080 3.86±0.80
Are you satisfied with this city park? 1080 3.96±0.87
Do you plan to continue visiting this city park? 1080 4.29±0.70
N=Number of observations
zMean±Standard Deviation
Mean=Average value of 5-point Likert Scale(1=not at all prefer, 5=very highly prefer) Table 8. Descriptive analysis of park experience and park satisfaction
Measurement item Factor
Loadings α Eigen
value
% of
Variance Communality M±SDz
Factor1
Learning eco-practices in schools .476
.861 8.024 40.12
.437 3.81±0.79
Volunteer at animal sanctuaries .600 .456 3.63±0.87
Participate in rooftop gardens, botanical gardens, and
petting zoos .620 .523 3.73±0.80
Volunteer in environmental clean-up .719 .625 3.82±0.79
Support government laws for environmental equality .553 .409 3.99±0.78
Volunteer at community events .594 .501 3.81±0.75
Participate in pet ownership .528 .312 3.85±0.97
Participate in urban agriculture (farming) .431 .400 3.56±0.90
Factor2
Participate in health awareness events .535
.830 .971 4.86
.355 3.91±0.70
Participate in sporting events .666 .466 3.78±0.81
Participate in home gardening .417 .381 3.62±0.81
Community interaction and events .610 .486 3.71±0.75
Participate in special interest meetings
(Hobbies and camps) .637 .497 3.72±0.83
Join environmental leadership and training programs .497 .498 3.66±0.76
Participate in camping and outdoor sporting (fishing) .478 .418 3.86±0.82
Factor3
Participate in sustainable practices .473
.866 .708 3.54
.498 3.63±0.77
Join environmental fairs and exhibitions .546 .487 3.65±0.80
Participate in horticulture healing programs .742 .701 3.60±0.80
Participate in gardening education programs .767 .731 3.63±0.80
Participate in healing garden and nature centers .612 .523 3.72±0.78
zMean±Standard Deviation Cumulative % = 48.52, KMO = .941,
Mean=Average value of 5-point Likert Scale(1=not at all prefer, 5=very highly prefer) Table 7. Preference of type and activity in urban parks
Park experience Park satisfaction Future visit
Park experience
Pearson correlation 1** 0.142** 0.227**
Sig. (2-tailed) 0** < 0.0001** < 0.0001**
N 1080 1080 1080
Park satisfaction
Pearson correlation 0.142** 1** 0.363**
Sig. (2-tailed) < 0.0001** 0** < 0.0001**
N 1080 1080 1080
Future visit
Pearson correlation 0.227** 0.363** 1**
Sig. (2-tailed) < 0.0001** < 0.0001** 0**
N 1080 1080 1080
** Correlations are different from 0 and significant at 0.05 level (2-tailed).
Fig. 1. Dendrogram of participant profiles.
Table 9. Correlation analysis of park experience and park satisfaction
dendrogram in Figure 2. The first of these four distinct clusters has 274 members with a low level of park knowledge engagement and a low level of park preference engagement. The results indicate the highest knowledge engagement for “promoting health” at 4.07 while the lowest knowledge engagement was for
“mitigation of pollution” at 2.90. The highest preference
engagement was “health awareness event participation”
at 3.56, while its lowest was “participation in healing
programs through horticulture” at 2.87. The park
experience and satisfaction results showed the highest
engagement in “on-going and future plans to use park
activities” and the lowest engagement in “knowledge of
the park activities” at 4.29 and 2.84 respectively.
Variable plot points
Cluster 1 Cluster 2 Cluster 3 Cluster 4
N=274 N=281 N=421 N=104
Mean Mean Mean Mean
Health promotion 4.07 4.03 4.33 4.87
Make changes in exercise 3.26 3.26 3.50 4.14
Psychological sense of safety and stability 3.59 3.58 4.04 4.67
Recovery of humanity through nature sympathy 3.77 3.75 4.37 4.82
Revitalization of local community 3.81 3.88 4.31 4.89
Effect of learning experience related to the environment 3.65 3.77 4.26 4.76
Create employment in the city 3.22 3.04 3.67 4.39
Caters to people with disabilities 3.43 3.39 3.97 4.64
Promotion of urban and rural exchanges 3.10 3.26 3.71 4.51
Activation of recreation through local activities 3.49 3.73 4.09 4.70
Economic benefits (Commerce) 3.00 2.99 3.30 4.09
Prevention of urban floods and disasters 3.22 3.18 3.99 4.58
Mitigation of the urban heat island phenomenon 3.56 3.54 4.36 4.71
Improving the local environment 3.88 3.82 4.47 4.83
Available signage and resources on park data 3.58 3.49 4.10 4.70
Lack of space for park activities 3.32 3.47 3.71 4.08
Positive park sanitary practices 3.49 3.42 3.92 4.61
Adequate playground equipment and sports facilities 3.32 3.37 3.71 4.13
Occurrence of environmental pollution 2.90 2.94 3.21 3.66
Caters to urban wildlife (ex. squirrels, birds, etc.) 3.11 3.28 3.73 4.15
Participate in health awareness events 3.56 3.81 4.00 4.78
Participate in sporting events 3.38 3.68 3.85 4.80
Participate in home gardening 3.01 3.60 3.81 4.56
Community interaction and events 3.20 3.59 3.87 4.67
Participate in special interests meetings (Hobbies and camps) 3.27 3.59 3.83 4.81
Join environmental leadership and training programs 3.12 3.58 3.79 4.74
Participate in sustainable practices 3.08 3.47 3.83 4.73
Join environmental fairs and exhibitions 3.11 3.54 3.81 4.71
Participate in horticulture healing programs 2.87 3.57 3.82 4.69
Participate in gardening education programs 2.91 3.67 3.80 4.74
Participate in healing garden and nature centers 3.06 3.75 3.88 4.69
Learning eco-practices in schools 3.20 3.80 3.97 4.79
Volunteer at animal sanctuaries 2.93 3.67 3.83 4.54
Participate in rooftop gardens, botanical gardens, and petting zoos 3.09 3.68 3.94 4.71
Volunteer in environmental clean-up 3.11 3.87 4.01 4.76
Support government laws for environmental equality 3.41 3.93 4.17 4.91
Volunteer at community events 3.19 3.84 3.94 4.83
Participate in pet ownership 3.35 3.77 4.01 4.71
Participate in camping and outdoor sporting (fishing) 3.32 3.75 4.02 4.87
Participate in urban agriculture (farming) 2.89 3.40 3.80 4.75
Original intention of participation in current urban park activities 3.88 3.72 3.93 3.85
Source of urban park activity information 3.31 3.40 3.33 3.30
With whom to experience the urban park activities 2.84 2.73 3.16 2.99
Satisfaction of experience of current urban park 4.03 3.78 4.08 3.83
Future ongoing intention of current urban park 4.29 4.10 4.43 4.31
zMean
Mean=Average value of 5-point Likert Scale(1=not at all prefer, 5=very highly prefer)
*Selections from information sources, park experience, and future visits were assigned numerical values of 1 to 6, 1 to 4 and 1 to 4 respectively.
*Corresponding mean columns were color coded according to the dendrogram.
*Corresponding variable plot point columns were color coded according to the parallel diagram plot points.
Table 9. Parallel analysis variable plot points of participant profiles (left to right)
Fig. 2. Parallel analysis of participant profiles by clusters.
The second cluster has 281 members with a low level of park knowledge engagement and a moderate level of park preference engagement. The results of this cluster are similar to those of the first one with the actual scores varying by the matter of points and the latter having lower scores, except in the lowest level of preference engagement being “urban farming opportunities” at 3.40. The third cluster had 421 members with a moderate level of park knowledge engagement and a moderate level of park preference engagement. Cluster 4 had 104 members, which had a high knowledge engagement and a high level of park preference engagement as well.
5. Discussion
The results obtained in this study indicate the city parks play a critical role in providing city dwellers with green living space as it has many environmental and social benefits. This has been evidenced by the results collected in the 12 parks considered for this study as the most popular benefits include “promoting health,” “local
community revitalization”, and “environmental
enhancement.” This is in line with Jang(2006), who
states urban green spaces have social, environmental,
economic, educational, and even health effects on city
dwellers. The study establishes that satisfaction and
preference of park activities are determined by its
diversity of the activities that meet the demands of
park-goers to keep going to parks. This is in line with the
findings of Bristow et al.(2009), who suggest designing
parks in compliance with the interests, experiences,
demands, and values of the citizens to allow the equal
access and right to the health, social, environmental, and
even mental benefits associated with parks. This can be
achieved by enhancing the landscape and diversity of
tree species in the urban parks using park eco-practices
and even promoting security to allow people to
participate in physical and mental effects for their own
gain. This study has brought out the importance of parks
to different age-groups and interest groups as activities
like learning and farming programs as well as
eco-practices and environmental programs have been
found to be highly satisfactory and having a high engagement. This agrees with Chiesura(2004) who states the need for everyone’s participation and sympathy to ensure the park’s standards remain acceptable and appealing to its visitors.
6. Conclusion
The goal of this study was to elucidate the knowledge levels of the residents of Anyang about the educational, social, and environmental impacts of city parks on the citizens. The topics surveyed were the motivation for visiting the park and the preference for types of activity.
The results highlighted information that can be used to redevelop parks in the city. Ninety respondents per park were selected to assess the respondents’ knowledge of the parks to ensure a fair investigation using a sample which was representative of all city dwellers. The results were analyzed both individually according to the corresponding cohort of respondents as well as in a group to guarantee the reliability of the factors considered in establishing the overall impacts of parks on city dwellers and the preference of respondents toward park activities.
The purpose and motivation of using park facilities were found to be “improving the mental and health fitness” as well as “leisure and hobbies” according to the frequency analysis. Almost half of the respondents agreed that they take their “family and spouse” as a partner, given their knowledge of the park activities. The most popular health effects identified by the respondents included “promoting health,” “empathising with nature for humanity’s recovery,” “local community revitalization,” “environment enhancement through learning”, and “environmental enhancement.” On the other hand, the most strongly preferred park activities included “gardening education programs participation,”
“participation in nature centres and healing gardens,”
“schools learning eco-practices,” “environmental clean-up volunteering” and “supporting environmental
quality government laws.”
The findings of the research conclude that Anyang residents are highly aware of and have had experiences of the parks in their city. Regardless of the current state of urban redevelopments in the city, the parks have been found to have highly positive overall impacts on the city.
These impacts have been projected to spur education and leadership programs for future gains as well as the provision of information to support these programs, and thus, enhance these positive impacts on urban development. These results can also serve as a basis for further research on the environmental awareness of Anyang residents and guide the implementation of city parks in the future.
As much as this study aimed to gain insight into the awareness and attitudes of the residents in Anyang toward the parks and green spaces in the city, there were some limitations and constrains. Due to the small population samples and the limited statistics and sites used in the study, the results cannot be generalized as they only relate to the populations of Anyang region in South Korea. Therefore, they cannot be used to understand the attitudes of other residents in other cities around the world (Yoon and Yoon, 2011). This calls for a comparative analysis that bring in other regions and countries and examines their citizen’s attitudes toward the green spaces and urban parks to achieve a complete understanding of the urban sustainability across the globe in line with the issues present in the context of the Korean cities.
REFERENCES
Bristow, R. S., Blackie, R., Brown, N., 2009, Parks and the urban heat island: A longitudinal study in Westfield, Massachusetts. In Proceedings of the 2010 Northeastern Recreation Research Symposium pp.
224-230. Newtown Square, PA: U.S. Department of Agriculture, Forest Service, Northern Research Station.
Chiesura, A., 2004, The role of urban parks for the
sustainable city, Landscape and Urban Planning, 68(1), 129-138.
Eom, B. H., Han, S. M., 2011, Analysis of changes in citizen satisfaction with parks and green spaces in Daegu city, Korea, J. Kor. Land. Arch., 39(6), 67-75.
Eom, B. H., Jang, E. J., 2016, Awareness of Daegu Citizens on Urban Agriculture, J. Kor. Soc. People, Plants and Environ., 19(6), 539-547.
Hakimizad, S., Asl, S. R., Ghiai, M. M., 2015, Renewable energy harvesting approach in the design of the urban parks, Advances in Architecture, City and Environ -ment, 1(2), 22-32.
Jang, D. H., 2006, Study on ecology-oriented urban agriculture, Chonju: Chonbuk National University.
Jeong, S. J., Lee, S. M., Lee, Y. J., Song, Y. J., Moon, J. H., 2012, Preference and needs of users and staffs in botanical gardens and arboretums for activities related to urban agriculture, J. Kor. Soc. People, Plants and Environ., 15(6), 501-510.
Jeong, S. J., Lee, S. M., Moon, J. H., Lee, Y. J., Song, Y. J., 2013, Preference and needs of users in the urban park for activities related to urban agriculture, J. Kor. Soc.
People, Plants and Environ., 16(4), 217-225.
Kim, Y. I., Kim, J. G., An, J. S., Choi, A. H., 2010, Citizen satisfaction model for urban parks and greens, J. Kor.
Land. Arch., 38(3), 62-74.
Kim, Y. I., Kim, J. G., 2011, Citizens’perception and satisfaction for urban parks and greens, J. Kor. Plann.
Asso., 46(1), 157-170.
Lee, B. N., Yang, D. H., Lee, E. H., 2013, Analysis of policy and current status in urban agriculture, J. Kor.
Soc. People, Plants and Environ., 16(3), 151-159.
Madakam, S., Holmukhe, R. M., 2019, Songdo smart city:
An Aerotropolis and a ubiquitous city, big data analytics for smart and connected cities, IGI Global, 278-298.
Nurdogan, N., 2017, Urban parks for urban future, Istanbul: Istanbul Arel University.
Oblinska, K., 2018, The value of urban parks in Lodz, J.
Real. Esta. Manage. and Valua., 26(1), 73-88.
Panduro, T. E., Jensen, C. U., Lundhede, T. H., von Graevenitz, K., Thorsen, B. J., 2018, Eliciting preferences for urban parks, Regional Science and Urban Economics, 73, 127-142.
Voigt, A., Kabisch, N., Wurster, D., Hasse, D., Breuste, J., 2014, Structural diversity: A Multi-dimensional approach to assess recreational services in urban parks, Salzburg: Kungl, Vetenskaps-Akademien.
Wijewardhana, H. M. P., Ramanayaka, A. R. N. D., 2010, An Impact of urban parks on human well-being in terms of social relations, Kelaniya: University of Kelaniya.
Yoon, E. J., Yoon, Y. H., 2011, A Study on the introduction of urban agriculture to permanently rental apartment complexes, J. Land, Housing, and Urban Affairs, 2(2), 93-99.
Yun, J. W., Kim, U., Yang, J. Y., 2014, A Study on the development of urban park environment measurement model for citizens, J. Kor. Space Design, 9(4), 129-138.
Zammataro, A., 2018, Phenomenal deformations: affordance as an architectural design tool to deal with subject -object complementarity in occupancy, symposium arquitectonics mind, land and society 2018: Looking for the human condition of architectural and urban design research practices and theories, Universitat Politcnica de Catalunya, 2018.
∙PhD candidate. Tony Marshall
Department of Urban Information Engineering, The Graduate School, Anyang University
∙Professor. June-Ho Jang
Faculty of Urban Information Engineering, Urban Planning, Anyang University
∙Professor. Boong-Hoon Eom
Faculty of Landscape Architecture, Daegu Catholic University [email protected]