• 검색 결과가 없습니다.

LOCAL ULTRALUMINOUS INFRARED GALAXIES IDENTIFIED IN THE AKARI ALL SKY SURVEY

N/A
N/A
Protected

Academic year: 2021

Share "LOCAL ULTRALUMINOUS INFRARED GALAXIES IDENTIFIED IN THE AKARI ALL SKY SURVEY"

Copied!
5
0
0

로드 중.... (전체 텍스트 보기)

전체 글

(1)

2017. The Korean Astronomical Society. All rights reserved. c https://doi.org/10.5303/PKAS.2017.32.1.299

LOCAL ULTRALUMINOUS INFRARED GALAXIES IDENTIFIED IN THE AKARI ALL SKY SURVEY E. Kilerci Eser 1 , T. Goto 2 , and Y. Doi 3

1 Dark Cosmology Centre, Niels Bohr Institute, University of Copenhagen, Juliane Maries Vej 30, DK-2100 Copenhagen Ø, Denmark

2 National Tsing Hua University, No. 101, Section 2, Kuang-Fu Road, Hsinchu, Taiwan 30013

3 The University of Tokyo, Komaba 3-8-1, Meguro, Tokyo, 153-8902, Japan E-mail: [email protected]

(Received July 31, 2015; Revised October 20, 2016; Accepted October 20, 2016)

ABSTRACT

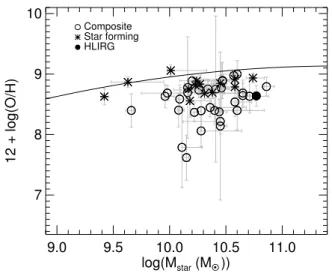
We crossmatch AKARI all-sky survey with the Sloan Digital Sky Survey Data Release 10 (SDSS DR10) and the Final Data Release of the Two-Degree Field Galaxy Redshift Survey (2dFGRS) and identify 118 Ultraluminous Infrared Galaxies (ULIRGs) and one Hyperluminous Infrared Galaxy (HLIRG). We find 40 new ULIRGs and one new HLIRG. ULIRGs in our sample are interacting galaxies or ongoing/post mergers. This is consistent with the fact that ULIRGs are major mergers of disk galaxies. We find that compared to local star forming SDSS galaxies of similar mass, local ULIRGs have lower oxygen abundances and this is consistent with the previous studies.

Key words: astronomy — astrophysics — journals: individual: PKAS

1. INTRODUCTION

Ultraluminous infrared galaxies (ULIRGs) and hyperlu- minous infrared galaxies (HLIRGs) are defined by their IR luminosities (see the reviews by Sanders & Mirabel, 1996; Lonsdale et al., 2006). ULIRGs have infrared lu- minosities in the 10 12 L ≤ L IR < 10 13 L range and HLIRGs have infrared luminosities 10 13 L ≤ L IR . The IR luminosity of these sources is produced by dust that absorbs and re-emits the radiation from star formation and active galactic nuclei (AGN). Local ULIRGs are mostly interacting galaxies and major mergers (Veilleux et al.,, 2002). ULIRGs are considered to be an impor- tant phase in the formation of quasars Sanders et al.

(1988); Veilleux et al., (2002). In this scenario, dur- ing the major merger the molecular gas clouds channel towards the nucleus and trigger nuclear starbursts and the accretion of the matter on to the central super mas- sive black hole (SMBH) starts the AGN activity. The merger evolves to a dust-enshrouded AGN phase, after the gas and dust are consumed the system becomes a bright QSO.

http://pkas.kas.org

ULIRGs are rare sources in the local (z <0.2) Uni- verse (e.g., Soifer et al., 1987). ULIRGs are more com- mon sources at high redshifts (z ≥ 2), (e.g., Chapman et al., 2005) and they represent the most rapidly star forming and highly obscured galaxies. High-z ULIRGs and local ULIRGs have different morphological proper- ties, high−z ULIRGs are also non-interacting galaxies (Kartaltepe et al., 2012). Observations show that the properties of ULIRGs change with redshift (e.g Farrah et al., 2008; Takagi et al., 2010; Rujopakarn et al., 2011).

Comparison of local and high-z ULIRGs is essential to obtain a complete picture of their evolution across cos- mic time. Local ULIRGs are key to study the origin of high IR luminosities and the role of the AGN activity and star formation in nearby mergers. Therefore, local ULIRGa are important.

In this work we identify ULIRGs and HLIRGs in the

AKARI all-sky survey (Murakami et al., 2007). We

cross-correlate AKARI all-sky survey with Two-Degree

Field Galaxy Redshift Survey (2dFGRS) (Colless et al.,

2001) and Sloan Digital Sky Survey (SDSS) DR 10 spec-

troscopic redshift catalogue (Ahn et al., 2014). We use

299

(2)

12.0 12.2 12.4 12.6 12.8 13.0 log(L IR /L O

)

0 20 40 60 80 100 120

Fraction (%)

LINER AGN Composite Star forming

Figure 1. Spectral class fraction versus IR luminosity bins for 89 ULIRGs.

the available optical images, spectra, provided by SDSS D10 catalogs and investigate the he morphologies, stel- lar mass and metallicities of the ULIRGs identified in the AKARI all-sky survey.

This paper is organized in the following structure. We introduce our sample in §2. We present our results in

§3. We give our conclusions in § 4. In this work, we use a cosmology with H 0 = 70 km s −1 Mpc −1 , Ω Λ = 0.7 and Ω m = 0.3.

2. SAMPLE

We cross-match the AKARI /IRC all-sky survey point source catalog version 1 1 and the AKARI /FIS all- sky survey bright source catalog version 1 2 (Yamamura et al., 2010). This gives us a single AKARI /FIS/IRC catalog of 24701 sources with both FIR and mid-IR fluxes.

We cross-correlate the AKARI /FIS/IRC catalog with SDSS DR 10 (Ahn et al., 2014) and spectroscopic red- shift catalog the Final Data Release of the 2dFGRS , the catalog of best spectroscopic observations 3 . We se- lect matching radii as 20 00 and allow each IR source to match only with one optical galaxy.

We perform a SED-fitting using the LePhare 4 (Photo- metric Analysis for Redshift Estimations) code (Arnouts et al., 1999; Ilbert et al., 2006) and estimate the total

1 http://www.ir.isas.jaxa.jp/AKARI/Observation/PSC/Public /RN/AKARI-IRC PSC V1 RN.pdf.

2 http://www.ir.isas.jaxa.jp/AKARI/Observation/PSC/Public /RN/AKARI-FIS BSC V1 RN.pdf.

3 http://www2.aao.gov.au/∼TDFgg/.

4 http://www.cfht.hawaii.edu/∼arnouts/lephare.html.

9.5 10.0 10.5 11.0 11.5 12.0 log(M star (M O

))

1 10 100 1000 10000

SFR(IR) (M

O •

year

-1

)

10 11 10 12 10 13

L

IR

/L

O •

z=0 MS z=1 MS z=2 MS z=2 MS- x4

z=2 MS- x10 LINER AGN Composite Star forming HLIRG Unclassified

Figure 2. SFR(IR) versus stellar mass for 75 ULIRGs and one HLIRG. The solid line is the z=0 ‘Main Sequence’ of Elbaz et al. (2007). The dotted line is the z=1 ‘Main Sequence’

of Elbaz et al. (2007). The dashed line is the z=2 ‘Main Sequence’ of (Daddi et al., 2007) and the top dashed lines are 4 and 10 times z=2 ‘Main Sequence’.

IR luminosity between 8µm − 1000µm, L 8−1000 . We use the AKARI fluxes with their associated uncertain- ties adopted from the AKARI catalogs. The FIR SED templates of Dale & Helou (2002) are used as the input library.

We select ULIRGs based on the estimated L 8−1000

luminosity. After checking the optical and IR galaxy match by visual inspection our sample contains 118 ULIRGs and one HLIRG. 40 ULIRGs and one HLIRG are new identifications. We list the properties of the new ULIRGs identified in this work in Table 1. This table contains the AKARI name (column 1), redshift (column 2), total IR luminosity, L IR , (column 2).

3. RESULTS

3.1. Redshift Distribution

The redshift distribution of our sample covers 0.050 <

z < 0.487. The median redshift of our sample is ¯ z = 0.181. 104 ULIRGs are in the 0.050 < z ≤ 0.270 range and 14 ULIRGs are in the 0.270 < z < 0.487 range.

3.2. The Visual Morphologies

We examine SDSS images to investigate the morpho-

logical properties of our sample and classify only the

galaxies for which SDSS images are available. We use

the interaction classification scheme that is described by

Veilleux et al., (2002). For the known ULIRGs, we adopt

the interaction classifications from Veilleux et al., (2002)

(3)

Table 1

New ULIRGs Identified in the AKARI All-Sky Survey AKARI-FIS-V1 Name z log(L IR /L ) J2216028+005813 0.210 12.83 +0.15 −0.14 J0859229+473612 0.180 12.20 +0.01 −0.09 J1443444+184950 0.177 12.21 +0.01 −0.31 J0857505+512037 0.366 12.89 +0.07 −0.02 J1106104+023458 0.283 12.23 +0.06 −0.06 J1157412+321316 0.160 12.14 +0.01 −0.12 J1149200-030357 0.162 12.02 +0.02 −0.04 J0126038+022456 0.242 12.22 +0.04 −0.06 J1556089+254358 0.154 12.03 +0.01 −0.26 J0140364+260016 0.321 12.77 +0.06 −0.02 J1257392+080935 0.272 12.24 +0.04 −0.02 J0800007+152319 0.274 12.14 +0.00 −0.00 J0800279+074858 0.173 12.12 +0.00 −0.09 J0834438+334427 0.166 12.13 +0.03 −0.20 J0823089+184234 0.425 12.57 +0.43 −0.03 J1202527+195458 0.132 12.05 +0.04 −0.02 J0912533+192701 0.233 12.11 +0.09 −0.04 J0941010+143622 0.384 12.75 +0.01 −0.05 J1016332+041418 0.266 12.39 +0.03 −0.05 J1401186-021131 0.172 12.07 +0.01 −0.08 J1258241+224113 0.208 12.07 +0.05 −0.04 J1036317+022147 0.050 12.06 +0.03 −0.04 J1050567+185316 0.219 12.60 +0.03 −0.06 J1111177+192259 0.225 12.60 +0.03 −0.06 J1219585+051745 0.487 12.87 +0.02 −0.04 J1414276+605726 0.151 12.11 +0.00 −0.12 J0936293+203638 0.175 12.01 +0.04 −0.02 J1533582+113413 0.337 12.32 +0.08 −0.08 J1348483+181401 0.179 12.19 +0.03 −0.03 J1125319+290316 0.138 12.27 +0.01 −0.05 J1603043+094717 0.152 12.02 +0.03 −0.03 J1639245+303719 0.224 12.11 +0.01 −0.05 J1050288+002806 0.216 12.38 +0.13 −0.08 J0928103+232521 0.197 12.07 +0.08 −0.04 J2344170+053520 0.267 12.56 +0.01 −0.19 J2353152-313234 0.185 12.04 +0.00 −0.12 J1222488-040307 0.181 12.19 +0.02 −0.04 J1419037-034657 0.152 12.09 +0.01 −0.08 J1048019-013017 0.167 12.09 +0.07 −0.07 J1338353-041131 0.175 12.14 +0.12 −0.22

and Hwang et al. (2007). In order to avoid uncertain- ties in interaction classifications due to the distances, we only consider the sources within z = 0.27. We find the faction of binary systems showing strong interaction fea- tures as 43%. The fraction of late/post mergers is 52%.

This is consistent with the general picture that ULIRGs are interacting galaxies.

3.3. Spectral Classification

To identify the spectral classes of the ULIRGs in our sample we adopt the spectral classification given by Thomas et al. (2013). SDSS spectra are available only for 89 sources. Our sample consists of 19% purely star forming galaxies, 44% composite galaxies, 11% LINERs and 26% AGN.

The fraction of ULIRGs in different spectral classes as a function of IR luminosity is shown in Figure 1. We find that the fraction of AGNs grows with increasing L IR . This trend agrees with the results of previous studies showed a correlation between the AGN fraction and IR luminosity (Veilleux et al., 1995; Kim et al., 1998; Goto, 2005).

3.4. Position of ULIRGs in Star Formation Rate − Stellar Mass Diagram

We adopt the stellar masses (M star ) of the ULIRGs in our sample from ‘stellarMassPortStarforming’ 5 catalog.

We compute star formation rate (SFR) based on Eq.

(4) given by Kennicutt (1998). We show SFR versus M star for 75 ULIRGs and one HLIRG in Figure 2. The solid line is the ‘main sequence’ of normal star-forming galaxies (SFGs) at z ∼0 (Elbaz et al., 2007). The dot- ted line is the z ∼ 1 ‘main sequence’ (Elbaz et al., 2007) and the dashed line is the z ∼ 2 (Daddi et al., 2007)

‘main sequence’. The top dashed lines show 4 and 10 times above the z ∼2 ‘main sequence’ relationship. Lo- cal ULIRGs exhibit higher SFRs compared to normal SFGs with the same masses. Compared to the z ∼ 0, z ∼ 1 and z ∼ 2 ‘main sequence’, on average ULIRGs exhibit 92, 17 and 5 times higher SFRs, respectively.

ULIRGs mostly distributed around the dashed line rep- resenting 4 times above the z ∼ 2 MS.

It has been already known that local ULIRGs are out- liers compared to the local ‘main sequence’ (Elbaz et al., 2007). This is expected because, ULIRGs are defined to have SFRs in the range of 172 ≤SFR(IR)≤ 1721. There- fore, their position in the SFR axis is a selection effect.

3.5. Position of ULIRGs in Stellar Mass − Gas Metallicity Diagram

We adopt the relevant emission-line fluxes from Thomas et al. (2013) in order to measure the gas metallicity.

We compute oxygen abundances, (O/H), by following Eq. (1) of Tremonti et al. (2004). In Figure 3 we show the M star − Z distribution of our sample. We have 48 ULIRGs and one HLIRG for which emission-line fluxes

5 http://www.sdss3.org/dr10/spectro/galaxy portsmouth.php.

(4)

9.0 9.5 10.0 10.5 11.0 log(M star (M O

))

7 8 9 10

12 + log(O/H)

Composite Star forming HLIRG

Figure 3. Oxygen abundances versus stellar mass of our sam- ple. The solid is the the mass−metallicity relation of the local SDSS galaxies given by Tremonti et al. (2004).

given by Thomas et al. (2013). The solid line is the M star − Z relationship, Eq. (3) given by Tremonti et al.

(2004). Compared to the normal star forming SDSS galaxies with similar masses, local ULIRGs have lower (0.20 dex) oxygen abundances. The lower oxygen abun- dances of our sample is consistent with the results of Rupke et al. (2008).

4. CONCLUSIONS

We cross-match AKARI catalogs with SDSS DR 10 and 2dFGRS and identify ULIRGs in the AKARI all-sky survey. We investigate morphologies, stellar masses, SFRs, gas metallicities of local ULIRGs. We exam- ine the positions of ULIRGs in the SFR − M star and M star − Z diagrams. Our main conclusions are:

• Based on the spectroscopic redshifts from SDSS DR10 and 2dFGRS we identify 118 ULIRGs and one HLIRG in the AKARI all-sky survey. Among those 40 ULIRGs and one HLIRG are newly iden- tified.

• We investigated interaction classes of 100 ULIRGs and find that 43% are two galaxy systems with strong tidal tails, bridges and 52% are ongoing/post mergers. This supports the known picture of ULIRGs as mergers.

• We confirm the known trend of increasing AGN fac- tion with higher IR luminosity.

• Local ULIRGs have higher SFRs compared to ‘main sequence’ galaxies with similar mass at z ∼0, z ∼1 and z ∼2.

• Local ULIRGs have lower oxygen abundances com- pared to SDSS galaxies with similar masses.

REFERENCES

Ahn, C. P., et al., 2014, The Tenth Data Release of the Sloan Digital Sky Survey: First Spectroscopic Data from the SDSS-III Apache Point Observatory Galactic Evolution Experiment, ApJS, 211, 17

Arnouts, S., Cristiani, S., Moscardini, L., Matarrese, S.,Lucchin, F., Fontana, A., & Giallongo, E., 1999, Mea- suring and modelling the redshift evolution of clustering:

the Hubble Deep Field North, MNRAS, 310, 540 Chapman, S. C., Blain, A. W., Smail, I., & Ivison, R. J.,

2005, A Redshift Survey of the Submillimeter Galaxy Pop- ulation, ApJ, 622, 772

Colless, M., et al., 2001, The 2dF Galaxy Redshift Survey:

spectra and redshifts, MNRAS, 328, 1039

Daddi, E., et al., 2007, Multiwavelength Study of Massive Galaxies at z˜2. I. Star Formation and Galaxy Growth, ApJ, 670, 156

Dale, D. A. & Helou, G., 2002, The Infrared Spectral En- ergy Distribution of Normal Star-forming Galaxies: Cal- ibration at Far-Infrared and Submillimeter Wavelengths, ApJ, 576, 159

Elbaz, D., et al., 2007, The reversal of the star formation- density relation in the distant universe, A&A, 468, 33 Farrah, D., et al., 2008, The Nature of Star Formation in

Distant Ultraluminous Infrared Galaxies Selected in a Re- markably Narrow Redshift Range, ApJ, 677, 957

Goto, T., 2005, Optical properties of 4248 IRAS galaxies, MNRAS, 360, 322

Hwang, H. S., Serjeant, S., Lee, M. G., Lee, K. H., &

White, G. J., 2007, The ultraluminous and hyperlumi- nous infrared galaxies in the Sloan Digital Sky Survey, 2dF Galaxy Redshift Survey and 6dF Galaxy Survey, MNRAS, 375, 115

Ilbert, O., et al., 2006, Accurate photometric redshifts for the CFHT legacy survey calibrated using the VIMOS VLT deep survey, A&A, 457, 841

Kartaltepe, J. S., et al., 2012, GOODS-Herschel and CANDELS: The Morphologies of Ultraluminous Infrared Galaxies at z ˜ 2, ApJ, 757, 23

Kennicutt, Jr., R. C., 1998, Star Formation in Galaxies Along the Hubble Sequence, ARA&A, 36, 189

Kim, D.-C., Veilleux, S., & Sanders, D. B., 1998, The IRAS 1 Jy Sample of Ultraluminous Infrared Galaxies. II. Optical Spectroscopy, ApJ, 508, 627

Lonsdale, C. J., Farrah, D., & Smith, H. E., 2006, Ultralu- minous Infrared Galaxies, in Astrophysics Update 2, ed.

J. W. Mason (Heidelberg: Springer), 285

(5)

Murakami, H., et al., 2007, The Infrared Astronomical Mis- sion AKARI, PASJ, 59, 369

Rujopakarn, W., Rieke, G. H., Eisenstein, D. J., & Juneau, S., 2011, Morphology and Size Differences Between Local and High-redshift Luminous Infrared Galaxies, ApJ, 726, 93

Rupke, D. S. N., Veilleux, S., & Baker, A. J., 2008, The Oxy- gen Abundances of Luminous and Ultraluminous Infrared Galaxies, ApJ, 674, 172

Sanders, D. B., & Mirabel, I. F., 1996, Luminous Infrared Galaxies, ARA&A, 34, 749

Sanders, D. B., Soifer, B. T., Elias, J. H., Neugebauer, G.,

& Matthews, K., 1988, Warm ultraluminous galaxies in the IRAS survey - The transition from galaxy to quasar?, ApJ, 328, L35

Soifer, B. T., et al., 1987, The IRAS bright galaxy sample.

II - The sample and luminosity function, ApJ, 320, 238 Takagi, T., et al., 2010, Polycyclic aromatic hydrocarbon

(PAH) luminous galaxies at z ˜ 1, A&A, 514, A5 Thomas, D., et al., 2013, Stellar velocity dispersions and

emission line properties of SDSS-III/BOSS galaxies, MN- RAS, 431, 1383

Tremonti, C. A., et al., 2004, The Origin of the Mass- Metallicity Relation: Insights from 53,000 Star-forming Galaxies in the Sloan Digital Sky Survey, ApJ, 613, 898 Veilleux, S., Kim, D.-C. & Sanders, D. B., 2002, Optical

and Near-Infrared Imaging of the IRAS 1 Jy Sample of Ultraluminous Infrared Galaxies. II. The Analysis, ApJS, 143, 315

Veilleux, S., Kim, D. -C., Sanders, D. B., Mazzarella, J. M.,

& Soifer, B. T., 1995, Optical Spectroscopy of Luminous Infrared Galaxies. II. Analysis of the Nuclear and Long- Slit Data, ApJS, 98, 171

Yamamura, I., et al., 2010, VizieR Online Data Cata-

log: AKARI/FIS All-Sky Survey Point Source Catalogues

(ISAS/JAXA, 2010), yCat, 2298, 0

수치

Figure 1. Spectral class fraction versus IR luminosity bins for 89 ULIRGs.
Figure 3. Oxygen abundances versus stellar mass of our sam- sam-ple. The solid is the the mass−metallicity relation of the local SDSS galaxies given by Tremonti et al

참조

관련 문서

THE AKARI FIR BRIGHT SOURCE CATALOGUE One of the key objectives of the AKARI mission is to carry out an all-sky survey in the mid- and far-infrared wavelengths and to

We demonstrate the luminosity dependence of the covering factor (CF) of active galactic nuclei (AGNs), based on AKARI mid-infrared all-sky survey catalog.. Combining the

The stellar mass-to-light ratio distribution of elliptical galaxies in the Main Galaxy sample and the Luminous Red Galaxy sample

We use multi-wavelength data such as the Sloan Digital Sky Survey (SDSS), Canada-France-Hawaii Telescope Legacy Survey (CFHTLS)-Wide, United Kingdom In- frared

The AKARI FIS survey data will be very useful for studying SNRs interacting with molecular gas, providing information about both the gas and dust components associated with

We combine data from two all-sky surveys, the Swift/Burst Alert Telescope 22 Month Source Catalog and the AKARI Point Source Catalogue, in order to study the connection between

Using AKARI near-IR spectroscopy with a 1 arcmin aperture, we can estimate the luminosity of a PAH feature at 3.3 µm, and compare it with the total IR luminosity.. In addi-

The public WISE survey should provide a valuable reference for comparison with the AKARI all-sky sur- vey products, while the availability of AKARI data at both longer