ISSN 1225-1534 (Print) http://dx.doi.org/10.5303/PKAS.2012.27.4.285 Publications of the Korean Astronomical Society
27: 285 ∼ 286, 2012 September
° 2012. The Korean Astronomical Society. All Rights Reserved. c
INFRARED AND HARD X-RAY DIAGNOSTICS OF AGN IDENTIFICATION FROM THE AKARI AND SWIFT/BAT ALL-SKY SURVEYS
K. Matsuta
1,2, P. Gandhi
2, T. Dotani
2,1, T. Nakagawa
2, N. Isobe
2, Y. Ueda
3, K. Ichikawa
3, Y. Terashima
4, S. Oyabu
5, I. Yamamura
2,1, and L. Stawarz
2,61
Department of Space and Astronautical Science, The Graduate University for Advanced Studies, 3-1-1 Yoshinodai, Chuo-ku, Sagamihara, Kanagawa 252-5210, Japan
2
Institute of Space and Astronautical Science, Japan Aerospace Exploration Agency, 3-1-1 Yoshinodai, Chuo-ku, Sagamihara, Kanagawa 252-5210, Japan
3
Department of Astronomy, Kyoto University, Kitashirakawa-Oiwake-cho, Sakyo-ku, Kyoto 606-8502, Japan
4
Department of Physics, Ehime University, 2-5 Bunkyo-cho, Matsuyama, Ehime 790-8577, Japan
5
Graduate School of Science, Nagoya University, Furo-cho, Chikusa-ku, Nagoya, Aichi 464-8601, Japan
6
Astronomical Observatory, Jagiellonian University, ul. Orla 171, Krak´ow 30-244, Poland E-mail: [email protected]
(Received July 01, 2012; Accepted August 10, 2012)
ABSTRACT
We combine data from two all-sky surveys, the Swift/Burst Alert Telescope 22 Month Source Catalog and the AKARI Point Source Catalogue, in order to study the connection between the hard X-ray (> 10 keV) and infrared (IR) properties of local active galactic nuclei (AGN). We find two photometric diagnostics are useful for source classification: one is the X-ray luminosity vs.
IR color diagram, in which type 1 radio-loud AGN are well isolated from other AGN. The second one uses the X-ray vs. IR color-color diagram as a redshift-independent indicator for identifying Compton-thick (CT) AGN. Importantly, CT AGN and starburst galaxies in composite systems can also be separated in this plane based upon their hard X-ray fluxes and dust temperatures.
This diagram may be useful as a new indicator to classify objects in new surveys such as with WISE and NuSTAR.
Key words: galaxies: active; infrared: galaxies; X-ray: galaxies
1. INTRODUCTION
In this paper, we explore the X-ray vs. infrared (IR) correlation using unbiased samples, and then de- fine new and simple photometric diagnostics for active galactic nuclei (AGN) classification. We use two all-sky survey catalogs: one is the Swift/Burst Alert Telescope (BAT) 22 Month Source Catalog (Tueller et al., 2010) as the base AGN selection catalog covering the hard X-ray (> 10 keV) band, which reflects the intrinsic lu- minosity of a source and provides samples unbiased by obscuration. The second is the AKARI Point Source Catalogue (AKARI/PSC; Ishihara et al., 2010; Yama- mura et al., 2010) over a range of wavelengths from 9
to 160 µm.
The completeness of the base samples allows us to examine and design various color plots, which can be useful for source classification in blind surveys and par- ticularly powerful if they are redshift independent. We propose one color–color diagnostic providing the capa- bility of distinguishing starbursts from Compton-thick (CT) AGN. This has been an important problem for many years because star formation and obscured accre- tion activity often occur together in composite systems (cf. ‘starburst-AGN connection’). These two phenom- ena are difficult to distinguish with soft X-ray and IR observations. But the hard X-ray selection adopted
http://pkas.kas.org 285
286 MATSUTA ET AL.
here enables this. Details of our study are presented in Matsuta et al. (2012), building upon the study of Gandhi et al. (2009).
2. RESULTS AND DISCUSSION
We find a good correlation between the observed mid- IR and hard X-ray luminosities over four orders of magnitude. Under the AGN orientation-based unifica- tion scheme, this result may support the clumpy torus model, although the broad-band correlation alone can- not prove the underlying emission mechanism for the two bands. We also find that the radio-loud (RL) AGN follow a similar correlation, suggesting that their dom- inant hard X-ray and IR emission processes are sim- ilar to those of radio-quiet (RQ) AGN. Blazars show a linear correlation of slope 1 between the two bands, which is due to the fact that the synchrotron and in- verse Compton powers match each other well along the blazar sequence. We evaluate quantitative correlation statistics and show that the correlation is not a redshift artifact for either RQ or RL AGN. Most CT AGN show a large deficit in their observed X-ray powers compared to unobscured AGN. This is expected because their ob- served fluxes are diminished by high gas column densi- ties, even in the hard X-ray band.
We study hard X-ray and IR photometric diagnos- tics for source classification. We can isolate type 1 RL AGN and blazars by using the X-ray luminosity vs. IR color diagram such as log L
Xvs. log λL
9µm/λL
90µm. Type 2 AGN show a smaller color ratio than type 1 AGN. The trend probably arises because type 2 AGN have on average lower intrinsic accretion (X-ray) lumi- nosities as compared to type 1 (Winter et al., 2009), as well as a relatively stronger 90 µm contribution from dust in the host galaxy (Malkan et al., 1998).
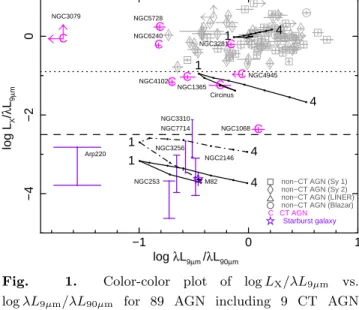
We also find that the color–color plot of log L
X/λL
9µmvs. log λL
9µm/λL
90µmcan distinguish starburst galaxies and composite CT AGN from non- CT AGN. In Fig 1, CT AGN are successfully isolated by the approximate boundary of log L
X/λL
9µm< −0.9 with very high (100%) reliability, but with a complete- ness of 56%. Starburst galaxies are isolated in a region with approximate boundary of log L
X/λL
9µm< −2.5 and log λL
9µm/λL
90µm< −0.4 and very high (100%) reliability. These simple photometric diagnostics can be useful tools for new and upcoming surveys.
We acknowledge the AKARI/PSC and the Swift/BAT 22 month Source Catalog teams, and
−1 0 1
−4−20
log LX/λL9µm
log λL9µm /λL90µm
C CT AGN Starburst galaxy non−CT AGN (Sy 1) non−CT AGN (Sy 2) non−CT AGN (LINER) NGC1365
NGC1068 Circinus
NGC4102 NGC4945
NGC5728 NGC6240
M82 NGC253
Arp220
NGC2146 NGC3256
NGC3310 NGC7714
non−CT AGN (Blazar) NGC3281
NGC3079
C
C C C C
C
C
C 1C 4
1
4
1 1
4 4
Fig. 1. Color-color plot of log L
X/λL
9µmvs.
log λL
9µm/λL
90µmfor 89 AGN including 9 CT AGN and 7 starburst galaxies detected by AKARI. The dotted line at log L
X/λL
9µm∼ −0.9 denotes an approximate boundary between non-CT and CT AGN. The dashed line at log L
X/λL
9µm∼ −2.5 shows the boundary below which only starburst galaxies are present. The solid and dot-dashed lines show how the sources move on the plot when the redshift is changed from 0.0 to 4.0. The lines are calculated for three source classes: a non-CT AGN located at (0, 0), Circinus galaxy as a CT AGN, and M82 as a starburst galaxy.
thank the referee.
REFERENCES
Gandhi, P., et al., 2009, Resolving the Mid-Infrared Cores of Local Seyferts, A&A, 502, 457
Ishihara, D., et al., 2010, The AKARI/IRC Mid- Infrared All-Sky Survey, A&A, 514, A1
Malkan, M. A., Gorjian, V., & Tam, R., 1998, A Hub- ble Space Telescope Imaging Survey of Nearby Active Galactic Nuclei, ApJS, 117, 25
Matsuta, K., et al., 2012, Infrared and Hard X- ray Diagnostics of AGN Identification from the Swift/BAT and AKARI All-Sky Surveys, ApJ, 753, 104
Tueller, J., et al., 2010, The 22 Month Swift-BAT All- Sky Hard X-ray Survey, ApJS, 186, 378
Winter, L. M., Mushotzky, R. F., Reynolds, C. S.,
& Tueller, J., 2009, X-Ray Spectral Properties of the BAT AGN Sample, ApJ, 690, 1322
Yamamura, I., et al., 2010, AKARI/FIS All-Sky Sur- vey Bright Source Catalogue
11http://www.ir.isas.jaxa.jp/AKARI/Observation/PSC/Public/.