ISSN 1225-1534 (Print) http://dx.doi.org/10.5303/PKAS.2012.27.4.291 Publications of the Korean Astronomical Society
27: 291 ∼ 292, 2012 September
° 2012. The Korean Astronomical Society. All Rights Reserved.c
SED DECOMPOSITION OF INFRARED-LUMINOUS GALAXIES
Jong Chul Lee1,2
1Department of Physics and Astronomy, Seoul National University, Seoul 151-747, Korea
2Korea Astronomy and Space Science Institute, Daejeon 305-348, Korea (Received July 02, 2012; Accepted August 17, 2012)
ABSTRACT
We select infrared-luminous galaxies by cross-matching the SDSS spectroscopic sample of galax- ies with the WISE all-sky survey catalog. Based on photometric data points covering from SDSS u-band to WISE 22 µm, their spectral energy distributions (SEDs) are separated into AGN, ellip- tical, spiral, and irregular galaxy components. The derived luminosities of spiral galaxy and AGN are well correlated with Hα and [OIII] line luminosities, respectively. Most galaxies are dominated by young stellar populations even for optical AGNs, but at least 10% of optical non-AGNs appear to harbor buried AGNs. The AGN contribution increases dramatically with the total luminosity.
These results show that the SED decomposition is successful and is useful to understand the true nature of dusty galaxies.
Key words: galaxies: active; galaxies: starburst; infrared: galaxies
1. INTRODUCTION
In the early Universe, galaxies grow via gas-rich major mergers triggering starburst and nuclear ac- tivity. Ultraluminous infrared galaxies (ULIRGs;
LIR (8−1000 µm)≥ 1012L¯) are suspected to be at such a stage in the sense that a significant fraction of ul- traviolet light associated with the activity is converted to infrared light by thermal processes of dust grains.
In order to investigate the primary energy source (i.e., star formation, SF, vs. active galactic nucleus, AGN) in dusty galaxies, various diagnostic diagrams have been used (e.g., Veilleux et al., 2009; Lee et al., 2011). It is now possible to quantify the relative contribution of SF and AGN based on spectral energy distribution (SED) decomposition (e.g., Mullaney et al., 2011; Donoso et al., 2012). In this work, we construct a large sample of infrared-luminous galaxies using SDSS data and re- cently released WISE (Wide-field Infrared Survey Ex- plorer) all-sky survey data. After separating their SEDs into young and old stellar populations plus AGN, we provide information on the typical contributions of each component.
2. DATA AND ANALYSIS
Our sample was based on the SDSS DR7 galaxies whose optical spectra are available. Their infrared counter- parts were found in the WISE source catalog within 3 arcsec. We selected galaxies which are detected in the SDSS ugriz-bands and WISE 3.4, 4.6, 12, 24 µm above 5σ levels. Among them, we focused on galaxies with a narrow range of redshift (0.04 < z < 0.2) to reduce the aperture-related effects and with signal-to- noise ratio > 5 of emission line fluxes Hβ, [OIII]λ5007, Hα, and [NII]λ6584 for reliable spectral classification in the BPT diagram (Baldwin, Phillips, & Terlevich, 1981). The resultant sample contains 59,046 infrared- luminous galaxies.
In order to analyze their SEDs we used the four em- pirical SED templates spanning the wavelength range from 0.03 to 30 µm and the fitting code of Assef et al.
(2010): Lbol (0.03−30 µm) = LAGN+ LE+ LSbc+ LIm. Each template represents AGN (non-stellar contribu- tion), elliptical (old stellar population), spiral (continu- ously star-forming), and irregular (starbursting) galax- ies. The fitting code was applied to the 9 photomet- ric data points by allowing variation of dust-extinction.
http://pkas.kas.org 291
292 LEE
0.1 1.0 10.0
λobs (µm) 0.001
0.010 0.100 1.000 10.000
Fν (mJy)
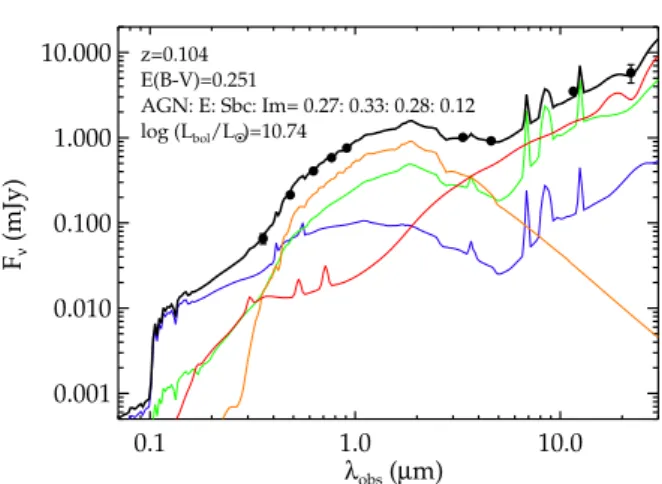
z=0.104 E(B-V)=0.251
AGN: E: Sbc: Im= 0.27: 0.33: 0.28: 0.12 log (Lbol/LO •)=10.74
Fig. 1. An example of the SED fits. The labels indicate the contributions (to the bolometric luminosity) of the templates, which are shown in red (AGN), orange (E), green (Sbc), and blue (Im) lines. The black line and circles (with error bars) represent the total SED and observed photometric data points.
Figure 1 shows an example of the SED fits. Based on Monte-Carlo simulations with photometric errors we estimate that the uncertainty associated with the con- tribution of each component to Lbol is typically ∼2%, while the contribution uncertainties to L12 and L22
(monochromatic luminosities, νLν, at rest-frame wave- length 12 and 22 µm) are ∼6%.
3. RESULTS
We found that Hα and [OIII] luminosities, after aper- ture and extinction corrections, are best correlated with the derived luminosities of Sbc and AGN components, respectively (Spearman rank correlation coefficient = 0.83 and 0.63). By considering that Hα and [OIII] emis- sion lines are known to trace star formation and nuclear activity, the finding implies that the SED decomposi- tion is successful. This is also supported by the fact that the mean AGN contribution is higher in optically more AGN-like galaxies (3.0% for star-forming; 6.0%
for composite; 15.9% for AGN). Interestingly 15.8%
of star-forming galaxies show non-negligible (> 5%) AGN contributions, which could be regarded as opti- cally buried AGNs.
The mean contributions of each component to Lbol
(L22) in bins of optical spectral type and Lbol (L22) are listed in Table 1. Although most of the infrared- luminous galaxies are dominated by young stellar com-
Table 1.
Mean Contributions of Each Component to Lbol (L22) in Bins of Optical Spectral Type and Lbol(L22)
Lbol Star-forming Composite AGN
10.0–10.3 02.1 18.0 34.0 45.9 04.2 38.3 38.6 18.8 07.5 45.7 29.1 17.7 10.3–10.6 02.0 17.8 37.7 42.5 03.7 35.7 38.0 22.6 09.7 44.4 26.2 19.8 10.6–10.9 02.7 15.7 43.1 38.5 04.4 34.0 37.1 24.6 10.6 43.7 24.1 22.6 10.9–11.2 04.5 12.1 50.3 33.1 06.7 28.8 39.5 24.9 14.1 39.7 23.5 22.6 11.2–11.5 11.6 08.5 52.9 27.0 16.9 20.1 41.1 22.0 31.5 32.1 18.9 17.5
L22 Star-forming Composite AGN
09.0–09.4 02.4 00.2 53.4 44.1 05.8 00.6 52.9 40.7 10.1 00.9 37.1 51.8 09.4–09.8 02.9 00.1 67.0 30.0 07.1 00.3 66.0 26.5 20.1 00.5 50.0 29.5 09.8–10.2 05.4 00.1 73.4 21.1 09.8 00.2 72.8 17.3 28.9 00.3 53.2 17.6 10.2–10.6 13.5 00.0 71.0 15.5 15.8 00.1 72.7 11.4 39.1 00.2 49.4 11.3 10.6–11.0 45.8 00.0 43.9 10.3 38.1 00.0 55.4 06.5 65.3 00.1 28.8 05.8
The values represent the mean contributions (%) of AGN, elliptical, spiral, and irregular galaxy components in each bin.
ponents even for optical AGNs, the mean AGN contri- bution increases dramatically with the luminosity, so that AGNs become a significant power source in the most luminous ones, corresponding to ULIRGs. We note that the trends in L12 are similar to those in L22
but the old stellar population contribution is up to a few percent.
REFERENCES
Assef, R. J., et al., 2010, Low-Resolution Spectral Templates for Active Galactic Nuclei and Galax- ies from 0.03 to 30 µm, ApJ, 713, 970
Baldwin, J. A., Phillips, M. M., & Terlevich, R., 1981, Classification Parameters for the Emission-line Spectra of Extragalactic Objects, PASP, 93, 5 Donoso, E., et al., 2012, Origin of 12 µm Emission
across Galaxy Populations from WISE and SDSS surveys, ApJ, 748, 80
Lee, J. C., Hwang, H. S., Lee, M. G., Kim, M., &
Kim, S. C., 2011, Optical Spectral Classifica- tion of Southern Ultraluminous Infrared Galax- ies, MNRAS, 414, 702
Mullaney, J. R., Alexander, D. M., Goulding, A. D., &
Hickox, R. C., 2011, Defining the Intrinsic AGN Infrared Spectral Energy Distribution and Mea- suring Its Contribution to the Infrared Output of Composite Galaxies, MNRAS, 414, 1082
Veilleux, S., et al., 2009, SPITZER Quasar and ULIRG Evolution Study (QUEST). IV. Compar- ison of 1 Jy Ultraluminous Infrared Galaxies with Palomar-Green Quasars, ApJS, 182, 628