Journal of Internet Computing and Services(JICS) 2017. Dec.: 18(6): 65-73 65
An Enhanced Transmission Mechanism for Supporting Quality of Service in Wireless
Multimedia Sensor Networks
DongOk Cho1 JinGwang Koh1 SungKeun Lee2*
ABSTRACT
Congestion occurring at wireless sensor networks(WSNs) causes packet delay and packet drop, which directly affects overall QoS(Quality of Service) parameters of network. Network congestion is critical when important data is to be transmitted through network.
Thus, it is significantly important to effectively control the congestion. In this paper, new mechanism to guarantee reliable transmission for the important data is proposed by considering the importance of packet, configuring packet priority and utilizing the settings in routing process. Using this mechanism, network condition can be maintained without congestion in a way of making packet routed through various routes. Additionally, congestion control using packet service time, packet inter-arrival time and buffer utilization enables to reduce packet delay and prevent packet drop. Performance for the proposed mechanism was evaluated by simulation. The simulation results indicate that the proposed mechanism results to reduction of packet delay and produces positive influence in terms of packet loss rate and network lifetime. It implies that the proposed mechanism contributes to maintaining the network condition to be efficient.
☞ keyword : Wireless Multimedia Sensor Networks; Packet priority based routing mechanism; Quality of Service; Packet transmission delay; Packet Inter-arrival Time
1. Introduction
In wireless sensor network (WSN), multiple sensor nodes participate in collecting and transmitting data. In case that specific event occurs, the amount of data incoming to the network drastically increases. Consequently, congestion might happen in the network. The congestion makes packet delay increased and even causes packet drop. Thus, if the data is a part of important information, the data is required to be distinguished from the other general data and it is necessary to control congestion in the network. A wireless sensor network(WSN) consists of one or more sink nodes and multiple sensor nodes. The sensor nodes are placed across a wide area as it performs such tasks as detection of surrounding environment, collection and processing of data and wireless
1Department of Computer Engineering, Sunchon National University, Korea
2Department of Multimedia Engineering, Sunchon National University, Korea
* Corresponding author ([email protected])
[Received 17 July 2017, Reviewed 18 July 2017(R2 11 October 2017), Accepted 1 November 2017]
communication etc. A WSN is capable of connecting the detected environment data with applications by integrating a variety of sensor devices in wired and/or wireless network infrastructure which are being widely deployed[1]. Basically, a multimedia sensor node is a combined form of traditional sensor node and sensor module which has capability of collecting multimedia data additionally. Since the multimedia sensor module tends to generate and transmit large amount of data by its nature, an excessive network overload could occur if the data are transmitted through the traditional network based on Zigbee which has a narrow communication bandwidth. It implies that data packet loss can happen, which will be critical. Therefore, the routing schemes proposed for the traditional sensor network are not suitable for the wireless multimedia sensor network (WMSN) [1].
With focus on this cause, in this study, a packet degree-based control mechanism is proposed to guarantee reliable data transmission with minimizing unnecessary retransmission in a wireless network environment. In this proposed mechanism, the priority of packet is configured by setting a service quality pattern and a service quality level depending on a traffic pattern of packets sent by the source ISSN 2287-1136 (Online)
http://www.jksii.or.kr
node and the contents of data prior to transmission of data packets. This part is based on the packet marking algorithm.
The service quality pattern is comprised of four factors: energy efficiency, delay sensitivity, reliability and transmission rate.
The service quality level to support this is divided into two levels: green and red [2].The rest of the paper is organized as follows. Chapter 2 explains the priority based control scheme and chapter 3 packet priority-based rankingand explain the congestion control mechanism chapter 4 analyzes the performanceand finally chapter 5 concludes this study.
2. Packet Priority based Routing Mechanism
In this study, the packet priority is used for adjusting a condition of transmission delay. It can be defined differently depending on the quality of service(QoS) of application. The priority of packet is configured by setting a service quality pattern and a service quality level in accordance with a traffic pattern of packets sent by the source node and the contents of data prior to transmission of data packets. This part is implemented based on the packet marking algorithm [3]. In this study, a packet degree based control mechanism is proposed to adjust a condition of transmission delay in WMSNs with various traffic models.
2.1 Traffic Type
In WMSNs environment, there are four different types of traffic [4] as follows.
∙Periodic Monitoring Traffic
∙Event Driven Traffic
∙Multimedia Traffic
∙Query-Based Traffic
Periodic monitoring traffic is a traffic which occurs by monitoring the surrounding environment periodically and sending the information such as temperature and humidity destined to a sink node [5].
Event driven traffic is characterized by a prompt transmission requirement because this type of traffic requires
sending data to a sink node in an occurrence of urgent situation such as fire breakout or intrusion within a sensor node covering range.
Multimedia traffic is comprised of data which are to be transmitted continuously, for example, video stream sent by CCTV or audio stream obtained by sound capture device. This type of traffic requires high service quality for key frames data, whereas it requires relatively low level of service quality for the other supplementary frames. Query-based traffic is comprised of data which are responded by the corresponding sensor node for the query issued by a sink node. In this type of traffic, service quality of the response data is designated by the sink node [2].
2.2 Traffic Classification
The priority of packet is set depending on the traffic pattern and the contents of data within node. This part is based on the packet marking algorithm [3]. The service quality pattern consists of four factors: energy efficiency, delay sensitivity, reliability and transmission rate. The service quality level to support this is divided into three distinctive levels: green, yellow and red [2].
Since the green packet is high priority packet, it should be transmitted via the route having the shortest distance with focus on link quality. Red packet is the lowest priority packet so its route should be determined so as to minimize energy consumption with consideration of the residual
(Figure 1) Priority Marking of a Source Node
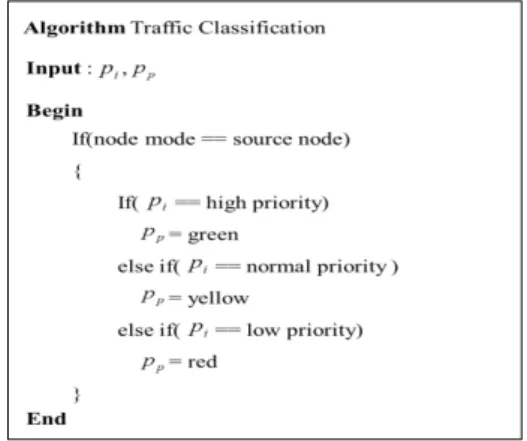
2.3 Proposal of Packet Degree based Traffic Classification Algorithm
Figure 2 presents a traffic classification algorithm. The symbol denotes the generated packets, while is a variable indicating the priority of the packet. If the type of the node is a source node, it will be marked as green, yellow or red in accordance with the degree of priority of the generated packet. Data packets belonging to event-driven traffic and multimedia traffic might have high priority, while data packets belonging to query-based traffic might have medium or low priority because response data quality is set by a sink node.
Monitoring traffic might have relatively low priority. The marked packets are individually routed toward the sink node in a differentiated manner.
(Figure 2) Traffic Classification Algorithm
3. Packet Priority based Control Congestion Mechanism
3.1 Congestion Detection
The congestion control mechanism is subdivided into congestion detection, congestion notification and congestion control. The congestion condition can be detected by using average packet service time and inter-arrival time. Packet service time means duration from the time of packet arrival at MAC layer to the time at which the packet is completely transmitted. Inter-arrival time means duration from the time
of receiving a packet to the time of receiving its subsequent packet. In this paper, from now on, denotes a packet service time and denotes inter-arrival time. In the proposed scheme, a packet wait time is also used in calculation in order to more accurately detect the congestion condition. The value of can be obtained once the specific packet is processed.
If the packet fails to be processed due to the drastic increase of incoming packets, will not be updated. In this case, detection of the congestion condition would be delayed. To prevent this happening, which is not higher than packet wait time is used.
represents the duration during which packet is waiting to be processed at node. This value is accumulated whenever a node receives a packet and reset once the packet is processed.
The followings are equations to compute and which are used for determining the congestion condition.
× × × ×
×
(1)
×
(2)
denotes the average for the most recently processed four values which are individually multiplied by a constant value so as to have higher influence as the more recent value, while is similarly computed but replacing
with . is calculated by multiplying a weight (real number between 0 and 1) into
and , whereas is calculated by multiplying a weight into and the current
value. Since the current network condition is important as well as the accumulated condition of network, little bit higher weight needs to be put on and the current value.
is updated upon completion of processing the packet, and and are updated using equation 1 and 2 upon arrival of packet. The algorithm to determine the congestion condition is constructed by comparing and , dividing the case
that is greater than or not, and checking buffer occupancy rate. The condition with both of greater than
and high buffer occupancy rate is determined to a strong congestion condition, while the condition with greater and low buffer occupancy rate is determined to a weak congestion condition which implies that it is highly likely to be a strong congestion situation soon. The condition with lower is defined to be a weak congestion because it means that network condition is not congested at the moment. If is lower than
but the buffer occupancy rate is under 10%, it is defined to be an under-provision. In this case, packet generate rate is necessary to be boosted up for achieving better network efficiency.
3.2 Congestion Notification
There are mainly two different methods used to notify congestion: ECN(Explicit Congestion Notification) [6] and ICN(Implicit Congestion Notification) [7]. In this paper, ICN is employed for notifying congestion information to other neighbor nodes as ICN produces lower overhead compared to ECN. Once the nodes receive the notification of congestion information, they initiate to control the congestion state according to the congestion degree.
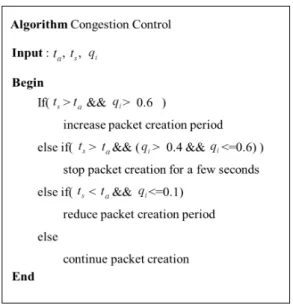
3.3 Congestion Control Algorithm
Figure 3 represents the congestion control algorithm.
and equal to the values computed by equation 1 and 2.
means the buffer occupancy rate for node i. When >, arrival of packets is faster than processing, which results to the situation where the number of packets waiting for processing in buffer get increased. At 40-60% of the buffer occupancy rate, congestion might happen. In this case, notification of the congestion condition as a weak congestion state is sent out. Then packet generation will be temporarily stopped. At higher than 60% of the buffer occupancy rate, notification as a strong congestion state is sent out because it can be considered that significant congestion might happen soon. Then packet generation interval gets increased to slow down the speed of incoming packet arrival. If ≺ and the buffer occupancy rate is lower than 10%, notification as
an under-provision state is sent out. Then incoming packet arrival speed gets increased. Other than these states is determined as stable-state, so the algorithm maintains this state without any adjustment after sending notification of the congestion state as well-provisioned. Since it takes time to complete transition of states and switching network state, state transition is required to be restricted for a certain duration once the notification is received, so that network can be efficiently controlled and managed.
(Figure 3) Congestion Control Algorithm
4. Performance Analysis through Simulation
4.1 Simulation Implementation
Simulation script has been implemented by C++ language in Visual Studio 2010 environment. Network for the simulation is constructed with 10x10 grids by placing 100 nodes. The types of nodes used in this network are divided into source node, sink node, background traffic node and relay node. In simulation, a source node plays a role to generate target packets and send them destined to sink node. A sink node as a destination node for packets stores the incoming packets at queue in order of arrival. Upon completion of simulation, a sink node generates output of information on packet delay
Parameter Values Field size (0m, 0m)~(100m, 100m)
Sink node (0m, 0m)
Source node (99m, 99m)
Traffic node (90m, 90m) ~(96m, 96m), (9m, 9m)~(69m, 69m) Transmission range 1m
Source packet generation cycle 0.1s Traffic packet generation cycle 0.01s ~ 0.10s Packet size 16 bytes, 256 bytes Initial node energy 1J
Transmission energy
consumption 185uJ
Receiving energy consumption 83uJ Standby energy consumption 15uJ Simulation running time 10000ms
Transmit time 0.96ms
Collision waiting time 1.58ms (Table 1) Simulation Parameter and packet loss. Energy of the sink node is assumed to be
never-depleted because it is supplied in a wired way. A background traffic node is in charge of periodically producing traffic to the network at specified interval to set network condition to be a specific congestion state. It also performs the functionality as a relay node for the received packets at the same time. A relay node plays a role to pass the received packet to the subsequent node. For simulation purpose, packets are forcibly destined to sink node only.
Each node is implemented so as to consume a pre-set level of energy for each case when it transmits, receives, and suspends by congestion. MAC functionality was implemented in accordance with IEEE802.15.4[8] mechanism. Packet can be transmitted and received only between two adjacent nodes in the direction of up, down, left and right. For comparison and analysis, prior to conducting the simulation, the simulation was implemented that can be set one of modes among priority-based routing, shortest path routing and whether using congestion control or not.
4.2 Simulation Environment Configuration Figure 4 shows the network configuration for simulation.
The sink node is placed at (0,0), while the source node is placed at (99,99) which is farthest away from the sink node.
Background traffic nodes are positioned as seen in figure 4.
The remaining nodes are set to perform a role as relay node.
For all nodes except for the sink node, the size of message queue was set to be limited so that the node will discard the packets received after the queue is fully occupied. The value LinkCost exists at each link. This value is set differently with an attempt to put differentiation since distance from the source node to the sink node is all the same for any route due to the characteristic of 10x10 single-hop network. LinkCost can be one of ten levels between 1.0 and 2.0. Transmission time will differ at different level. Transmission time is 0.96ms for 1.0, while 1.92ms for 2.0. LinkCost is set based on horizontal and vertical position of the node. Then the routing table is constructed using these LinkCost values for nodes. The shortest path routing algorithm takes a path with lower LinkCost, whereas the priority routing algorithm takes a path with lower LinkCost for Green level and a path with higher residual energy
for Red level. In case of having the same residual energy, the path with higher LinkCost will be selected. The parameters set for the simulation are listed in table 1. The parameter values used in the simulation were followed in [8].
(Figure 4) Network Configuration for Simulation
4.3 Simulation and Results
In this paper, three different routing mechanisms are
(Figure 5) Packet Delay in the Shortest Path Routing (Figure 6) Packet Delay in the Priority Routing
(Figure 7) Packet Delay in the Congestion-Controlled Priority Routing
compared as follows: the proposed mechanism, the shortest path routing, and the priority routing. Simulation was carried out by selecting the simulation mode and the routing mechanism and adjusting the packet generating interval for background nodes. Network congestion degree is assumed to be 10% and 90% at 100ms and 10ms of the packet generation interval in background traffic nodes respectively. Simulation was carried out at the fixed time mode during fixed 10 seconds and the network lifetime mode in which simulation is being continuously conducted until any node with depleted energy appears in the network. Packet delay and packet loss rate are verified at the fixed time mode, while network lifetime is verified at network lifetime mode.
Figure 5, 6 and 7 illustrate the graphs showing packet delay.
The durations were measured from the time when the target packet is generated to the time when it arrives at the sink node. Firstly, figure 5 shows the simulation results obtained using the shortest path routing. At 50% or higher of the
congestion degree, it is observed that packet delay gets gradually increased. The packet delay was recorded up to 700ms even though it is not shown in the graph. Secondly, figure 6 shows the simulation results obtained using the priority routing. Though green-level packets arrive faster than red-level packets overall, it is indicated that congestion appears once the network traffic turns into higher than 60%. The threshold of occurrence of congestion is higher than that of the shorted routing mechanism. However, an occurrence of congestion was inevitable and the packet delay cannot be avoided. Finally, figure 7 shows the simulation results obtained using the proposed mechanism which is a congestion-controlled priority routing scheme. In this case, it is observed that no congestion appears so good network condition was maintained stably. The simulation results indicate that the proposed mechanism has capability of automatically adjusting network condition by stopping the packet generation and increasing the packet generation interval in conjunction with congestion control.
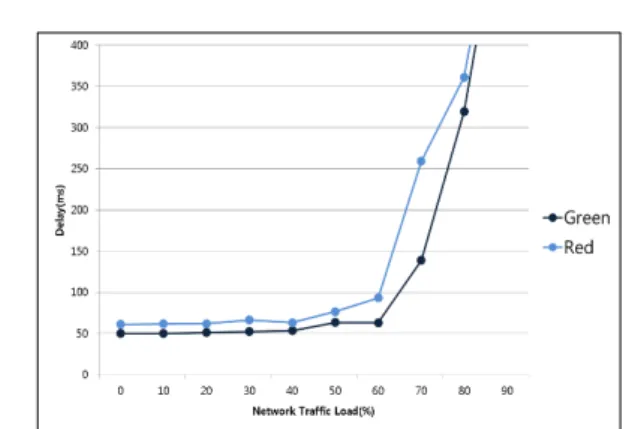
(Figure 8) Integrated Results Graph for Packet Delay
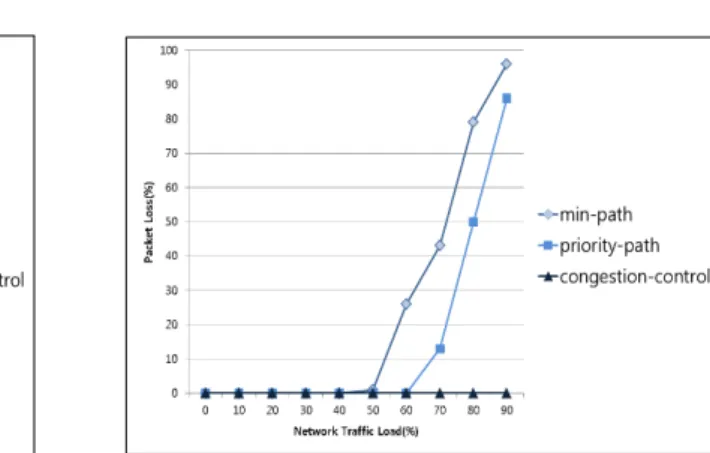
(Figure 9) Integrated Results Graph for Packet Loss Rate
(Figure 10) Results Graph for Packet Processing Rate
Figure 8 is a graph integrating the packet delay results. For the priority routing, the average packet delays are presented as green and red. The graphs indicate that the proposed mechanism applying congestion control shows an outstanding performance for packet delay. Figure 9 shows the graphs comparing the packet loss rate at varying network congestion degree. The proposed mechanism applying congestion control produces no packet loss, while other two mechanisms produce packet loss. The simulation results adopting the network lifetime mode is shown in figure 10. The shortest lifetime is shown at the shortest path routing. The priority routing shows the longest lifetime until the network congestion becomes 30%.
Since then, however, it gradually decreases. The proposed mechanism shows relatively constant lifetime as it makes packet generation induced at not-congested network state but
suppressed at congested state. Therefore, the simulation results prove that network is properly maintained in safe condition as network gets congested.
5. Conclusion
Since multimedia data in WMSNs cause large amount of data transmissions and computations compared to the traditional sensing information, the data are hardly be accommodated by the traditional sensor network. Additionally, congestion state is necessary to control due to the packet loss sensitivity.
In this paper, we conducted a study on the mechanism to mitigate the effect caused by congestion by detecting, notifying and controlling the congestion condition in network. The
proposed mechanism aims at achieving efficient use of network by distributing traffic across the network with use of applying priority routing. For detecting traffic in more accurate way, packet wait time is adopted in addition to a packet inter-arrival time, a packet service time and a buffer occupancy rate. To compare and analysisthe performance of the proposed mechanism, simulation was carried out by fixing the amount of source node traffic and varying the amount of background traffic at three different routing algorithms of the shortest path routing, the priority routing and the proposed congestion controlled priority routing mechanism. The simulation results indicate that average packet delay when applying the proposed mechanism decreases by maximum 90% at the degree of network load from 0% to 90%. Packet loss rate is also reduced from maximum 96% to 0%. The lifetime of simulation increases by 61% at 90% of network congestion degree.
Furthermore, when the network condition is not congested, the packet generation is encouraged so as to improve efficiency of network utilization. The future research plan is to investigate and resolve problems that might happen when the proposed mechanism will be applied in real field.
Acknowledgement
"This research was supported by the MSIT(Ministry of Science and ICT), Korea, under the ITRC(Information Technology Research Center) support program(IITP-2017- 2013-0-00877) supervised by the IITP(Institute for Information
& communications Technology Promotion)“
References
[1] S. Ehsan, B. Hamdaoui, “A survey on energy-efficient routing techniques with qos assurances for Multimedia
Wireless Sensor Networks”, IEEE Comm. Surveys Tutorials, pp. 1-14, 2011.
http://doi.org/10.1109/SURV.2011.020211.00058 [2] S.Y. Bae, “Traffic Control Mechanism Considering
Congestion in Wireless Multimedia Sensor Networks”, Computer Science, Sunchon National University Ph.D.
Thesis, 2014.
[3] S.Y. Bae, S.K Lee, K.W Park, “Design and Imple- mentation of the Environment Monitoring System for Outdoor Cultivation Based on WMSN,” GST/SIA 2012, Communications in computer and Information Science, vol. 338, pp. 314-319, Dec. 2012.
https://doi.org/10.1007/978-3-642-35251-5_44
[4] J.H. Kim, S.K Lee, J.G Koh, C.R. Jung, Changryul Jung,
“A Marking Algorithm for QoS Provisioning in WMSN,”
The Korea Institute of Electronic Communication Sciences 5(2), 2010.4, pp195.
[5] http://100.daum.net/encyclopedia/view/55XXXXX29343.
[6] S. Floyd, “TCP and Explicit congestion Notification”, ACM Computer communication Review, Vol. 24, No.
5, October 1994, pp. 10-23.
https://doi.org/10.1145/205511.205512
[7] C. Wang, B. Li, K. Sohraby and M. Daneshmand,
“Upstream Congestion Control in Wireless Sensor Networks Through Cross-Layer Optimization,” Proc.
IEEE Journal on Selected Areas in Communications, Vol.25, No. 4, May. 2007.
https://doi.org/10.1109/JSAC.2007.070514
[8] IEEE 802.15.4–2006, “Wireless Medium Access Control(MAC) and Physical Layer(PHY) Specification for Low-Rate Wireless Personal Area Network (LR- WPANs),” IEEE Computer Society, Sept. 2006.
https://doi.org/10.1109/IEEESTD.2006.232110
◐ Authors ◑
Dong-Ok Cho
2010 B.S in communication from Korea National Open University, Seoul, Korea 2014 M.S in Computer Science and Engineering, Sunchon National University, Korea
2017 Ph.D Certificate in Computer Science and Engineering, Sunchon National University, Korea Research Interests: Database, Wireless Sensor Networks.
E-mail: [email protected]
Jin-Gwang Koh
1982 B.S in Computer Science and Engineering from Hongik University, Seoul, Korea 1984 M.S in Computer Science and Engineering from Hongik University, Seoul, Korea 1997 Ph.D in Computer Science and Engineering from Hongik University, Seoul, Korea
1988~Present: Professor, Department of Computer Science and Engineering, Sunchon National University, Korea
Research Interests: Database, Wireless Sensor Networks.
E-mail: [email protected]
Sung-Keun Lee
1985 B.S in Electronics Engineering from Korea University, Seoul, Korea 1987 M.S in Electronics Engineering from Korea University, Seoul, Korea 1995 Ph.D in Electronics Engineering from Korea University, Seoul, Korea
1997~Present: Professor, Department of Multimedia Engineering, Sunchon National University, Korea Research Interests: Energy Efficient Ethernet, Wireless Sensor Network, Multimedia Communication, Internet QoS
E-mail: [email protected]