論文
Influence of CO 2 constraints to airlines by EU-ETS on passenger behavior
Baek Jae Kim* Kwang Eui Yoo*, Youn Chul Choi**
EU-ETS로 인한 항공사의 탄소비용증가가 항공여객에게 미치는 영향
김백재*, 유광의*, 최연철**
ABSTRACT
유럽연합(EU)은 2012년부터 항공산업에 대해 탄소배출권 거래제도를 적용할 예정이다.
따라서 유럽공항에서 출발 및 도착하는 모든 국제선과 국내선 항공편에 대해 탄소세가 부 과될 것이며 이는 한국도 예외는 아니다. 또한 유럽을 운항하는 경우 장거리에 해당되어 중단거리를 운항하는 항공기들에 비해 총 탄소배출량이 더 많으므로 비용부담이 커질 것으 로 예상된다. 본 연구는 EU-ETS로 인한 탄소세가 항공요금에 반영된다면 항공여객들이 어 느 정도 민감하게 반응할 것이며 이러한 점들이 궁극적으로 한국의 항공시장에 어떤 영향 을 미칠 것인지를 파악해 보는데 목적이 있다. 이를 위해 인천국제공항에서 프랑크푸르트 국제공항 노선을 이용하는 승객을 대상으로 직항노선과 중동지역 경유노선을 비교하여 EU-ETS 가격이 반영된 항공요금에 대한 반응을 Revealed Preference (RP)와 Stated Preference (SP) 설문자료와 Logit Model을 사용하여 분석하였다. 본 연구결과는 한국의 항 공산업은 물론 2012년부터 부과될 EU-ETS에 대한 항공사들의 전략개발에 도움이 될 것이 다.
Key Words : Environment(환경), Emission Trading Scheme(배출권거래제), RP(Revealed Preference), SP(Stated Preference), Logit Model(로짓모델), CO2 Emission Charge(탄소세)
2011년 8월 12일 접수 ~ 2011년 9월 19일 심사완료
* 한국항공대학교
** 한서대학교 항공학부
연락저자, E-mail : [email protected] 충남 태안 남면 신온리 산 105 한서대학교
I. Introduction
Air Travel contributes to climate change like other transportation methods and causes environmental and economic damage by its CO
2emission. The contribution of the aviation sector to CO
2emissions is only about 3% for the mean time, where as 19% are caused by road transportation. However, the real impact of air travel CO
2emissions may be twice as
high or even higher compared with CO
2emissions on the ground. Because aircraft emissions are unusual in that a significant proportion is emitted at a high altitude. These emissions give rise to important environmental concerns regarding their global impact and effect on air quality at the ground level.
Aviation demand grew rapidly in the past decades and it is expected that this growth will be continued(Boeing, 2007; de Haan, 2008;
Horton, 2006). At the same time, fuel consumption and CO
2emission of aviation sector grew about 2~4% in the past decades and it is expected to grow further(Schlageretal., 2007) also. The demand for air transportation has increased steadily over the years.
Passenger numbers have grown by 45% over
the last decades and have more than doubled since the mid-1980s. Further, freight traffic has increased even more rapidly: by over 80% on a tone- kilometer performed basis over the last decade and almost three-fold since mid -1980s. (VETS Report, ICAO, 2007) Expected technological innovations cannot prevent an increase in CO
2emissions from aviation sector due to the high increase in demand(deHaan, 2007). The Inter governmental Panel on Climatic Change (IPCC) completed a report on the effects of aviation on the global climate and is a much cited reference in this field(Penneretal.,1999).
The European Council and the European Parliament agreed in July 2008 to include international aviation into the existing European Union Emissions Trading Scheme (EU-ETS) for the limitation of CO
2emissions.
The Directive came into force in February 2009(Council of the European Union, 2009).
Aircraft operators will be obliged to surrender allowances for all commercial flights landing at and departing from any airport in the EU from 2012 onwards. With this legislative process, the EU-ETS will not only include airlines based in the EU, but in fact all carriers operating at airports in the EU.
Therefore, flights from South Korea to EU will be also affected. This paper analyses how the EU Directive for the inclusion of international aviation into the EU-ETS will affect the international air transportation sector especially to Korean Aviation Market.
The EU Directive, as it came into force in February 2009(Council of the European Union, 2009) contains the following provisions for the inclusion of aviation into the existing emissions trading scheme:
- The emission trading scheme will cover all flights departing from or arriving at EU airports from 2012 onwards.
- Aircraft operators will be the responsible entities for holding and surrendering allowances for CO
2emissions.
- Regulations for emission monitoring and reporting will take effect in 2010 while an emission cap for all aircraft operators will be
introduced in 2012.
- The EU Directive for the period 2013~2020 (Council of the European Union, 2008), as it was agreed in December 2008, aims at improving and extending the greenhouse gas emission allowance trading system of the Community.
The cost effects for passengers will depend to a large extent on the ability of airlines to pass through cost increases to the demand side. Similar to the imposition of fuel surcharges in recent years due to high oil prices, it can be expected that airlines will be able to pass through a large extent of the cost increase. If airlines will be able to pass through only the acquisition costs of allowances to be purchased in addition to the free allocation, we expect an average cost increase per ticket. The cost increase for long-haul flights can be substantial, if the complete trip is subject to the EU-ETS and acquisition as well as opportunity costs will be passed on to the passenger. Direct operating cost of long-haul route airlines to EU airports will be affected more than medium-haul and short-haul route airlines. Between Far-East Asia and EU routes, transiting via Middle-East is more favorable than direct operation since CO
2emission charge is calculated on the basis of flying distance from departing airport to EU airports. So, it implies a cost disadvantage for long-haul route direct operating flights.
The objectives of this paper are as follows:
After an overview of the influence of CO
2constraints to aviation industry and EU
Directive as it contains provisions for the
inclusion of aviation in the existing emissions
trading scheme, we’ll assess which major
factors influencing air flight choice in the
market were found through the RP(Revealed
Preference) data analysis. And these factors
will be adopted as attributes for the SP(Stated
Preference) experiment, as they have reality as
identified through observed behavior. Charging
for aviation emissions or terrestrial greenhouse
gas emissions requires a price to be put on
the value of one tonne of carbon dioxide. The
exact charge for CO
2emissions levied by an
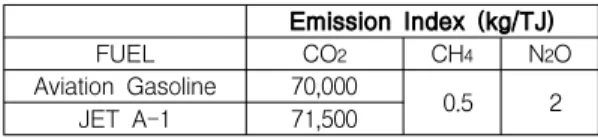
offsetting company is also a subject matter. We have used basic measures of the cost of carbon dioxide emissions based on IPCC guideline(김 민정, 안미진, 2008).
Emission Index (kg/TJ)
FUEL CO2 CH4 N2O
Aviation Gasoline 70,000
0.5 2
JET A-1 71,500
Table 1. IPCC Guideline(Aviation Emission)
EU-ETS assign an economic value to emissions of carbon dioxide. Under such market based schemes, the price is variable and is strongly influenced by supply and demand. At the time of survey EU-ETS is currently trading at EUR 10 per tonne of carbon dioxide. So, we have worked on the assumption that KRW100,000(approximately USD90) of EU-ETS charge will be added to the ticket price of direct flight from ICN to FRA and KRW50,000 (approximately USD45) will be added to the ticket price of transit via Middle-East flight based on the current carbon calculating system. The calculation for the volume of CO
2produced on the flight is based on actual operating performance rather than an industry average. It takes account of the fuel consumed, the relative efficiency of the aircraft and the number of passengers carried. As an imperical research, A330 and B777 airraft type has been used to calculate expected EU-ETS charge per passenger under the 80% of average load factor. It has ensured that it’s operating procedures, as far as possible to minimize environmental impact. And then, we will gather information thru the survey from the passengers what is their preferable choice.
It will be focused on the passenger’s reaction and choice of the respective airfares reflecting EU-ETS CO
2emission charge to find out the influence to the South Korean aviation market.
To calibrate a disaggregate transport choice model, the data about observed choice, called revealed preference (RP) data, have been generally used up to the mid-1980s. However, RP data have some practical limitations: (a) they frequently show insufficient variation for
some variables of interest to calibrate an accurate statistical model, (b) it is often difficult to estimate model parameters reflecting the proper trade-off ratios because of strong correlations between explanatory variables of interest, and (c) very large surveys may have to be carried out to obtain sufficient observations to calibrate statistically accurate models. Stated preference (SP) techniques that use respondents’ statements about preferences in a set of transport options can overcome the shortcomings of the RP method because researchers have control over composition of hypothetical alternatives. The drawback of SP techniques is that the data obtained represent individuals’ statements of what they would do given hypothetical choices. However, people may not do what they say. This disadvantage can be somewhat overcome by presenting respondents with as realistic a set of situations as possible. This work used SP and RP data, gathered by the surveys, to complement the shortcomings of each method.
2. Survey and Data Preparation
The questionnaire for the survey was composed of three parts. The first part was for the flight information, for example Nationality of Airlines, Flight Time, Intermediate-stop Airport, Purpose of Travel, Reasons to choose this flight, and so on. The second part was for personal socioeconomic information. The third part was the main information of analysis including questions related to flight choice procedure and the opinion about the chosen flight.
The survey to gather RP data was
conducted at the passenger terminal of Incheon
Internati onal Airport in South Korea, in May
2011. The questionnaires were distributed to
the passengers going to the FRA airport from
ICN airport. The survey distributed a total of
120 questionnaires and 119 questionnaires were
collected. A total of 11 questionnaires were
eliminated from the analysis because of a lack
of consistency.
A total of 108 collected questionnaires were fully utilized as a sample. The useful data for this research were selected according to following principles. (1) The observations from which the round trip ticket price between Incheon International Airport (ICN) and Frankfurt Main Airport (FRA) could be identified were included in the useful data set.
Almost all package travelers and one-way travelers were excluded. A few business travelers whose journeys were paid for by their companies or organizations were also excluded by this principle. (2) Travelers who were going to stay more than 24hours at intermediate-stop cities were excluded because their ticket price might include the extra charge for the stopover. (3) The observations that missed the information about the flight number were excluded. With a missing flight number, it is impossible to validate flight time to destination and airline. (4) Only passengers using scheduled flights were included.
The most serious concern about this data selection is that business travelers who their
company or organization purchased the tickets were excluded from the sample set. This could have caused bias in sampling and the representativeness of the sample could have been damaged(YOO. K. E., and Norman Ashford, 1995).
3. Analysis of Data
Since Nationality of airlines, Journey time and Air Fare were identified as major variables; the Logit model was calibrated against those variables to test the hypothesis that travelers prefer National carriers, short journey time and low air fare and identified the degree of importance of those variables for flight choice in the market.
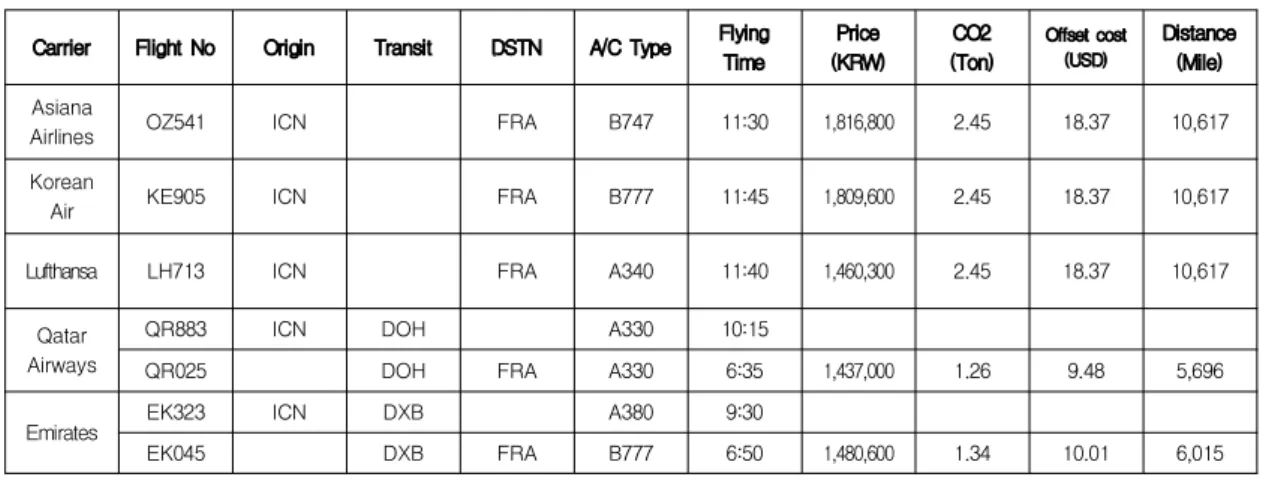
Based on this hypothesis, we have included expected EU-ETS charges to direct flight and transit flight via Middle-East to identify the changes of passengers’ choice behavior whether it’s affected.
Carrier Flight No Origin Transit DSTN A/C Type Flying Time
Price (KRW)
CO2 (Ton)
Offset cost (USD)
Distance (Mile) Asiana
Airlines OZ541 ICN FRA B747 11:30 1,816,800 2.45 18.37 10,617
Korean
Air KE905 ICN FRA B777 11:45 1,809,600 2.45 18.37 10,617
Lufthansa LH713 ICN FRA A340 11:40 1,460,300 2.45 18.37 10,617
Qatar Airways
QR883 ICN DOH A330 10:15
QR025 DOH FRA A330 6:35 1,437,000 1.26 9.48 5,696
Emirates EK323 ICN DXB A380 9:30
EK045 DXB FRA B777 6:50 1,480,600 1.34 10.01 6,015
Table 2. Cost to offset CO
2Emission (Direct versus Transit Flights)
Logit models were calibrated with the economy class observations only, excluding the observations of first class and business class travelers. The input value for the Logit calibration was defined and decided for the chosen alternative as well as rejected alternatives.
The utility function of the model could be
written as:
U=β
0+a
1Nation+a
2JT+a
3Fare+a
4EU-ETS
Where Nation = Nationality of Airlines
(0: Korean, 1: Foreign)
JT = Air Journey Time (Min)
Fare = Air Fare (KRW) EU-ETS = EU-ETS charge (KRW)
a1, a2, a3, a4 = coefficients to be estimated.
The sign of all parameters of each calibrated model is ‘Right’, This means that travelers preferred National carriers, short journey time and low air fare. It confirms that the traveler choice behavior accorded with the hypothesis of the study.
SP Design, Survey and Model Calibration All the factors influencing air passengers’
flight choice should be included in the attribute set to understand travelers’ behavior.
However, it must be pointed out that few respondents are consistently adept at evaluating many attributes at a time. Therefore, it is a major concern at their initial stage of SP design to select a few important attributes and set their level considering reality and simplicity of the hypothetical alternatives. The major factors influencing air flight choice in the market were found through the RP data analysis as described which are follows;
Nationality of airlines, Air journey time and Air fare. These three (3) factors can be adopted as good attributes for the SP experiment, as they have reality as identified through observed behavior.
Response Measurement Scale Three kinds of measurement scales have been used for SP experiments: ranking across options, rating each option, and choices among options. The discrete choice approach is realistic and easier for interviewees because individuals in real environments do not rank or rate travel alternatives; they choose one of them. Moreover, the survey environment of this research was compatible with choice experiments because the survey was conducted in the check-in counter and boarding gate area of Incheon International Airport, and the respondents did not have enough time to
consider rating or ranking the alternatives.
Therefore, it was decided to conduct the choice exercise as an SP experiment.
SP Questionnaire Composition
The questionnaire was composed of two parts. The first part was for segmentation of the samples for the customization of the attribute levels. The second part was for the main SP experiments, which were composed of a pairwise choice game of hypothetical alternatives. There were 12 choice pairs constructed from 6 alternatives. Among the 12 pairs, 6 pairs were composed of one dominated alternative and one dominant alternative in every aspect of the attribute level, and other 6 pairs were composed of competitive alternatives, since it is difficult for one respondent to answer many choice pairs in a short time.
Binary Logistic Regression Result
Un-weighted Cases a N %
Included in Analysis 648 100
Unselected 0 0
Total 648 100
Table 3. Case Processing Summary
a. If weight is in effect, see classification table for the total number of cases
Omnibus Tests -2 Log Likelihood Constant
Step 1 890.742 -0.216
2 890.742 -0.217
Table 4. Omnibus Tests Model Coefficients
a,ba. -2 Log Likelihood: 890.742
b. Estimation terminated at iteration number 2 because parameter estimates changed by less than .001.
We can see from the table above that we
are modeling 648 cases here. Some cases are
deleted from the analysis where information is
missing. The SPSS default for this is listwise.
Only cases where all dependent and explanatory variables are complete are included in the analysis.
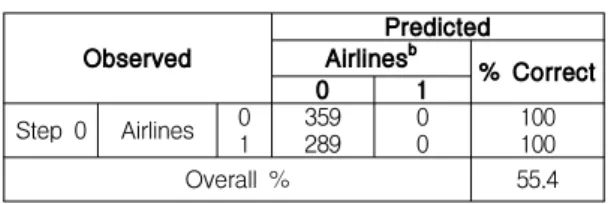
Observed Predicted
Airlinesb % Correct
0 1
Step 0 Airlines 0 359 0 100
1 289 0 100
Overall % 55.4
Table 5. Classification Table
aa. The cut value is .500
b. National Carriers (0), Foreign Carriers (1)
B S.E. Wald df Sig. Exp(B) Step0 Constant -0.217 0.079 7.532 1 0.006 0.805
Table 6. Variables in the Equation
Score df Sig.
Step 0 Variables Airlines 351.61 .000 Journey Time 164.096 1 .000 Air Fare 392.333 .000 Overall Statistics 437.562 3 .000
Table 7. Variable not in the Equation
We have added one new variable to the model, which has reduced the -2 log likelihood by 890.742 with 1 degree of freedom. The -2 log likelihood is a measure of how well the model explains variations in the outcome of interest.
Observed Predicted
Airlinesb % Correct
0 1
Step 1 Airlines 0 332 27 92.5
1 44 245 84.8
Overall Percentage 89
Table 8. Classification Table
aa. The cut value is .500
b. National Carriers (0), Foreign Carriers (1)
The -2 log likelihood (sometimes called, deviance) has a chi squared distribution. It is important to optimize likelihood in the logistic regression analysis. As 2LL value is 890.742 in this model, it is statistically significant.
B S.E. Wald df Sig. Exp(B) 95.0% C.I. for EXP(B)
Lower Upper
Step 1a
Nation -21.797 2602.874 0 1 0.993 0 0 .
JT -3.435 0.732 22 1 0 0.032 0.008 0.135
Fare 1.736 0.299 33.789 1 0 5.672 3.159 10.183
Constant 20.636 2602.874 0 1 0.994 9.17E+08
Table 9. Variable in the Equation
a. Variable(s) entered on step 1: Nationality of Airlines, Air Journey Time and Air Fare