정량분석을 통한
Eleutherococcus
species의 HPLC 분석법 검증과 표준화송미경1, 김미연1, 김호철1,2*
1:경희대학교 한의과대학 본초학교실, 2:뉴메드 한의과학기술연구소
Standardization of
Eleutherococcus
species and HPLC Method Validation for Quantitative AnalysisMiKyung Song
1, Mi-Yeon Kim
1, Hocheol Kim
1,2*1:Dept. of Herbal Pharmacology, College of Oriental Medicine, Kyung Hee University, 2:Korea Institute of Science and Technology for Eastern Medicine, NeuMed Co., Ltd
ABSTRACT
Objective:For the standardization and quality control of eleutheroside E in
Eleutherococcusspecies, HPLC analysis was performed and eleutherosdie E content was compared in 23 kinds of
Eleutherococcusspecies collected from Korea and China.
Methods:The content of eleutheroside E in stem bark of
Eleutherococcusspecies collected from Korea and China were analyzed by HPLC. 0.5% phosphoric acid and acetonitrile was used as mobile solvent. Validation of HPLC analysis method was confirmed by analyzing specificity, linearity, precision and accuracy following ICH guideline.
Results:Content of eleutheroside E was determined to be 1.0-1.6% and 0.5-0.8% in Korean and Chinese
E.senticosus
, respectively. Content of eleutheroside E in
E. sessilifloruswas 0.7-1.1% and 0.2-0.4% respectively in Korean and Chinese origin. All calibration curves showed good linear regression. The method showed good precision and accuracy with intra-day and inter-day variations of 0.880-3.442% (RSD) and 0.606-3.328%
(RSD), respectively, and average recovery was of 0.141-1.363% (RSD), for the eleutheroside E analyzed.
Conclusion:These results might be used to establish a criterion of eleutheroside E in
Eleutherococcusspecies.
Key words:
Eleutherococcus senticosus,Method validation, Standardization, Eleutheroside E, HPLC
INTRODUCTION
Eleutherococcus
species were considered as useful medicinal herbal resource in Korea, China, Japan, and Russia from the time immemorial
1). In Traditional Korean Medicine (TKM), these have been used as a drug with adaptogenic activity
2,3,4), anti-tumor
5), anti-stress
6), fatigue
7)and hypoglycrmic
8). Root and stem bark of
Eleutherococcus senticosus, known as Siberian Ginseng, has been often used to treat stroke as well as tonify
qi, strengthen musule and bone, tranquilize and dispel wind dampness
9). Recent researches have shown that
E. senticosusexerted neuroprotective effect on amyloid beta induced neuritic
atrophy
10). 1-methyl-4-phenyl-1,2,3,6-tetrahydropyridine induced cell death
11), and transient focal cerebral ischemia
12).
Among various diterpenoids and triterpenoids reported from this plant, the lignan compounds, eleutheroside B (syringin) and eleutheroside E (-) syringaresinol-di-O-13-D glucoside, are known to be main active principles
13). Beside these,
E. senticosuscontains chiisanoside, daucosterin, β-sitosterol and sesamin, which are responsible for its diverse biological activities
14).
Among 500 herbal medicines reported in Korean Herbal Pharmacopoeia and Herbal Pharmacopoeia, only 50 herbal medicines are available forevaluationa
*Corresponding author:Hocheol Kim, Department of Herbology, College of Oriental Medicine, Kyung Hee University, 1 Hoegi-dong Dongdaemun-gu Seoul Republic of Korea.
․ Tel:+82-961-0419. ․ E-mail:[email protected].
․ 접수:2010년 12월 9일 ․ 수정:2011년 3월 6일 ․ 채택:2011년 3월 10일
quantitative analysis. On the other hand, 551 herbs listed in Chinese Herbal Pharmacopoeia, 215 herbal medicines can be possible tothrough a quantitative analysis. The standardization and the quality control of the active constituents of many herbs are still lacking
15).
In this study, the content of eleutheroside E in 23 kinds of
Eleutherococcusspecies collected from Korea and China weredone by HPLC analysis. It was carried out HPLC method validation and quantity standardization according to the International Conference on Harmonization (ICH) guidelines.
Material and Methods
1. Plant materials
Dried stem barks of twenty three kinds of
Eleutherococcusspecies were purchased from Kyung Dong Herbal Market, Jegi-dong Seoul, Korea and Cheolwon and Yang-gu, Gangwon-do, Korea. Samples were identified by Professor Dr. Hocheol Kim, Department of Herbal Pharmacology, College of Oriental Medicine, Kyung Hee University, Seoul, Korea.
2. Chemicals and Reagents
All reagents were of analytical grade.
Acetonitrilewas purchased from J. T. Baker (Phililpsburg, NJ, USA). Eleutheroside E was obtained from Chromadex (purity ≥ 92.3%). Water was filtered through a 0.45 µm membrane (Millipore, Bedford, MA, USA).
3. Preparation of the crude extracts
At first, the dried stem barks of
Eleutherococcusspecies were cut into the pieces, and then those were extracted with 70% ethanol for 3 hours at 82 ºC in a reflux apparatus. The extracts were filtered, then the filtrate was evaporated in a rotary evaporator and the powders were lyophilized in a freeze-dryer (Operon
TM, Seoul, Korea).
4. Validation for HPLC analysis
1) Preparation of standard and sample solution
Stock solution of 1.0 mg/mL was prepared in 85%
methanol for eleutheroside E. A serial dilution was made on each stock solution with 85% methanol to prepare standard solutions at concentrations of 0.5, 1,
5, 10, 50, 100, and 500 μg/mL from each of which 10 μL was used for plotting the standard curves for eleutheroside E. The
E. senticosusextract (ESE) sample was accurately weighed (50.0 mg), placed in 5 mL of 50% methanol in aqueous solution in an ultrasonic device for 30 sec for extraction. This ESE solution was passed through a 0.45 µm syringe membrane filter and 10 µL of the filtrate was injected in triplicate the HPLC system for quantitative analysis.
2) Chromatographic conditions
Analysis was performed in a Waters instrument equipped with a Waters 600 pump, a Waters 717 autosampler and a Waters 996 PDA detector using a SunFire
™C18 column (5 μm;4.6×250 mm;Ireland).
The column was equilibrated with a 95:5 mixture of distilled water containing 0.5% phosphoric acid (solvent A) and acetonitrile (solvent B) at a flow rate of 1.0 mL/min. The column was eluted as follows: 0–
60 min 5–50% solvent B, 60–61 min 50–70% solvent B, 61–80 min 70–70% solvent B. Column temperature was kept constant at 25 ˚C. The absorbance was measured at 205 nm for detection of eleutheroside E.
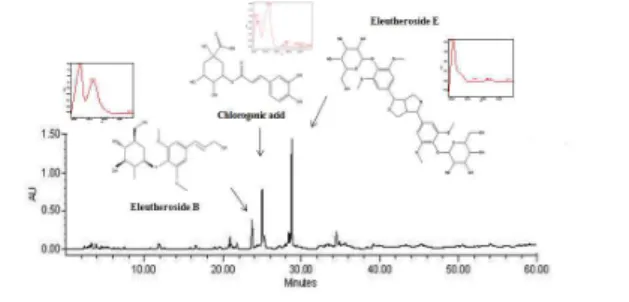
The 2-D HPLC chromatogram of
Eleutherococcusspecies is shown in Fig. 1.
Fig. 1. 2-D HPLC Chromatogram for Standardization of Eleutherococcus Species.
Detection was performed by using a photodiode array detector. X-axis is retention time;Y-axis is wavelength, and Z-axis is absorbance unit. Analytical conditions were as follows:column, SunFire
™C18 (5
µm; 4×250 mm);mobile phase, solvent A (0.5%
H
3PO
4) and solvent B (CH
3CN);Gradient program, 0-60 min 5-50% B;60-61 min 50-70% B;61-85 min 70% B. The column temperature was kept constant at 25 ˚C. The flow rate was set at 1.0 mL/min and the injection volume was fixed at 10 µL.
The UV wavelength was monitored at 205 nm.
3) Linearity and range
To assess the linearity of standard curve, seven
different concentrations of standard were prepared
and injected to HPLC system. Six replicates of eight calibration standards were analyzed for each range.
The regression equation was calculated in the form of Y=AX+B, where Y and X are the area of the peak and the sample amount, respectively.
4) Specificity
The analyte was confirmed by spiking the eleutheroside E (0.1 mg/mL) with the ESE (10.0 mg/mL). UV spectra of ESE compared with the eleutheroside E. The selected monitoring wavelengths for eleutheroside E was maximum absorption wavelengths. The eleutheroside E from ESE was identified by comparing to the retention times and UV spectra of the eleutheroside E.
5) Precision and accuracy
Intra-day and inter-day variations were determined the precision were estimated by analyzing six replicates containing the standard compound at three different concentration (25, 50, 100 µg/mL) in a single day and for six days, respectively. Variations were expressed by the relative standard deviations (R.S.D.).
The average recovery was calibrated by formula.
Where amount
(found)is the determined total amount of each analyte, amount
(Original)is the original amount of each analyte in ESE measured above, and amount
(spiked)is the spiked amount of each analyte.
6) Limit of detection and limit of quantification (LOD and LOQ)
The LOD was defined as the concentration of the standard solution with a signal-to-noise (S/N) ratio >
3.3. The LOQ was defined as the concentration of standard solution with a S/N > 10. LOD and LOQ for
eleutheroside E were also shown in Table 1.
The LOD and LOQ were calibrated by formula.
LOD = 3.3×(S.D. of the response / slope of the calibration curve)
LOQ = 10×(S.D. of the response / slope of the calibration curve)
7) Quantitative analysis
The concent of eleutheroside E in the final solution was determined by using a calibration curve of concentration versus peak area and expressed as percentages.
C (%) = (C
spl× V) / M × 1000
Where C
splis the concentration of eleutheroside E in the final solution (µg/mL), V is the total volume of the final solution (mL) and M is the ESE taken for extraction (g).
8) Statistical Methods
Data were expressed as percentages, and recorded as means ± standard deviation(S.D) of triplicate measurements. And
nrepresents the number of replicates. For thestatistical analysis Excel 2007
®(Microsoft) software was used.
Results
1. Method validation
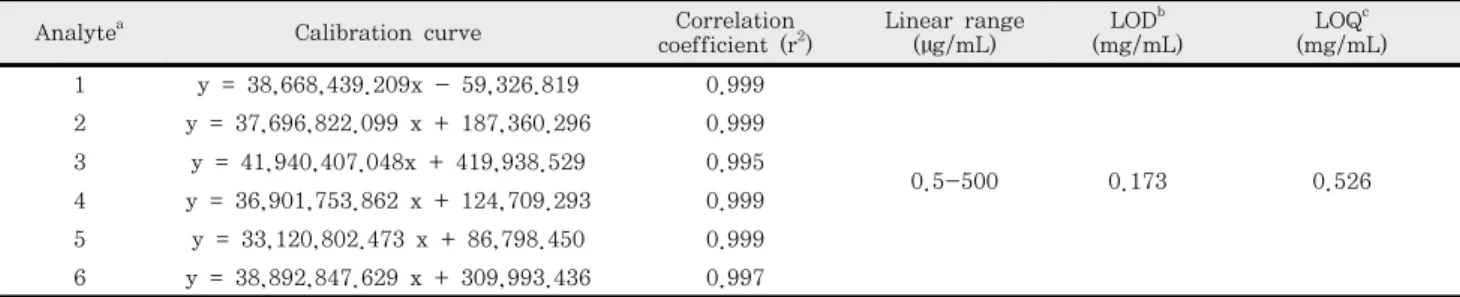
1.1 LinearityThe calibration curves were linear in the tested concentration ranges. The peak area ratio of the eleutheroside E was linear in the range of 0.5–500 µg/mL. The correlation coefficients were all greater than 0.99, indicating high correlation and good linearity of the method. The slopes, y-intercepts, and correlation coefficients (r
2) obtained from regression analysis are shown in Table 1.
Table 1. Calibration curves, LOD and LOQ for the elentheroside E standards. aThe notation for analyte (Eleutheroside E). bLOD refers to the limits of detection. cLOQ refers to the limits of quantification.
Analytea Calibration curve Correlation
coefficient (r2)
Linear range (µg/mL)
LODb (mg/mL)
LOQc (mg/mL) 1 y = 38,668,439.209x - 59,326.819 0.999
0.5-500 0.173 0.526
2 y = 37,696,822.099 x + 187,360.296 0.999 3 y = 41,940,407.048x + 419,938.529 0.995 4 y = 36,901,753.862 x + 124,709.293 0.999 5 y = 33,120,802.473 x + 86,798.450 0.999 6 y = 38,892,847.629 x + 309,993.436 0.997
1.2 Specificity
The eleutheroside E from ESE was identified by comparing the retention times and UV spectra of the
eleutheroside E. Typical chromatogram of eleutheroside E and ESE recorded at 205 nm are depicted in Fig. 2.
Eleu theroside E
Eleutheroside E (a)
(b)
Eleu theroside E
Eleutheroside E (a)
(b)
Fig. 2. HPLC Chromatograms of (a) E. senticosus extract and (b) Eleutheroside E (at 205 nm).
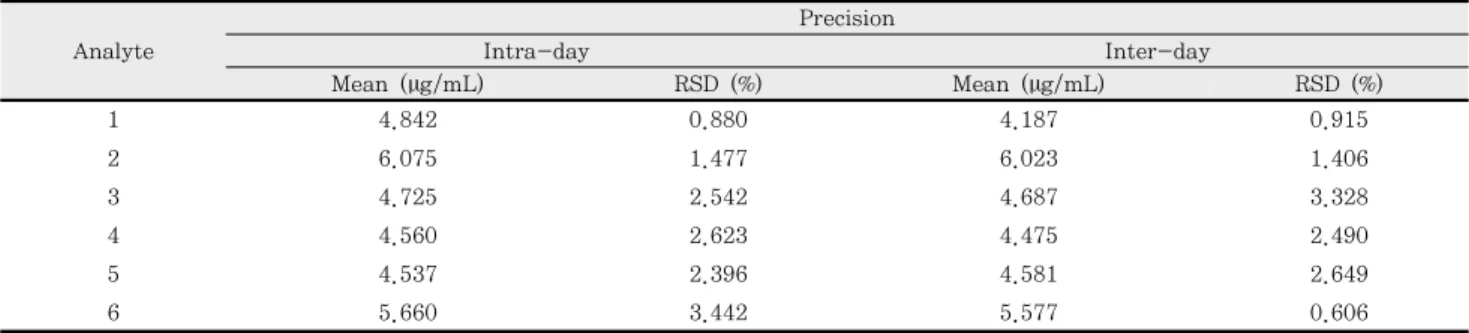
1.3 Precision and Recovery
The relative standard deviation (RSD) values for inter-day precision were 0.88-3.44% and those of intra-day were 0.61-3.33%. The average recovery was
81.26-07.75% (RSD 0.14-1.36%). All of these values are within the acceptance limits of ICH. The results of intra-day and inter-day accuracy and precision analyses of ESE are shown in Table 2 and Table 3.
Table 2. Intra-day and Inter-day variation of eleutheroside E in E.senticosus. (R.S.D., n=6) Analyte
Precision
Intra-day Inter-day
Mean (µg/mL) RSD (%) Mean (µg/mL) RSD (%)
1 4.842 0.880 4.187 0.915
2 6.075 1.477 6.023 1.406
3 4.725 2.542 4.687 3.328
4 4.560 2.623 4.475 2.490
5 4.537 2.396 4.581 2.649
6 5.660 3.442 5.577 0.606
Table 3. Validation for the Recovery of eleutheroside E in E. senticosus . (Recovery (%), n=3)
Added Eleutheroside E
Recovery (%) Mean (%) SD (%) RSD(%)
100%
107.73
107.75 0.976 0.906
108.74 106.79
75%
81.18
81.26 0.115 0.141
81.22 81.40
50%
82.17
83.37 1.136 1.363
83.50 84.43
1.4 Limits of Detection and Limits of Quantification
The LOD and LOQ were 0.173 mg/mL and 0.526 mg/mL, respectively. These results indicate that the method provided adequate sensitivity (Table 1).
2. Analysis of eleutheroside E in different Eleutherococcus species and standardization
2.1. Comparison of eleutheroside E in Eleutherococcus species according to cultivation region
The developed HPLC method was applied to determine the content of eleutheroside E in 23 kinds
of
Eleutheorococcusspeices collected from Korea and China. The content of eleutheroside E was found to be 0.52-2.44% in
E. senticosus, and 0.24-1.61% in
E.sessiliflorus
of Korean origin. Also, in Chinese origin, the content of eleutheroside E was found to be 0.13-0.98% in
E. senticosus, and 0.12-1.61% in
E.sessiliflorus
. Content of the eleutheroside E in Korean
species was found to be 2 times higher than that of
Chinese species. The quantitative analytical results of
eleutheroside E in 23 kinds of
Eleutherococcusspecies
of Korean and Chinese origin are shown in Table 4 to
Table 7. A typical chromatogram of the crude extract
and eleutheroside E is shown in Fig. 1.
Table 4. Contents of Eleutheroside E among 6 kinds of Korean E. senticosus (a Data are given as Mean±S.D. bRefer to dry weight (g) of E. senticosus.).
Sample No. Cultivation region Content of eleutheroside E
Extract bias a (%, n=3) Raw material bias b (%, n=3)
EK1 Korea, Cheolwon 1.69±0.04 0.050
EK2 Korea, Cheolwon 0.92±0.02 0.128
EK3 Korea, Cheolwon 2.44±0.04 0.090
EK4 Korea, Cheolwon 0.52±0.17 0.051
EK5 Korea, Yang-Gu 1.01±0.01 0.053
EK6 Korea, Cheolwon 1.37±0.01 0.045
Average 1.32±0.04 0.070
Range 80% 1.06 0.056
120% 1.59 0.083
Standard 1.02-1.64 0.011-0.183
Table 5. Contents of eleutheroside E among 6 kinds of Chinise E. senticosus. (a Data are given as Mean±S.D. bRefer to dry weight (g) of E. senticosus)
Sample No. Cultivation region Content of eleutheroside E
Extract bias a (%, n=3) Raw material bias b (%, n=3)
EC1 China, Unknwon 0.68±0.05 0.050
EC2 China, Unknwon 0.98±0.03 0.061
EC3 China, Unknwon 0.29±0.05 0.017
EC4 China, Unknwon 0.49±0.05 0.045
EC5 China, Unknwon 0.58±0.02 0.035
EC6 China, Chuancai 0.13±0.01 0.011
Average 0.622±0.034 0.037
Range 80% 0.42 0.029
120% 0.63 0.053
Standard 0.39-0.67 0.006-0.096
2.2 Comparison of eleutheroside E content according to Eleutherococcus species
Eleutheroside E content was compared in 12 kinds of E. senticosus and 11 kinds of E. sessiliflorus collected from Korea and China. Content of eleutheroside E was found to be 0.13-2.44% in E. senticosus and 0.12-1.61% in
E. sessiliflorus.The quantitative analytical results of eleutheroside E in 23 kinds of
Eleutherococcusspecies are shown in Table 4 to Table 7.
2.3 Variation of the eleutheroside E content in E.
senticosus according to harvesting time
The content of eleutheroside E was found to be varied according to the harvesting time of
E.senticosus.
The eleutheroside E content in
E.senticosus
of 2-3 years old was 0.92%, that of 5-6 years old one was 2.44%, and that of 6-9 years old one was 1.69%. The content of eleutheroside E of 5-6 years old was found to be highest. (Table 8).
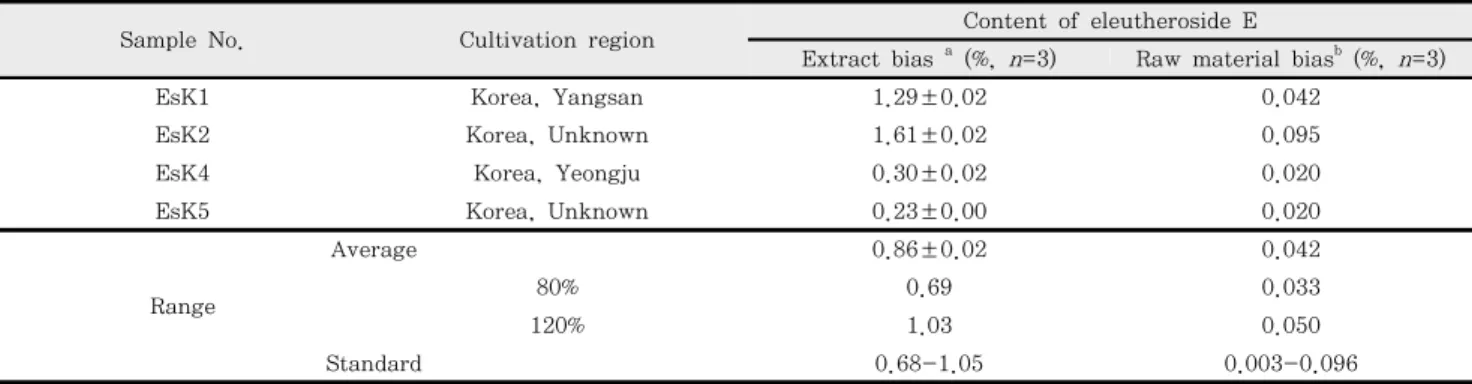
Table 6. Contents of eleutheroside E among 4 kinds of Korean E. sessiliflorus. (aData are given as Mean±S.D. bRefer to dry weight (g) of E. sessiliflorus)
Sample No. Cultivation region Content of eleutheroside E
Extract bias a (%, n=3) Raw material biasb (%, n=3)
EsK1 Korea, Yangsan 1.29±0.02 0.042
EsK2 Korea, Unknown 1.61±0.02 0.095
EsK4 Korea, Yeongju 0.30±0.02 0.020
EsK5 Korea, Unknown 0.23±0.00 0.020
Average 0.86±0.02 0.042
Range 80% 0.69 0.033
120% 1.03 0.050
Standard 0.68-1.05 0.003-0.096
Table 7. Contents of eleutheroside E among 6 kinds in Chinese origin E. sessiliflorus. (a Data are given as Mean±S.D. b Refer to dry weight (g) of E. sessiliflorus).
Sample No. Cultivation region Content of eleutheroside E
Extract bias a (%, n=3) Raw material bias b (%, n=3)
EsC1 China, Unknown 0.72±0.02 0.055
EsC2 China, Unknown 0.51±0.01 0.033
EsC3 China, Unknown 0.66±0.01 0.046
EsC4 China, Unknown 0.13±0.00 0.008
EsC5 China, Unknown 0.12±0.01 0.013
EsC6 China, Unknown 0.16±0.00 0.019
Average 0.56±0.01 0.024
Range 80% 0.25 0.019
120% 0.38 0.029
Standard 0.25-0.39 0.004-0.063
Table. 8. Contents of eleutheroside E among 3 kinds of Korean E. senticosus according to harvesting time.(a Data are given as Mean±S.D. bRefer to dry weight (g) of E. senticosus.)
Sample No. Cultivation region(Harvest time) Content of eleutheroside E
Extract bias a (%, n=3) Raw material bias b (%, n=3)
EK2 Korea, (2~3) 0.92±0.02 0.050
EK3 Korea, (5~6) 2.44±0.04 0.128
EK1 Korea, (6~9) 1.69±0.04 0.090
Average 1.68±0.03 0.089
Range 80% 1.347 0.014
120% 2.021 0.236
Standard 1.32-2.06 0.07-0.10
2.4 Standardization of eleutheroside E content in Eleutherococcus species
Finally, quality standardization was determined by 80-120% range of average value of eleutheroside E content. Content of eleutheroside E was found to be 1.02 to 1.64% and 0.39 to 0.67% in Korean and Chinese
E. senticosus,respectively. Eleutheroside E content was 0.68 to 1.05% and 0.25 to 0.39% in
E.sessiliflorus
of Korean and Chinese origin.
Discussion
Quantity of photochemical in plant might be affected by the geographical variation, climatic condition, soil condition, environmental factors, etc.
This leads to the variation in the quantity of active constituents depending upon seasonal and environmental factors
16).
The method was developed and validated in compliance with the ICH guidelines and is suitable for the simultaneous determination of eleutheroside E in
Eleutherococcusspecies. Calibration curves show the linearity of 0.995-0.999%, LOD of 0.173 mg/mL, LOQ of 0.526 mg/mL, inter-days precision of 0.880-3.442% (RSD), and intra-day precision of 0.606-3.328% (RSD). The average recovery values were of 0.141-1.363% (RSD) for the method
validation.
In this study, quantitative analysis of eleutheroside E in 23 kinds of
Eleutherococcusspecies collected from Korea and China was done by HPLC method and their contents were compared. Content of eleutheroside E was found to be 0.52-2.44% in
E.senticosus
, and 0.24-1.61% in
E. sessiliflorusof Korean origin. Also, in Chinese origin, eleutheroside E content was found to be 0.13-0.98% in
E. senticosus, and 0.12-1.61% in
E. sessiliflorus.Content of the eleutheroside E in Korean species was found to be 2 times higher than that of Chinese species.
Eleutheroside E content was compared in 12 kinds of
E. senticosusand 11 kinds of
E. sessilifloruscollected from Korea and China. Content of eleutheroside E was found to be 0.13-2.44% in
E. senticosusand 0.12-1.61% in
E. sessiliflorus. Eleutheroside E content was found to be 2 times higher in
E. senticosusthan that in
E. sessiliflorus. It was consist with previous report which contents of eleutheroside E was 3 times higher in
E. senticosusthan in
E. sessiliflorus17).This result clearly shows that content of phytochemicals are various depending upon the cultivation region and origin. Also, the content of eleutheroside E was found to be varied according to the harvest time of
E.senticosus.
The eleutheroside E content in
E.senticosus