1. INTRODUCTION
Today's concrete pavement projects have encompassed the various design and methods for achieving better constructability and service life. The average age of pavements varies considerably, but for concrete, it may be as much as 25 to 40 years. This is about 1.5 to 2 times greater than the service life of asphalt pavements (Crovetti and Bischoff, 2001; Packard, 1994). Longer service life with low rehabilitation costs reflects the long- term benefits of concrete performance (Lee, 2005; Lee et al., 2000). Productivity of concrete pavement construction is one of major concerns to accomplish a project within cost and on time, such that the organized identification
and assessment of the considerable factors have been challengeable. In recent decades, highway construction companies have made great efforts to improve the productivity of concrete pavement through the efficient construction process and assessment of the factors associated with production capability. A better productivity has been one of the interests because poor productivity leads to excessive schedule resulting in financial losses. The productivity measurements are intended to build cost-effective construction process, efficient operation of equipment, and material delivery strategy. To measure it, a few comprehensive methods have been developed in the previous researches, however, such approaches have been often insufficient to quantitatively measure the significance of the considerable factors impacting on the productivity (Lee et al., 2002; Zayed et al., 2005). This paper employs multiple
Multiple Regression Technique for Productivity Analysis of the Jointed Plane Concrete Pavement
(JPCP)
Wi Sung Yoo*
Abstract
In highway construction projects, concrete pavement productivity has been challenged with constructors and decision-makers; at present there are few methods available to accurately evaluate the factors impacting on it. Any inefficient method to analyze it leads to the excessive schedule, higher rehabilitation costs, shorter service life, and reduction of ride quality. To implement these negative outcomes, constructors or decision-makers need a systematic tool that can be used to categorize the factors related to construction productivity. This paper applies multiple regression technique for productivity analysis of the Jointed Plane Concrete Pavement (JPCP), identifies the significant factors, and provides a predictive model assisting in monitoring and managing the productivity of the JPCP construction process. The completed and progressive projects are employed to derive and assess the proposed model. The results are analyzed to illustrate its capabilities.
Keywords : Jointed Plain Concrete Pavement, multiple regression technique, predictive model, productivity analysis, significant factors
* 일반회원, Ph.D, BK21 Initiative for Global Leaders in
Construction Engineering, Korea University, S. Korea,
[email protected]
regression technique for investigating the factors and analyzing their significance. The productivity is defined as the dependent variable and the identified factors are referred to the independent variables. This technique derives a predictive model to explain the behavior of the dependent variable (productivity). The predictive model will help constructors or decision-makers obtain useful information assisting to a better construction process and strategy that are feasible to improve the production capability.
2. OBJECTIVES AND SCOPE
In this paper, one of the main objectives is to quantitatively examine the productivity of concrete pavements, and secondly, is to identify the key factors impacting on it. Another objective is to present managerial information by constructing a predictive model on the basis of statistical approach like regression analysis, which is helpful in estimating the possible outcomes resulted from the variables.
Concrete pavement construction is not a labor- intensive but an equipment-intensive process. The construction productivity is dependent upon the capability of equipment and its efficiency. Also, this is controlled by manpower, physical elements of materials, design, environmental conditions of the sites and management constraints. In this paper, data are collected from a few highway projects, supposing that there is no delay of concrete delivery, and that constructors build concrete batch plants in the site based on highway pavement construction specifications. Additionally, there are enough dump trucks to transfer concrete from batch to work place. In general, concrete pavements are executed with highly specialized mechanical equipment controlled by skilled operators. The entire operation has to be organized carefully and performed elaborately. Concrete slip form paver is used to save construction cost and time and to assure higher quality. Low slump concrete is proper for its effective operation, and this is sensitive for
the change of aggregate water content. Paving concrete with low slump is technique-intensive process, and requires prudent attention. There are two typical types in concrete pavements. One of them is a Continuously Reinforced Concrete Pavement (CRCP) and the other is a Jointed Plane Concrete Pavement (JPCP). This paper is concerned with the JPCP, and focuses on analyzing its productivity using multiple regression analysis.
3. DATA ACQUISITION and SUMMARY
3.1 Considerable factors in the JPCP
Based upon the experience and recommendation of project senior managers and supervisors in highway construction sites, considerable factors in constructing the JPCP are investigated. However, it is questionable how importantly they affect to the productivity of the JPCP construction. In this paper, more various factors are introduced and described as follows:
● Weather: operators' work efficiency is affected by temperature and humidity.
● Combination of equipment: Figure 1 shows the scene of concrete pavement construction. The right-sided equipment is a concrete spreader, which distributes concrete unloaded from dump trucks. The other is a concrete slip form paver that directly constructs concrete pavement. Their combination is recommended, but it is not mandatory by the specifications. A concrete spreader is used to assure better roughness of pavement. Thus, it decreases the work-load of a concrete slip form paver.
● Age of equipment: even though same equipment is operated in two sites, the paving is executed in different time. Its efficiency varies depended on the degree of the antiquation that deteriorates the productivity.
● Material: it is another considerable factor. Types of cement, grades of coarse and fine aggregate, and fineness modulus of fine aggregate affect to concrete
condition related to the workability and finishability of a slip form paver. These elements ultimately influence concrete slump.
● Longitudinal slope.
● Radius of curvature: construction speed around ramps is retarded, and consequently, the radius degree impacts on the productivity.
● Congestion: if 2 lanes containing shoulder of 4 lane- highway site are constructed, the paving speed for other 2 lanes is crucially decreased. Besides, if 2 lanes are constructed but they are not sufficiently cured, congestion for delivering concrete occurs.
● Repetitive works: it increases the productivity on the basis of learning-curve effects.
3.2 Data acquisition
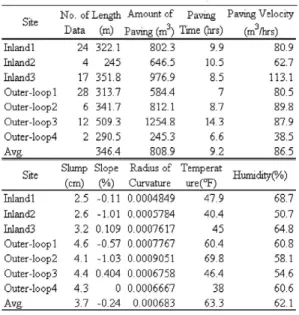
Two types of concrete pavement projects are examined to analyze the productivity of the JPCP. One of them is called as “Inland”, and the other is denoted as “Outer- loop”. Data were collected from 7 projects from “Inland”
and “Outer-loop”as shown in Table 1.
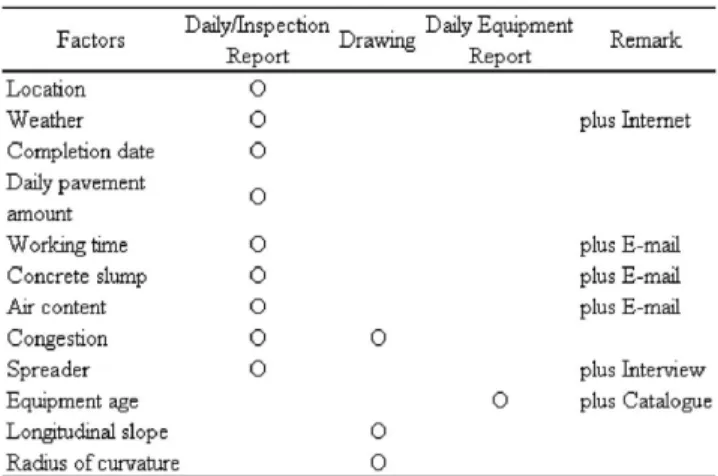
Table 2 presents the several ways to gather data, such as Daily and Inspection reports, Drawings, Machine reports, and individual contacts. Weather information was obtained from the internet. The usage of a spreader, the age of a paving machine, and special reasons of working -stop were investigated by the site reports, catalogues and drawings. Longitudinal slope and radius of curvature were calculated from drawings.
The number of total data set is 93 and the amount of paving concrete and length of pavement are 75,232m3 and 32,217m, respectively, and a few data sets are shown in Table 3. Data set is dependent upon the characteristics and constraints of each project.
Figure 1. Equipment combination in the JPCP construction
Table 1. Summary of 7 highway projects
Table 2. Data collection tools
Table 3. A few data sets
Table 4. Data size
3.3 Data summary
As presented in Table 5, the average length of pavement is about 346m, the amount of concrete is about 809m3, and work-time is about 9.2 hours. The average value of concrete slump and air content are 3.7cm, 4.4%
respectively. The slump is specified, depended on project's conditions, and the allowable slump limit varies ranging from 2.0 to 5.0cm. Air content is stipulated in the specification with the target value of 5.0%. The average temperature and humidity are 63.3�F and 62.1%. These are because the pavement was mainly executed during from Fall to Winter. The average longitudinal slope was calculated as -0.2386% on the basis of drawings.
Paver age ranges from 0 to 5 years as seen in Table 6.
Congestion is represented as 44%(Yes) and 56%(No), and the employment of a spreader is estimated as 18%(Yes)
and 82%(No). This indicates that a spreader was used for 18% of paving works.
4. STATISTICAL ANALYSIS
4.1 Description of each variable and basic analysis
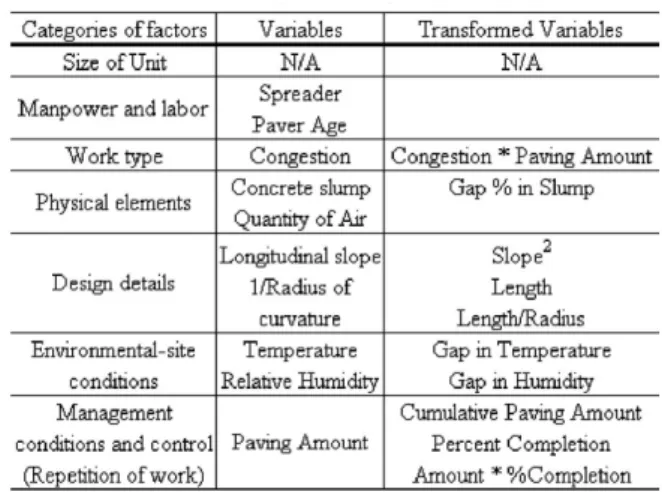
It is important question what major factors impact on the productivity of concrete paving work in highway construction. In this paper, factor model was adopted and used as a base for multiple regression analysis, and this focuses on the productivity analysis, considers the learning-curve effect, and contains other factors that can be measured by data transformation (Thomas and Sakarcan, 1994). The SAS program is utilized to apply multiple regression technique with the descriptions of each variable presented in the below.
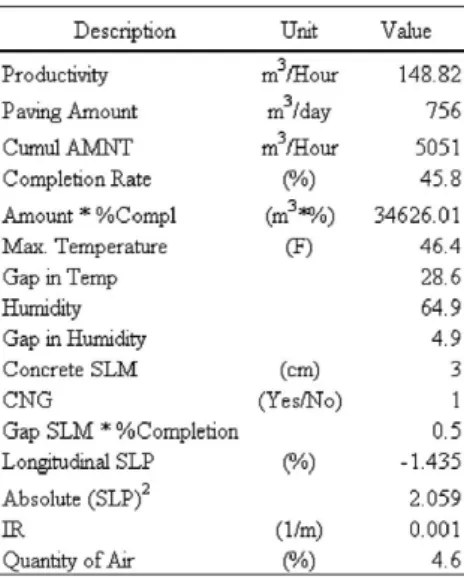
● Productivity (PRD, m3/hr: abbreviation in the SAS program) is derived from the amount of the poured concrete per an hour, which is calculated by total amount for a day over work hours.
● Learning-curve effect is explained by Cumulative Paving Amount (CML, m3) and Percent Completion (PCC, %). The CML is added as an independent variable, and calculated by summing the concrete amount for a day.
● Percent Completion (PCC, %) is computed by the CML over total concrete amount to be constructed.
● Amount times Percent Completion (APC) is devised to investigate the relation between the poured concrete for a day and completion rate.
● Temperature (TMP, ℉) and Humidity (HMD, %);
temperature data were computed on the basis of Grimm and Wagner's study (1974). They found that the productivity decreases as temperature and relative humidity deviates from 75℉ and 60%, respectively. Gap in Temperature (GTMP) is denoted as an absolute value of the difference between the maximum and the optimal temperature (75 ℉). Gap Table 5. Data summary-I
Table 6. Data summary-II
in Humidity (GHMD) is referred to an absolute value of the difference between the average relative humidity and the optimal humidity (60%).
● Concrete Slump (SLM, cm) is the actual value. The SLM is stipulated as an allowable limit in the specification, based on the site conditions and environments. The ratio of gap slump over the allowable slump limit is transformed from the raw data.
● Congestion (CNG) evaluates whether enough area is secured for paving work; it is valued 0 if there is no congestion, and 1 if there is a congestion. In addition, the CNG is transformed into another data;
Congestion times Paving Amount (CNGAMNT).
● Paver age (PVR) and use of spreader (SPR) are also considerable factors for impacting on pavement constructability and productivity. A spreader is used to assure better roughness index of pavement and assist to the decrease of the work-load of concrete slip form paver. It also is valued 0 if there is no use (N) and 1 if there is a use (Y).
● Longitudinal Slope is one of considerable factors; if the slope is increasing, it is marked as positive (+), otherwise, it is denoted as negative (-) in the raw data. Another transformed data is made to estimate the relationship between the productivity and the longitudinal slope. The productivity is related to the absolute value rather than its natural value. In this paper, both of Slope (SLP) and Absolute Value of Slope2 (ABSSLP2) are used for flexible data analysis.
● Radius of Curvature varies from 0 to infinitive, which indicates a straight lane. As the value of
“Infinitive”can not be calculated, it is transformed into an inverse. The inverse of “Infinitive”can be computed as 0. Another possible transformed data associated with the productivity is the ratio of the paved length over radius of curvature.
Accordingly, the variables for multiple regression analysis are summarized in Table 7.
Multiple regression technique consists of graphic and analytic methods for exploring the relationship between one dependent variable and one or more independent variables. Such a relationship is use to predict the values of the dependent variable, to identify which predictor variable has great impact on the response variable, or to verify hypothesized causal models of the dependent variable.
Prior to analyzing the collected data, it is necessary to detect its normality. Normality test is performed by the null hypothesis that the input data values are a random sample from normal distribution. To accept or reject the null hypothesis is determined by Shapiro-Wilk and Kolmogorov test using the SAS program. If the value of Shapiro-Wilk or Kolmogorov test is less than the desired level (i.e. α=0.05), then the null hypothesis is rejected, and it is concluded that the data do not come from normal distribution. Generally speaking, Shapiro-Wilk (SW) statistic is computed to evaluate the normality of the collected data in the case that sample size is less than or equal to 2000. The SW statistic is the ratio between the best estimator and the usual corrected sum of squares estimator of the variance. This value must be greater than zero and less than one. Seemingly, large SW values lead the rejection of the null hypothesis. This paper accomplishes the normality test through Shapiro-Wilk statistic for selecting independent variables. As presented in Table 8, the factors are tabulated, and their normality
Table 7. Summary of independent variables
is determined by P-value resulted from Shapiro-Wilk values.
As mentioned in the previous, the desired level of rejecting null hypothesis is 0.05. This indicates that the probability that the collected data come from normal distribution is 0.95. Since normality test, the factors for statistic analysis are identified, and they are defined as independent variables, such as PRD, AMNT, CML, PCC, APC, TMP, GTMP, HMD, GSLM, CNG, CNG*AMNT, SPR, PVR, squares for absolute SLP, IR, LNGoR, and AIR.
Data of these variables are used for producing the statistical outputs from the SAS program. The error term in regression model needs to be validated before the set of variables is determined. There are a few variable selection methods, such as stepwise, forward selection, and backward elimination procedure. This paper is based upon stepwise procedure to select independent variables.
The operation of the SAS program computes R-square, adjusted R-square, and C(p) that indicates a measure of total mean square error for the produced model. The fitted model for full data was derived with 10 variables (CML, PCC, APC, GTMP, SLM, CNG, CNGAMNT, SPR, SLP, and IR); R-square (=0.7438), adjusted R- square(=0.7087), and C(p) (=0.0398).
The correlation between the dependent and the independent variables is detected by t-test, and F-test is undertaken as one visual diagnostic tool for judging the suitability of full data and for least squares analysis
before a model equation is fixed.
As shown in Figure 2, one data set can be considered as a strange point, and its information is presented in Table 9. It is in fact recommended that the variable selection procedure is reworked excluding the abnormal data set for more fitted full model. In this case, residuals, residual normal quantile, and standardized residual value are re- checked to assess the likelihood of an outlier. If absolute value of standardized residual is more than 2 or 3, data set is considered as an outlier. The value of one data set visualized in Figure 2 is 4.897. Without one outlier set, the SAS program re-produced another fitted model with 12 variables; AMNT, CML, PCC, APC, GTMP, SLM, CNG, CNGAMNT, SPR, SLP, IR, and LNGoR. The appropriation of the fitted model is inferred by least square method and t-statistics for more precise analysis.
Table 8. Normality test
Figure 2. Residual of Productivity vs. Residual Normal of Productivity for the full data
Table 9. Information of an outlier data set
4.2 t-test
Since determining the predictor variables, the significance of the independent variables on the dependent is analyzed at the desired level through two- sides t-test. Table 10 presents the t-statistics of each variable. If the probability of rejecting the null hypothesis is greater than 0.025(=α/2), the variable is not significant in the fitted equation. AMNT, CNG, CNGAMNT, SLP, IR, and LNGoR variables make the null hypothesis rejected, and consequently, the best-fitted equation is derived like the following:
As a result, the productivity of the JPCP is significantly dependent upon the CML, PCC, APC, GTMP, SLM, and SPR. In other words, The productivity of the JPCP is impacted by the cumulative paving amount and percentage of completion resulted from learning-curve effect, the difference between the maximum and optimal temperature, the concrete slump based on site condition and environment, and finally, the use of a spreader with concrete slip form paver. On the basis of the presented model, the coefficient value of SLM (=3.362) is relatively high, and one of SPR (=17.735) is great. This indicates that these two variables are significantly important and sensitive to increase the productivity of the JPCP construction.
4.3 F-test
To validate the best-fitted equation, F-statistics is assessed by the tabled F-value (=2.15), which is computed at the desired level. As shown in Table 11, the computed F-value (=34.14) is larger than the tabled value, such that the proposed best-fitted equation is appropriately inferred.
4.4 Model validation
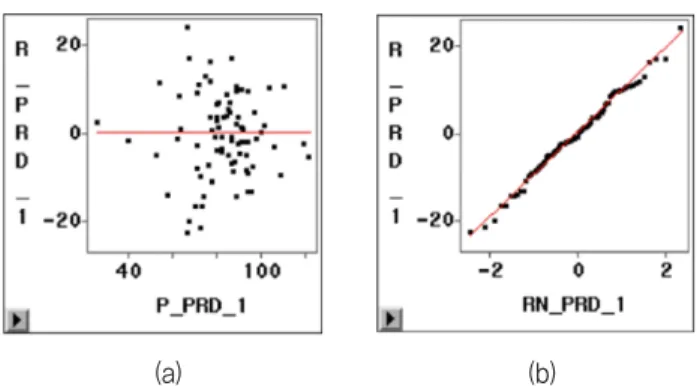
In regression technique, model validation is an important step, which is often conducted by the process consisting of citing the R-square value from the fit. This measures the fraction of total variability in model's response. The R-square describes how well the regression line represent the data, and statistically, the R-square from 0.4 to 0.6 is generally considered moderate correlation, while a value ranging from 0.6 to 0.8 is deemed strong correlation. However, the primary tool of model validation among many statistical tools is graphical residual analysis, i.e., through an assortment of plots of difference between the observed data and the predicted value. This graphical analysis has an advantage over numerical methods for model validation because they readily illustrate a broad range of complex aspects of the relationship between the model and the data. The (a) (b)
Figure 3. (a) Residual plot and (b) Residual of Productivity vs.
Residual Normal of Productivity for the adjusted data
Table 10. Computation of t-statistics
Table 11. Computation of F-statistics
residuals are the differences between the responses observed and the corresponding prediction of the response computed using the regression function.
Examining residuals is a key part of statistical modeling.
Furthermore, residuals can be thought of as elements of variation unexplained by the fitted model. Since this is a form of error, the same general assumptions apply to the group of residuals that is typically used for errors: it should be roughly normal and approximately independently distributed with a mean of 0 and some constant variance. As seen in Figure 3(a), the equation derived for assessing productivity of the JPCP in this paper presents the normally distributed residuals around mean 0 and their circle-shaped scatters. In addition, the distribution of residuals is random, with no definite pattern, and the number of positive residuals is about the same as the number of negative residuals. There are no systematic patterns apparent in the plots. On the basis of Figure 3(a), since the residuals appear to behave randomly, the prediction model developed in this paper is expected to fit the data well. Thus, the model represents the best-fit for the data used in their development.
5. SUMMARY AND CONCLUSIONS
The primary focus of this paper was to develop the model for analyzing the productivity of the Jointed Plane Concrete Pavement (JPCP). To that purpose, multiple regression technique was employed to identify the significant factors impacting on the productivity of the JPCP construction and to analyze their affects. 20 natural and transformed factors were considered, however, after testing their normality and goodness-of- fit of the produced models, 14 factors were excluded because they do not affect, or affect little to the productivity. The outcomes from the SAS program derives a predictive model for concrete paving productivity analysis. The proposed model involves 6 major factors; CML, PCC, APC, GTMP, SLM, and SPR. As mentioned in the previous (Table 3), these factors are classified into a few categories associated with concrete
pavement construction; manpower and labor (SPR), physical elements (SLM), environmental-site conditions (GTMP), and managerial works (CML, PCC, and APC).
Consequently, this paper provides a few important findings in enhancing the productivity of the JPCP construction. Using a spreader in concrete paving work is expected to increase the productivity by decreasing the work-loads of concrete slip form paver. Congestion in the category of work type is concluded to have little impact on the productivity. Concrete Slump, Quantity of Air and Gap % of Slump in physical elements category were taken under considerations. However, this paper presented that only Concrete Slump affect positively to the productivity based upon the proposed predictive model. Longitudinal Slope, 1/Radius of Curvature, Slope2, Length, and Length/Radius in the category of design details were referred to the factors impacting on the productivity.
However, the results from the SAS program indicated that these factors were proved to have little significance in implementing the better productivity. The large difference between the maximum for work-day and the optimal temperature (70℉) influences negatively the productivity. Cumulative Paving Amount and Paving Amount × Percent Completion variables were included in the model. In conclusion, this paper resulted in that improvement of the productivity is significantly dependent upon environmental conditions, learning- curve effects, and management processes of pavement construction.
In this paper, the various factors were investigated for productivity analysis of the JPCP, and data from a few concrete pavement projects were analyzed. The results provide constructors or decision-makers helpful information for effective operation of equipment, material designs, and environmental and management conditions.
Thus, they contribute to establishing flexible construction and management strategy to improve the production capability. However, there is a challenge to explore how appropriately the proposed model represents asphalt
pavement productivity and to assess its capability for the universal applications. In addition, one vital area of future research is of significance to the practitioner for possible employment. That is to substantially refine and improve this model for the use as one of applicable processes.
REFERENCES
1. Crovetti, J.A. and Bischoff, D. (2001) “Construction and Performance of Alternative Concrete Pavement Designs in Wisconsin”, Transportation Research Record, No. 1778, pp. 43-53.
2. Grimm, C.T. and Wagner, N.K. (1974) “Weather effects on mason productivity”, ASCE, Journal of the Construction Division, Vol. 100, pp. 319-335.
3. Lee, D.G. (2005) “Construction factors affecting as- built roughness of Portland cement concrete pavement construction”, Canadian Journal of Civil Engineering, Vol. 32, No. 5, pp. 906-912.
4. Lee, E.B., Ibb, C.W., and Harvey, J.T. (2000) “Part 1 - Portland Cement Concrete Pavement (Construction Productivity and Constraints for Concrete Pavement
Rehabilitation in Urban Corridors)”Transportation Research Record, No. 1712, pp. 13-25.
5. Lee, E.B., Ibb, C.W., and Harvey, J.T. (2002) “Part 5 - Construction Management (Construction Productivity Analysis for Asphalt Concrete Pavement Rehabilitation in Urban Corridors)”Transportation Research Record, No. 1813, pp. 285-294.
6. Packard, R.G. (1994) “Pavement Costs and Quality”, Concrete International: Design & Construction, Vol.
16, No. 8, pp. 36-38.
7. Thomas, H.R. and Sakarcan, A.S. (1994) “Forecasting labor productivity using factor model”, Journal of Construction Engineering and Management, Vol. 120, No. 1, pp. 228-239.
8. Zayed, T., Halpin, D., and Basha, I. (2005)
“Productivity and delays assessment for concrete batch plant-truck mixer operations”, Construction Management and Economics, Vol. 23, No. 8, pp. 839- 850.
논문제출일: 2007.12.04 심사완료일: 2008.07.09