Proliferation, Accumulation of Polyphenols, and Antioxidant Activities of Callus from the ‘Anji Baicha’ Cultivar of Tea [ Camellia sinensis (L.) O. Ktze.]
Mingfei Liu, Junli Wang
*, Birui Tian, Jingjing Huang, Rongrong Zhang, Yuxing Lin, and Zefeng Xiao College of Life and Environmental Sciences, Minzu University of China, Beijing, 100081, People’s Republic of China
*Corresponding author: [email protected]
Tea is one of the most consumed beverages worldwide and the relatively high levels polyphenols is benefit for health. In this study, we developed an efficient system for proliferation of callus from ‘Anji Baicha’, a cultivar of tea ( Camellia sinensis ). Callus tissue was initially induced by culturing leaf explants on medium containing different plant growth regulators. For callus induction, thidiazuron (TDZ) was more effective than 2,4-dichlorophenoxyacetic acid (2,4-D), α-naphthalene acetic acid (NAA), and N
6-benzyladenine (BA). The frequency of callus induction from leaf explants reached 90.21% on 1.0 mg·L
-1TDZ and the developed callus was reddish and friable. We also tested the effect of different concentrations of NAA, 2,4-D, indole 3-acetic acid (IAA), BA, and TDZ, alone and in combinations, on callus proliferation.
Medium supplemented with TDZ in combination with IAA was suitable for callus proliferation and accumulation of tea polyphenols. The growth index value and tea polyphenol content of callus cultured on MS medium containing 0.5 mg·L
-1TDZ and 1.0 mg·L
-1IAA was maximally 1,351% and 23.24%, respectively, and the relative abundance of epicatechin was as high as 17.449%. We also measured the antioxidant activity of all samples and the callus with the highest tea polyphenol content also exhibited high potential radical scavenging activity.
This work was financially supported by National Major Scientific Equipment Program (2012YQ03026108), “111” Project (B08044) and YLDX Project (ydzxxk201619).
The authors declare that there are no conflicts of interest.
HORTICULTURAL SCIENCE and TECHNOLOGY 35(2):252-264, 2017
URL: http://www.kjhst.org pISSN : 1226-8763 eISSN : 2465-8588
This is an Open-Access article distributed under the terms of the Creative Commons Attribution NonCommercial License which permits unrestricted non-commercial use, distribution, and reproduction in any medium, provided the original work is properly cited.
Copyrightⓒ2017 Korean Society for Horticultural Science.
OPEN ACCESS Received:
Revised:
Accepted:
May 31. 2016 September 15. 2016 October 6. 2016
Abstract
Additional key words: Anji Baicha, Plant growth regulators, Callus proliferation, Tea polyphenols, Antioxidant activity
MS Murashige and Skoog BA N
6-Benzyladenine
2,4-D 2,4-Dicholorophenoxyacetic acid IAA Indole-3-acetic acid
TDZ Thidiazuron
NAA α-Naphthalene acetic acid KT Kinetin
Abbreviations Used
Introduction
Free radicals play an important role in aging , cardiovascular diseases , cancer , impaired immune system , and inflammatory diseases ( Finkel and Holbrook , 2000 ; Wu and Hansen , 2008 ; Hsouna et al ., 2011 ). Antioxidants can scavenge free radicals by hydrogen donation before those free radicals can attack cellular components ( Erkana et al ., 2011 ). Many natural phytochemicals extracted from plants exhibit important biological activities and have tremendous advantages for human health , particularly in protecting against chronic degenerative diseases , such as cardiovascular disease , diabetes mellitus and cancer ( Mehta et al ., 2010 ; Rai et al ., 2010 ; Kirby and Schmidt , 1997 ).
Tea is one of the most consumed beverages worldwide and most commercial teas come from dried leaves of a shrub , Camellia sinensis ( L .) O . Ktze ., belonging to the Theaceae family , native to south and southeastern Asia . The health benefits associated with tea have been attributed , in part , to tea ’ s relatively high levels of flavonoids and other polyphenols . A number of polyphenolic compounds belonging to the flavan - 3 - ol ( catechin ) family have a wide spectrum of biological activities , such as antioxidant , antiviral , anticancer , antibacterial and antifungal activities ( Almajano et al ., 2008 ; Fassina et al ., 2002 ). The mechanisms for the health benefits of tea include scavenging of reactive oxygen species ( ROS ), modifying signal transduction pathways , cell cycle checkpoints , and apoptosis , and inducing various enzyme activities ( Yang et al ., 2009 ). A wide interest in these compounds results from their multidirectional biological activity and associated health benefits , particularly related to cancer chemoprevention .
In addition to acting as antioxidants , polyphenols display a wide variety of biological function including induction of apoptosis , growth arrest , inhibition of DNA synthesis , and modulation of signal transduction pathways . They can interfere with initiation , promotion , and progression of carcinogenesis to prevent cancer development by modulating HPV - driven tumorigenesis . By acting at specific steps of the viral transformation cascade , polyphenols can selectively inhibit tumor cell growth and may be a promising therapeutic tool for treatment of cervical cancer ( Di Domenico et al ., 2012 ).
Tea leaves contain various polyphenols and other antioxidants that can affect human health . White tea has antioxidant and anti - proliferative effects against cancer cells , and also protects normal cells against DNA damage . White tea extracts inhibited the proliferation of colorectal cancer cell line , HT - 29 cells with an IC
50of 87 μg · mL
-1by 3 -[ 4 , 5 - dimethylthiazol - 2 - yl ]- 2 , 5 - diphenyl tetrazoliumbromide ( MTT ) assay . The extract protected cultured 3T3 - L1 cells against H
2O
2- induced DNA damage detected using the comet assay ( Hajiaghaalipour et al ., 2015 ). The effect of green tea polyphenols on the intracellular Aβ - induced toxicity to cultured rat primary prefrontal cortical neurons has been reported ; administration of 100 nM , 1 μM or 10 μM of green tea polyphenols significantly inhibited iAβ - induced toxicity on cultured rat primary prefrontal cortical neurons tested by MTT and lactate dehydrogenase ( LDH ) release assays ( Qin et al ., 2012 ).
Interest in polyphenols as potential therapeutic agents has boosted research to establish biotechnological methods for their production based on in vitro plant cell cultures . The induction of haploid callus with significant antioxidant activity from unpollinated ovary cultures of tea has been reported ( Hazarika and Chaturvedi , 2013 ). For production of polyphenols , the objective of the present work was to develop an efficient protocol for in vitro callus proliferation for the ‘ Anji Baicha ’ cultivar of tea (Camellia sinensis) and examine the influence of plant growth regulators , on callus biomass and tea polyphenol accumulation . To our knowledge , this is the first report on phytohormonal regulation of tea callus growth and polyphenol accumulation for
‘ Anji Baicha ’.
Materials and Methods Plant Materials
Cultivated plants of ‘ Anji Baicha ’ (Camellia sinensis), collected from Guizhou , China , were used as starting materials in this study .
Sample Preparation
Leaves of greenhouse - grown ‘ Anji Baicha ’, detached from mother plants , were thoroughly washed with tap water for 1 h , surface - disinfested with 75 % alcohol for 30 s , 0 . 1 % ( w / v ) mercuric chloride solution ( HgCl
2) for 7 - 8 min , and then rinsed 4 - 5 times with sterile deionized water . They were sectioned into explants of approximately 0 . 5 cm × 0 . 5 cm in size . Five explants were aseptically cultured in a 100 mL Erlenmeyer flask containing 30 mL of MS ( Murashige and Skoog , 1962 ) medium supplemented with different concentrations of plant growth regulators .
Plant Growth Regulators and Culture Conditions
For callus induction , leaf explants were cultured on semisolid MS medium supplemented with 2 , 4 - D , NAA , BA , KT or TDZ at 0 , 0 . 5 , 1 . 0 , 2 . 0 , 4 . 0 mg · L
-1. Cultures were incubated under a 16 - h photoperiod ( 30 - 40 μmol · m
-2· s
-1) at 25 - 26ºC . The frequency of callus formation was recorded after 35 days of culture . Experiments were repeated thrice , each with 50 explants per treatment . For callus proliferation , effects of various concentrations of NAA , 2 , 4 - D , IAA , BA , and TDZ ( 0 . 5 , 1 . 0 , 2 . 0 , and 4 . 0 mg · L
-1), alone , and in combinations of BA + 2 , 4 - D , BA + NAA , BA + IAA , TDZ + 2 , 4 - D , TDZ + NAA , and TDZ + IAA were tested .
Callus was incubated in Erlenmeyer flasks with a total of 10 replicates per treatment . Calli from all treatments were harvested after 50 days of culture and their fresh weights measured . Growth indices were calculated as follows ( Kokotkiewicz et al ., 2014 ):
Gi = [( G1 - G0 )/ G0 ] × 100
Where Gi is the growth index , G1 is the callus fresh weight at the end of a culture period and G0 is the fresh weight of the inoculum .
All media were adjusted to pH 5 . 8 with 1 M NaOH ; sucrose ( 30 g · L
-1) and agar ( 7 g · L
-1; Sigma - Aldrich , St Louis , USA ) were added before autoclaving at 121ºC for 20 min .
Quantitative Analysis of Tea Polyphenols
For quantitative analyses of tea polyphenols , 0 . 2 g of powdered plant tissue was first mixed with 5 ml 70 % methanol and
extracted twice in a water bath for 10 minutes at 70ºC , centrifuged for 10 minutes ( 3 , 500 rpm ) at room temperature . The
supernatant was used for polyphenol analysis . Polyphenol content was determined according to the Folin – Ciocalteau method
( Gursoy et al ., 2009 ; Liu et al ., 2013 ) with minor modification . 1 mL of sample was mixed with 5 mL of Folin – Ciocalteau reagent
( 10 %, w / v ). Two minutes later , 4 mL of NaCO
3( 7 . 5 %, w / v ) was added and the mixture incubated at room temperature for 60
minutes . Absorbance was measured with a UV Spectrophotometer U - 2800 ( Hitachi High - Technologies Corporation , Tokyo ,
Japan ) at 765 nm .
Sample Extraction
The milled callus or leaf tissue ( 10 g ) was extracted twice with 250 mL of 95 % ethanol each time ( 12 h ) at room temperature . The extract was decanted , filtered , and concentrated in a rotary evaporator . The crude extract was used for GC - MS analyses and measurements of radical scavenging activity .
GC-MS Analyses
Gas chromatography coupled to mass spectrometry ( GC – MS ) analyses were carried out using an AGILENT 5975 / 19091Z - 433 instrument equipped with HP - 35 ms ( 30 . 0 m × 0 . 25 mm × 0 . 25 µm ). Helium was used as the carrier gas at a flow rate of 1 mL / min . The oven temperature was raised from 80 to 280ºC at a rate of 10ºC / min . The MS detector was used in the electron impact ionization ( EI ) mode with an ionization voltage of 70 eV , using a total sweep of spectra from 20 to 800 m / z . Compounds were identified by comparing their mass spectral fragmentation and retention time to reference compound spectra from the NIST 05 database . Semi - quantitative data were obtained from relative peak area percentages .
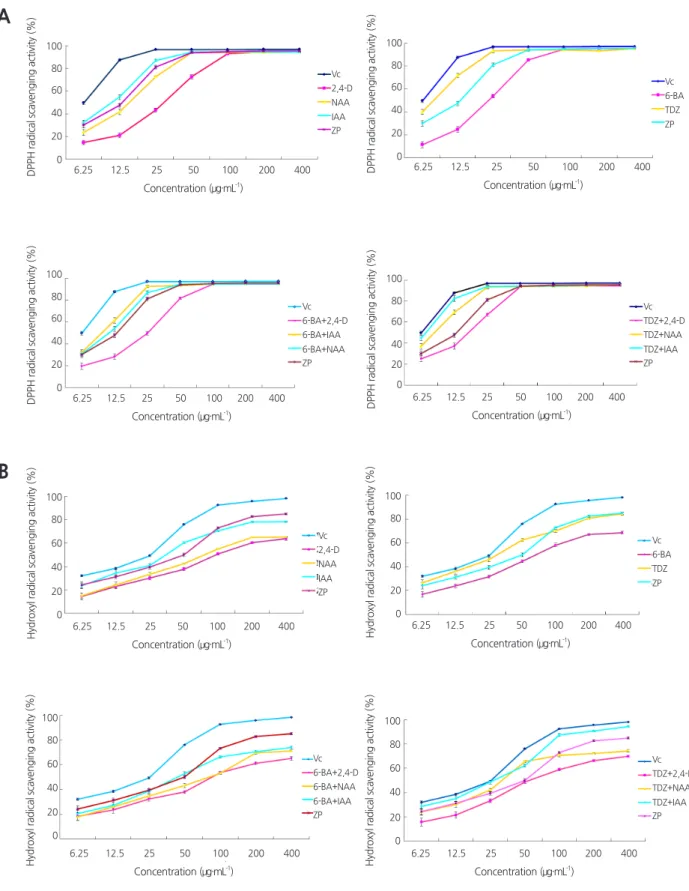
DPPH Radical Scavenging Ability Assay
Radical scavenging activities of samples were determined using 2 , 2 - diphenyl - 1 - picrylhydrazyl ( DPPH ) ( Sigma – Aldrich , St . Louis , USA ) radical as a reagent , according to the methods of Kirby and Schmidt ( 1997 ). Ascorbic acid ( Beijing Chemical Works , Beijing , China ) was used as a positive control . Each sample ( 100 µL ) was mixed with 100 µL of 60 µM DPPH ( prepared with ethanol ), followed by incubation for 40 min . Absorbance was measured at 517 nm . The inhibition of DPPH radical - scavenging activity of each sample was calculated according to the following equation :
Scavenging activity of DPPH (%) = [( Ac - At ) / Ac ] × 100
Where Ac is the absorbance of the control reaction , and At is the absorbance of the test sample . All samples were analyzed in triplicate .
Hydroxyl Radical Scavenging Activity Assay
The hydroxyl (
•OH ) radical - scavenging activity was assayed according to the Fenton method ( Wu and Hansen , 2008 ). Briefly , each sample ( 75 μL ) was incubated with a mixture of 15 μL of FeSO
4· 7 H
2O ( 9 mM ), 15 μL of hydroxybenzoic acid – ethanol solution ( 9 mM ) and 15 μL of H
2O
2( 8 . 89 mM ) in a 37 ° C water bath for 30 min ( Liu et al ., 2013 ). The absorbance was measured at 510 nm . The inhibition of
•OH radical - scavenging activity of each sample was calculated according to the equation :
Scavenging activity of
•OH (%) = [( Ac - At ) / Ac ] × 100
Where Ac is the absorbance of the control reaction and At is the absorbance of the test sample . All samples were analyzed in triplicate .
ABTS Radical Scavenging Activity Assay
The 2 , 2 ′- azinobis ( 3 - ethyl - benzothiazoline - 6 - sulphonic acid ) ( ABTS ) assay was carried out as described by Gursoy et al . ( 2009 ). The ABTS solution was produced by mixing ABTS and K
2S
2O
8, to final concentrations of 7 and 2 . 45 mM , respectively , and stored at room temperature for 12 - 16 h in the dark before using . The solution was diluted until the absorbance was 0 . 70
± 0 . 02 at 734 nm . For the assay , 150 μL of the diluted ABTS solution was mixed with 50 μL of sample solution at various
concentrations . After storage at room temperature for 30 min , absorbance was measured at 734 nm . The inhibition percentage of ABTS radical was calculated according to the following equation :
Scavenging activity of ABTS (%) = [( Ac - At ) / Ac ] × 100
Where Ac is the absorbance of the control reaction , and At is the absorbance of the test sample . All samples were analyzed in triplicate .
All experimental data were statistically analyzed by one - way analysis of variance ( ANOVA ) followed by mean separation using Least Significant Difference ( LSD ) test . p < 0 . 05 was considered statistically significant .
Results and Discussion Induction of Callus
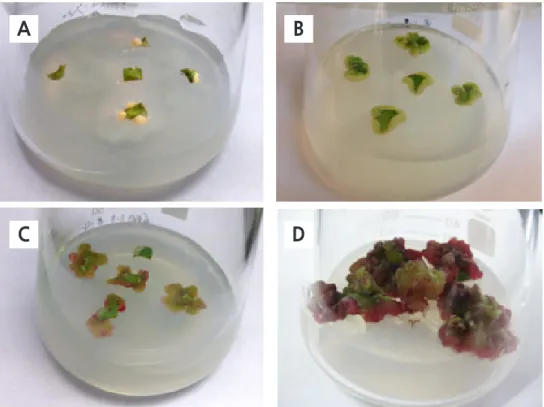
Leaf explants were incubated on semisolid MS medium supplemented with different concentrations of 2 , 4 - D , NAA , BA , or TDZ at 0 , 0 . 5 , 1 . 0 , 2 . 0 , 4 . 0 mg · L
-1alone for callus induction . Yellowish callus tissue developed from the cut margins of explants on MS medium supplemented with 2 , 4 - D or NAA and reddish callus tissue developed on MS medium supplemented with BA or TDZ ( Figure 1 ). Callus induction rate was 45 . 33 %- 75 . 67 % for 2 , 4 - D media , 75 . 33 %- 87 . 00 % for NAA media , 48 . 67 %- 60 . 60 % for BA media , and 55 . 42 %- 90 . 21 % for TDZ media ( data not shown ). TDZ was more effective than 2 , 4 - D , NAA , and BA for callus induction : the frequency of callus induction from leaf explants reached 90 . 21 % when the concentration of TDZ was as high as 1 . 0 mg · L
-1, and the developed calli were reddish and friable .
Fig. 1. Effects of different plant growth regulators on callus induction and phenotype. (A) MS medium supplemented with 2,4- D; (B) MS medium supplemented with NAA; (C) MS medium supplemented with BA; (D) MS medium supplemented with TDZ
A B
C D
Callus Proliferation
We investigated the effects of different concentrations of NAA , 2 , 4 - D , IAA , BA , and TDZ ( 0 . 5 , 1 . 0 , 2 . 0 , 4 . 0 mg · L
-1), alone , and combinations of BA + 2 , 4 - D , BA + NAA , BA + IAA , TDZ + 2 , 4 - D , TDZ + NAA and TDZ + IAA on callus proliferation . The plant growth regulators had a considerable effect on biomass growth in the callus . The effect of 2 , 4 - D , NAA , and BA was less significant than IAA and TDZ . The calli looked greenish and the maximum growth index ( Gi ) values were 596 % for media with 0 . 5 mg · L
-12 , 4 - D , 587 % for 1 . 0 mg · L
-1NAA , and 451 % for 0 . 5 mg · L
-1BA . The effect of IAA was much greater when compared to that of 2 , 4 - D , NAA , or BA : the calli looked light reddish and had a high Gi value , indicating an increase in biomass of 1 , 073 % ( IAA 1 . 0 mg · L
-1). Compared with the effect of 2 , 4 - D , NAA and BA , the effect of TDZ was much more pronounced : the calli looked reddish and the maximum Gi value observed was 1 , 334 % with 1 . 0 mg · L
-1TDZ .
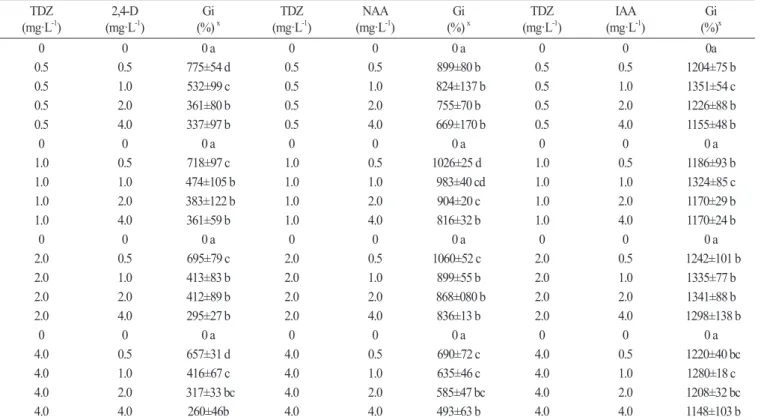
As shown in Table 1 , the effects of combinations of BA + 2 , 4 - D , BA + NAA , BA + IAA and TDZ + 2 , 4 - D on callus proliferation were not significant , and Gi values for callus with these combinations were 286 - 614 %, 576 - 860 %, 467 - 760 % and 260 - 775 %, respectively . When callus was cultured on MS medium supplemented with 1 . 0 - 2 . 0 mg · L
-1TDZ in combination with 0 . 5 mg · L
-1NAA , the Gi values of callus increased to 1 , 026 - 1 , 060 %, much higher than combinations of BA + 2 , 4 - D , BA + NAA , BA + IAA and TDZ + 2 , 4 - D ( Table 2 ). Our observation was consistent with previous studies , which found that the callus fresh weight of Rheum franzenbachii cultured on MS medium containing TDZ and NAA increased significantly ( Wang et al ., 2011 ). Media supplemented with TDZ in combination with IAA were found to be very suitable for callus proliferation , and all Gi values of calli were greater than 1 , 100 %. Gi value of callus tissue cultured on medium containing 0 . 5 mg · L
-1TDZ and 1 . 0 mg · L
-1IAA was as high as 1 , 351 %.
Quantitative Analysis of Tea Polyphenols
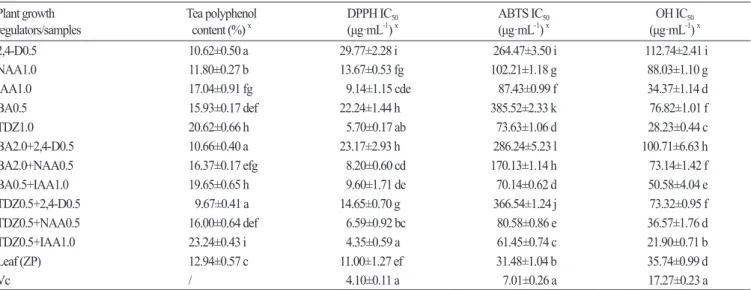
The contents of tea polyphenols in different calli reached 4 . 82 - 23 . 24 %, as compared to 12 . 94 % in leaves of soil - cultivated plants ( Table 3 ). Supplementing with 2 , 4 - D or NAA alone showed no significant accumulation of tea polyphenols in callus as compared with the supplement of BA , IAA or TDZ alone . The contents of tea polyphenols of callus in the treatments with different concentrations of BA , IAA or TDZ alone were 15 . 93 - 20 . 62 %, higher than that in the control group ( 12 . 94 %, p < 0 . 05 ).
Combining NAA + 2 , 4 - D or TDZ + 2 , 4 - D inhibited accumulation of tea polyphenol in callus ( Table 3 ) . The combination of TDZ + IAA was ideal for tea polyphenol accumulation in callus , as seen in Table 3 . A concentration of 0 . 5 mg · L
-1TDZ or 1 . 0 mg · L
-1IAA in the medium enhanced the tea polyphenol contents to a maximum level of 23 . 24 %, which is much higher than the contents in the leaf of the cultivated plants .
Some reports indicate a direct influence of plant growth regulators on the biosynthesis of phenolic secondary metabolites in
plant in vitro cultures ( Szopa et al ., 2013 ; Szopa and Ekiert 2014 ). Plant growth regulators may stimulate or inhibit the production
of active compounds in cultivated biomasses , but this does not always correlate with induction or inhibition of cell growth
( Stalman et al ., 2003 ). As a result , it is sometimes hard to select experimental media providing both satisfactory biomass and
high concentrations of desired compounds . To resolve this problem , two - stage production systems in which independent cell
growth and secondary metabolite biosynthesis phases were used ( Collin 2001 ; Chattopadhyay et al ., 2002 ). In general , our
results did not confirm previous studies regarding the difficulties in identifying callus growth conditions that gave both high
biomass growth and high accumulation of the desired metabolites . MS medium supplemented with 0 . 5 mg · L
-1TDZ and 1 . 0
mg · L
-1IAA induced both intensive biomass growth ( Gi = 1 , 351 %) and high accumulation of tea polyphenols ( 23 . 24 %).
(mg·L BA
-1) 2,4-D
(mg·L
-1) Gi
(%)
xBA
(mg·L
-1) NAA
(mg·L
-1) Gi
(%)
xBA
(mg·L
-1) IAA
(mg·L
-1) Gi (%)
x0 0 0 a 0 0 0 a 0 0 0 a
0.5 0.5 516±75 c 0.5 0.5 801±130 b 0.5 0.5 636±109 b
0.5 1.0 516±45 c 0.5 1.0 764±158 b 0.5 1.0 706±25 b
0.5 2.0 390±35 bc 0.5 2.0 703±189 b 0.5 2.0 706±19 b
0.5 4.0 286±79 b 0.5 4.0 730±106 b 0.5 4.0 682±99 b
0 0 0 a 0 0 0 a 0 0 0 a
1.0 0.5 424±44 bc 1 0.5 860±33 c 1.0 0.5 467±60 b
1.0 1.0 485±86 c 1 1.0 649±47 b 1.0 1.0 517±89 b
1.0 2.0 386±35 bc 1 2.0 613±26 b 1.0 2.0 760±62 c
1.0 4.0 334±22 b 1 4.0 576±28 b 1.0 4.0 724±51 c
0 0 0 a 0 0 0 a 0 0 0 a
2.0 0.5 614±36 c 2 0.5 814±26 b 2.0 0.5 500±84 b
2.0 1.0 478±35 b 2 1.0 790±35 b 2.0 1.0 623±45 b
2.0 2.0 434±40 b 2 2.0 783±58 b 2.0 2.0 743±46 c
2.0 4.0 397±60 b 2 4.0 747±45 b 2.0 4.0 613±64 b
0 0 0 a 0 0 0 a 0 0 0 a
4.0 0.5 487±34 d 4 0.5 702±158 b 4.0 0.5 490±72 b
4.0 1.0 422±45 cd 4 1.0 823±265 b 4.0 1.0 551±49 b
4.0 2.0 327±59 bc 4 2.0 789±111 b 4.0 2.0 611±97 b
4.0 4.0 308±48 b 4 4.0 675±142 b 4.0 4.0 565±24 b
x
Values represent means±SE of 10 replicates. The values with different letters are significantly different ( p < 0.05) using the LSD test.
Table 1. Effect of BA in combinations with different plant growth regulators on callus proliferation
(mg·L TDZ
-1) 2,4-D
(mg·L
-1) Gi
(%)
xTDZ
(mg·L
-1) NAA
(mg·L
-1) Gi
(%)
xTDZ
(mg·L
-1) IAA
(mg·L
-1) Gi (%)
x0 0 0 a 0 0 0 a 0 0 0a
0.5 0.5 775±54 d 0.5 0.5 899±80 b 0.5 0.5 1204±75 b
0.5 1.0 532±99 c 0.5 1.0 824±137 b 0.5 1.0 1351±54 c
0.5 2.0 361±80 b 0.5 2.0 755±70 b 0.5 2.0 1226±88 b
0.5 4.0 337±97 b 0.5 4.0 669±170 b 0.5 4.0 1155±48 b
0 0 0 a 0 0 0 a 0 0 0 a
1.0 0.5 718±97 c 1.0 0.5 1026±25 d 1.0 0.5 1186±93 b
1.0 1.0 474±105 b 1.0 1.0 983±40 cd 1.0 1.0 1324±85 c
1.0 2.0 383±122 b 1.0 2.0 904±20 c 1.0 2.0 1170±29 b
1.0 4.0 361±59 b 1.0 4.0 816±32 b 1.0 4.0 1170±24 b
0 0 0 a 0 0 0 a 0 0 0 a
2.0 0.5 695±79 c 2.0 0.5 1060±52 c 2.0 0.5 1242±101 b
2.0 1.0 413±83 b 2.0 1.0 899±55 b 2.0 1.0 1335±77 b
2.0 2.0 412±89 b 2.0 2.0 868±080 b 2.0 2.0 1341±88 b
2.0 4.0 295±27 b 2.0 4.0 836±13 b 2.0 4.0 1298±138 b
0 0 0 a 0 0 0 a 0 0 0 a
4.0 0.5 657±31 d 4.0 0.5 690±72 c 4.0 0.5 1220±40 bc
4.0 1.0 416±67 c 4.0 1.0 635±46 c 4.0 1.0 1280±18 c
4.0 2.0 317±33 bc 4.0 2.0 585±47 bc 4.0 2.0 1208±32 bc
4.0 4.0 260±46b 4.0 4.0 493±63 b 4.0 4.0 1148±103 b
x
Values represent means±SE of 10 replicates. The values with different letters are significantly different ( p < 0.05) using the LSD test.
Table 2. Effect of TDZ in combinations with different plant growth regulators on callus proliferation
Plant growth
regulators/samples Tea polyphenol
content (%)
xDPPH IC
50(μg·mL
-1)
xABTS IC
50(μg·mL
-1)
xOH IC
50(μg·mL
-1)
x2,4-D0.5 10.62±0.50 a 29.77±2.28 i 264.47±3.50 i 112.74±2.41 i
NAA1.0 11.80±0.27 b 13.67±0.53 fg 102.21±1.18 g 88.03±1.10 g
IAA1.0 17.04±0.91 fg 9.14±1.15 cde 87.43±0.99 f 34.37±1.14 d
BA0.5 15.93±0.17 def 22.24±1.44 h 385.52±2.33 k 76.82±1.01 f
TDZ1.0 20.62±0.66 h 5.70±0.17 ab 73.63±1.06 d 28.23±0.44 c
BA2.0+2,4-D0.5 10.66±0.40 a 23.17±2.93 h 286.24±5.23 l 100.71±6.63 h
BA2.0+NAA0.5 16.37±0.17 efg 8.20±0.60 cd 170.13±1.14 h 73.14±1.42 f
BA0.5+IAA1.0 19.65±0.65 h 9.60±1.71 de 70.14±0.62 d 50.58±4.04 e
TDZ0.5+2,4-D0.5 9.67±0.41 a 14.65±0.70 g 366.54±1.24 j 73.32±0.95 f
TDZ0.5+NAA0.5 16.00±0.64 def 6.59±0.92 bc 80.58±0.86 e 36.57±1.76 d
TDZ0.5+IAA1.0 23.24±0.43 i 4.35±0.59 a 61.45±0.74 c 21.90±0.71 b
Leaf (ZP) 12.94±0.57 c 11.00±1.27 ef 31.48±1.04 b 35.74±0.99 d
Vc / 4.10±0.11 a 7.01±0.26 a 17.27±0.23 a
x
Values represent means±SE of 3 replicates. The values with different letters are significantly different ( p < 0.05) using the LSD test.
Table 3. Tea polyphenol content and IC
50values of different samples
Compounds Relative abundance (%)
1 2 3 4 5 6 7 8 9 10 11 12
Alanine 1.992 1.282 1.593 1.308 1.341 1.749 0.818 1.221 1.902 1.073 2.680 —
Valine 0.701 0.191 0.302 0.246 1.032 0.302 2.081 0.132 0.645 0.960 0.427 —
Isoleucine 0.113 — 0.080 0.070 0.348 0.050 — — 0.366 0.580 0.104 —
Phenylalanine — — — — 0.182 — — — — — 0.112 —
Serine 0.525 0.100 0.176 0.106 0.356 0.170 — 0.060 0.352 1.315 0.212 —
Leucine 0.159 — 0.080 — 0.112 0.167 — — 0.138 0.098 0.084 —
Pyroglutamic acid 0.592 2.051 0.393 0.763 1.403 3.590 0.166 2.063 3.613 3.453 1.853 —
Homoserine — — — — — — — — 0.057 0.181 — —
Threonine 0.236 0.068 0.522 — 0.357 0.197 — 0.037 0.474 0.580 0.265 —
Aspartic acid 0.250 0.132 0.077 — 0.134 — 0.065 0.206 0.254 1.989 0.308 —
Glycine — — — — — — — — 0.108 0.215 — —
Glutamic acid — 0.068 — — — — 0.034 0.130 — 0.786 — —
Glycerol 0.842 0.549 — 0.165 0.480 0.206 — 0.177 0.551 0.172 0.272 0.131
Succinic acid 0.437 0.183 0.103 0.085 0.264 0.267 0.350 0.215 0.403 0.262 0.262 —
2,3-dihydroxy-
Propanoic acid 0.139 0.076 0.216 0.112 0.066 0.137 0.130 0.065 0.146 1.853 0.042 —
Palmitic acid 0.230 0.840 1.090 0.462 0.685 0.332 — 0.676 1.225 0.436 0.318 5.858
Shikimic acid 0.295 1.331 0.057 0.127 1.457 1.320 0.138 2.166 1.767 0.770 2.257 —
4-Aminobutyric acid 4.148 1.627 0.232 — 1.499 0.861 0.050 1.987 1.608 0.480 0.797 —
Stearic acid 0.098 0.270 0.195 — 0.185 0.126 0.418 0.305 0.519 — 0.437 0.172
Linoleic acid 0.320 0.304 0.359 0.099 — 0.127 0.130 — 0.507 7.418 — —
4-Hydroxy-3,5- dimethoxycinnamic
acid — 0.600 1.326 — 0.471 — 1.059 0.509 0.305 — — —
Epicatechin 2.093 2.078 5.079 2.142 5.302 1.244 3.129 4.930 2.670 1.869 17.449 2.895
Tagatose 1.431 1.381 1.181 0.296 1.457 0.134 1.20 1.197 1.770 0.856 1.335 2.597
Sucrose 0.599 54.851 37.906 0.935 23.021 79.572 0.277 57.477 51.942 1.802 57.230 50.798
Glycerin fatty acid ester 65.515 0.150 — — 0.142 — 0.085 — 0.189 — 0.621 —
2-Pyrrolidinone 0.154 0.129 0.147 — — 0.284 0.085 0.275 0.126 0.075 0.145 —
Caffeine — 0.277 — — — — — — — — — 0.375
Grape seed oil — — — — 0.337 — — — — — — —
x