704 www.eymj.org
Erratum to “Stimulating Effect of a Novel Synthesized Sulfonamido-Based Gallate ZXHA-TC on Primary Osteoblasts” by Jin P, et al.
(Yonsei Med J 2015;56(3):760-771.)
Erratum
pISSN: 0513-5796 · eISSN: 1976-2437 Yonsei Med J 2019 Jul;60(7):704-704
https://doi.org/10.3349/ymj.2019.60.7.704
We regret to state that incorrect images were uploaded in Fig. 3F, Fig. 3J, and Fig. 7C. The authors apologize for these errors. Cor- rect images are as follows.
© Copyright: Yonsei University College of Medicine 2019
This is an Open Access article distributed under the terms of the Creative Com- mons Attribution Non-Commercial License (https://creativecommons.org/licenses/
by-nc/4.0) which permits unrestricted non-commercial use, distribution, and repro- duction in any medium, provided the original work is properly cited.
C
Fig. 3. Cell viability was determined by fluorescein diacetate-propidium iodide staining, in which viable cells were stained green and dead cells were stained red. (A-D) Staining of primary osteoblasts treated with ZXHA-TC at concentrations of 0 μg/mL, 6.25×10⁻³ μg/mL, 6.25×10⁻² μg/mL, and 6.25×10⁻¹ μg/mL at 2 days. (E-H) Staining of primary osteoblasts treated with ZXHA-TC at concentrations of 0 μg/mL, 6.25×10⁻³ μg/mL, 6.25×10⁻² μg/mL, and 6.25×10⁻¹ μg/mL at 4 days. (I-L) Staining of primary osteoblasts treated with ZXHA-TC at concentrations of 0 μg/mL, 6.25×10-
3 μg/mL, 6.25×10⁻² μg/mL, and 6.25×10⁻¹ μg/mL at 6 days. (M) Statistical analysis of the data from the staining pictures from A-L (n=3). As time elapsed, more and more dead cells were found in each group. Comparatively, more viable cells were found in the ZXHA-TC–treated groups, which indicated the positive effect on the primary osteoblasts. Scale bar=200 μm.
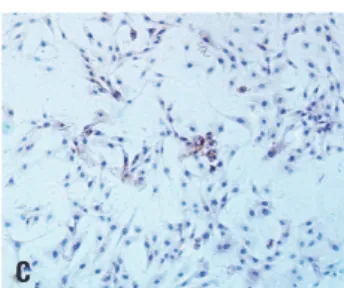
Fig. 7. Time-course of ALP activity and ALP staining of primary osteoblasts at different concentrations (0 μg/mL, 6.25×10⁻³ μg/mL, 6.25×10⁻² μg/
mL, and 6.25×10⁻¹ μg/mL) of ZXHA-TC are exhibited. (A) Relative ALP activity (units/100 mL) was expressed as mean±2 SD, and the activity in 6.25×10⁻² μg/mL was significantly higher than other groups. ALP activity in the ZXHA-TC–treated groups increased from 2 to 4 days and de- creased slightly from 4 to 6 days. However, the activity in the control increased over time. The bars with different letters at the same time are significantly different from each other (p<0.05; n=3), and those with similar letters indicate no significant difference. (B-E) Staining of primary osteoblasts treated with ZXHA-TC at concentrations of 0 μg/mL, 6.25×10⁻³ μg/mL, 6.25×10⁻² μg/mL, and 6.25×10⁻¹ μg/mL at 2 days. (F-I) Staining of primary osteoblasts treated with ZXHA-TC at concentrations of 0 μg/mL, 6.25×10⁻³ μg/mL, 6.25×10⁻² μg/mL, and 6.25×10⁻¹ μg/mL at 4 days. (J- M) Staining of primary osteoblasts treated with ZXHA-TC at concentrations of 0 μg/mL, 6.25×10⁻³ μg/mL, 6.25×10⁻² μg/mL, and 6.25×10⁻¹ μg/mL at 6 days. ALP staining in the ZXHA-TC–treated groups was strengthened from 2 to 4 days and was weakened slightly from 4 to 6 days, and the concentration of 6.25×10⁻² μg/mL performed best, which was in accordance the ALP activity results. Scale bar=200 μm. ALP, alkaline phosphatase.