Abdominal Aortic Calcification is Associated with Diastolic Dysfunction, Mortality, and Nonfatal Cardiovascular Events in Maintenance Hemodialysis Patients
This study evaluated the significance of aortic calcification index (ACI), an estimate of abdominal aortic calcification by plain abdominal computed tomography (CT), in terms of left ventricular (LV) diastolic dysfunction, mortality, and nonfatal cardiovascular (CV) events in chronic hemodialysis patients. Hemodialysis patients who took both an abdominal CT and echocardiography were divided into a low-ACI group (n = 64) and a high-ACI group (n = 64). The high-ACI group was significantly older, had a longer dialysis vintage and higher comorbidity indices, and more patients had a previous history of CV disease than the low-ACI group. The ACI was negatively correlated with LV end-diastolic volume or LV stroke volume, and was positively correlated with the ratio of peak early transmitral flow velocity to peak early diastolic mitral annular velocity (E/E´ ratio), a marker of LV diastolic function. The E/E´ ratio was independently associated with the ACI. The event-free survival rates for mortality and nonfatal CV events were significantly lower in the high-ACI group compared with those in the low-ACI group, and the ACI was an independent predictor for all-cause deaths and nonfatal CV events. In conclusion, ACI is significantly associated with diastolic dysfunction and predicts all-cause mortality and nonfatal CV events in hemodialysis patients.
Key Words: Hemodialysis; Vascular Calcification; Ventricular Dysfunction, Left;
Cardiovascular Diseases Hye Eun Yoon1,2, Sungjin Chung2,
Hyun Chul Whang2, Yu Ri Shin3, Hyeon Seok Hwang2, Hyun Wha Chung1,2, Cheol Whee Park2, Chul Woo Yang2, Yong-Soo Kim2, and Seok Joon Shin1,2
1Division of Nephrology, Department of Internal Medicine, Incheon St. Mary’s Hospital, Departments of 2Internal Medicine and 3Radiology, College of Medicine, The Catholic University of Korea, Incheon, Korea
Received: 27 January 2012 Accepted: 3 May 2012 Address for Correspondence:
Seok Joon Shin, MD
Department of Internal Medicine, Incheon St. Mary’s Hospital, College of Medicine, The Catholic University of Korea, 56 Dongsu-ro, Bupyeong-gu, Incheon 403-720, Korea Tel: +82.32-280-5091, Fax: +82.32-280-5987 E-mail: [email protected]
This study was supported by a grant through the National Research Foundation of Korea (NRF) funded by the Ministry of Education, Science, and Technology, Republic of Korea (20110013312).
http://dx.doi.org/10.3346/jkms.2012.27.8.870 • J Korean Med Sci 2012; 27: 870-875
INTRODUCTION
Cardiovascular (CV) disease is the major cause of death in pa- tients with chronic kidney disease (1). Beyond traditional risk factors, vascular calcification is associated with all-cause mor- tality and CV mortality in end-stage renal disease (ESRD) pa- tients (2). Several noninvasive methods are available to detect and measure the degree of vascular calcification. Plain radiog- raphy is helpful and inexpensive for the identification of vascu- lar calcification (3), but it is a qualitative measure (2). CT is the gold standard for quantifying vascular calcification, and being the most effective and widely available with reproducibility, is also useful for monitoring progression (3). Vascular calcifica- tion in various blood vessels can be accurately assessed using CT, including the coronary artery, femoral artery, and abdomi- nal aorta. However, CT of coronary artery or femoral artery is performed in uncommon circumstances. In contrast, plain ab- domen CT is frequently performed in ESRD patients for various reasons. As the presence of abdominal aortic calfication (AAC) is a marker of both subclinial atherosclerotic disease and arte-
riosclerosis and is also an independent predictor of CV morbit- idy and mortality (4), assessment of the degree of AAC could potentially allow risk stratification and easily provide changes in clinical practice treatment.
Previous reports have demonstrated the association between vascular calcification and cardiac changes in ESRD patients, in- cluding arterial stiffness (5), stroke volume (6), and left ventric- ular (LV) diastolic dysfunction (7). However these reports as- sessed the vascular calfication in common carotid artery, aorta, and femoral artery using CT (6), and aortic arch using reconsti- tuted CT (7). Until now, there are reports about the measure- ment of the AAC using the plain abdomen CT in ESRD patients (8-12), but little is reported about the association between the degree of AAC and echocardiographic measurements. This study evaluated the clinical significance of the degree of AAC, using the aortic calcification index (ACI) measured by plain CT, in terms of cardiac performance, death, and nonfatal CV events in maintenence hemodialysis (HD) patients. The results suggest that the degree of AAC is associated with LV diastolic dysfunc- tion and predicts all-cause mortality and nonfatal CV events.
MATERIALS AND METHODS Study population
One-hundred twenty eight patients who initially started main- tenance HD therapy and who took both an abdominal CT scan and an echocardiography between January 2005 and February 2011 at Incheon St. Mary’s Hospital were included. Patients who changed the renal replacement therapy modality (from HD to peritoneal dialysis or renal transplantation, or from peritoneal dialysis to HD), and patients who had undergone parathyroid- ectomy were excluded. Medical records of these patients were retrospectively reviewed.
Assessment of abdominal aortic calcification
The abdominal aorta was examined on a consecutive, sequen- tial, 8-mm section, noncontrast CT scans, and ACI was calcu- lated as the proportion of aortic circumference covered by cal- cification, as previously described (8, 9). This method was used to morphometrically quantify arteriosclerosis in the crosssec- tion showing the most extensive aortosclerosis. Arithmetic mean values of 3 measurements were calculated and used for analysis.
ACI was independently checked by two observers, and repro- ducibility was absolute for the patients examined. The sequence of the CT scans and their orientation has been standardized, and the quality of scans primarily depended on the hardware used. To optimize reproducibility, all scans in the cross-section- al study were made by the same investigator using the same CT equipment, as previously described. Patients were divided into two groups according to the median ACI value (21.4) in our pop- ulation: low-ACI group (n = 64) and high-ACI group (n = 64).
Clinical data
Differences between the low-ACI group and the high-ACI group were compared including, demographic data and echocardio- graphic measurements at the time of CT scan, and event-free survival rates for all-cause mortality and nonfatal CV events. The Charlson comorbidity index was used to quantify the severity of comorbidity (13). Body mass index (BMI) was calculated by dividing dry weight (kg) by body height (m2). CV events includ- ed coronary heart disease (angina pectoris or myocardial infarc- tion), cerebrovascular disease (transient ischemic attack, cere- bral infarction, or cerebral hemorrhage), peripheral/pulmonary vascular disease, and heart failure. Association between ACI and echocardiographic measurements, and prognostic factors affecting all-cause mortality and nonfatal CV events were also assessed.
Echocardiography
A two-dimensional-guided M-mode echocardiography was per- formed on a non-dialysis day by a cardiologist who was blind to the patient’s clinical and laboratory data. M-mode measure-
ments included left ventricular end-diastolic diameter (LVDd), left ventricular end-systolic diameter (LVDs), left ventricular posterior wall thickenss (PWT), and interventricular septal thick- ness (IVST). Left ventricular mass (LVM) was calculated by means of the Devereux formula and indexed to height2.7 to determine the left ventricular mass index (LVMI), expressed in g/m2.7 (14).
Left ventricular end-diastolic volume (LVEDV), left ventricular end-systolic volume (LVESV), left ventricular stroke volume (LVSV), left ventricular ejection fraction (LVEF), and left atrial diameter (LAD) were determined from apical 2- and 4-cham- ber views by the Simpson’s biplane formulae, based on the rec- ommendations of the American Society of Echocardigraphy (15).
To estimate diastolic function, mitral inflow velocities, and myo- cardial velocities were recorded using pulsed wave Doppler and the tissue Doppler, respectively. From the mitral valve inflow velocity curve using pulsed wave Doppler, peak early diastolic flow velocity (MV-E), peak late diastolic flow velocity (MV-A), a ratio of E wave, and A wave (E/A ratio) were measured (16). From tissue Doppler imaging, septal mitral annular early peak velocity (E´) was measured. A ratio of peak early transmitral flow veloc- ity (E) to peak early diastolic mitral annular velocity (E/E´ ratio), an estimate of LV filling pressure, was calculated (17).
Statistical analysis
Continuous data were presented as mean ± standard deviation (SD) and were compared using Student’s t test. Categorical data were compared using chi-square tests or Fisher’s exact tests.
Pearson’s correlation analysis or Spearman correlation analy- ses determined the correlation between ACI and echocardio- graphic measurements. Univariate and multivariate linear re- gression analyses identified the independent echocardiograph- ic determinants for ACI. Kaplan–Meier curves and log-rank tests were used to describe and compare the event-free survival rates for all-cause mortality and nonfatal CV events. A univariate, fol- lowed by a multivariate Cox regression analysis, identified sig- nificant prognostic factors affecting all-cause mortality and non- fatal CV events. The estimated standard error of the coefficient (β1) established the confidence intervals (CI) of the hazard ratio (HR). A P value of less than 0.05 indicated significance.
Ethics statement
The study was approved by the institutional review board the Catholic University of Korea (OC11RISE0141). As this was a ret- rospective study using medical records, informed consent was exempted by the board.
RESULTS
Patient characteristics
Mean patient age was 64 ± 13 yr (range, 26-91), and mean dial- ysis vintage was 6.3 ± 13.5 months (range, 1-87.5). Seventy-one
patients (55.5%) were male, 79 patients (61.7%) had diabetes, and 35 patients (27.3%) had a previous history of CV disease.
The mean ACI was 22.1 ± 17.5 (range, 0-70). The mean follow- up period was 16.4 ± 18.8 months (range, 1-80).
Table 1 shows the comparison of patient characteristics be- tween the low-ACI group and the high-ACI group. The high-ACI
Table 1. Comparison of patient characteristics
Parameters Low-ACI (n = 64) High-ACI (n = 64) P value
Age 58 ± 13 69 ± 10 < 0.001
Gender, male (%) 37 (57.8) 34 (53.1) 0.59
Dialysis vintage (mo) 3.5 ± 11.9 9.1 ± 14.5 0.02
Diabetes (%) 35 (54.7) 44 (68.8) 0.10
Cause of ESRD (%) Diabetes Hypertension
Chronic glomerulonephritis Others
27 (42.2) 16 (25.0) 6 (9.4) 15 (23.4)
36 (56.3) 12 (18.8) 8 (12.5) 8 (12.5)
0.13
Charlson comorbidity index 4.5 ± 1.7 5.2 ± 1.9 0.03 Body mass index (kg/m2) 24.0 ± 4.7 22.5 ± 3.6 0.08 History of CV disease (%) 11 (17.2) 24 (37.5) 0.01 Follow-up period (mo) 17.9 ± 19.7 15.1 ± 17.9 0.39 ESRD, end-stage renal disease; CV, cardiovascular.
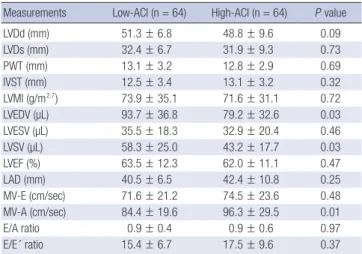
Table 2. Comparison of echocardiographic measurements
Measurements Low-ACI (n = 64) High-ACI (n = 64) P value
LVDd (mm) 51.3 ± 6.8 48.8 ± 9.6 0.09
LVDs (mm) 32.4 ± 6.7 31.9 ± 9.3 0.73
PWT (mm) 13.1 ± 3.2 12.8 ± 2.9 0.69
IVST (mm) 12.5 ± 3.4 13.1 ± 3.2 0.32
LVMI (g/m2.7) 73.9 ± 35.1 71.6 ± 31.1 0.72
LVEDV (µL) 93.7 ± 36.8 79.2 ± 32.6 0.03
LVESV (µL) 35.5 ± 18.3 32.9 ± 20.4 0.46
LVSV (µL) 58.3 ± 25.0 43.2 ± 17.7 0.03
LVEF (%) 63.5 ± 12.3 62.0 ± 11.1 0.47
LAD (mm) 40.5 ± 6.5 42.4 ± 10.8 0.25
MV-E (cm/sec) 71.6 ± 21.2 74.5 ± 23.6 0.48
MV-A (cm/sec) 84.4 ± 19.6 96.3 ± 29.5 0.01
E/A ratio 0.9 ± 0.4 0.9 ± 0.6 0.97
E/E´ ratio 15.4 ± 6.7 17.5 ± 9.6 0.37
LVDd, left ventricular end-diastolic diameter; LVDs, left ventricular end-systolic diam- eter; PWT, left ventricular posterior wall thickness; IVST, interventricular septal thick- ness; LVMI, left ventricular mass index; LVEDV, left ventricular end-diastolic volume;
LVESV, left ventricular end-systolic volume; LVEF, left ventricular ejection fraction; LAD, left atrial diameter; LVSV, left ventricular stroke volume; MV-E, mitral valve peak early diastolic flow velocity; MV-A, mitral valve peak late diastolic flow velocity; E/A ratio, ratio of E wave (peak early diastolic flow velocity) and A wave (peak late diastolic flow velocity); E/E´ ratio, a ratio of peak early transmitral flow velocity (E) to peak early dia- stolic mitral annular velocity (E´).
Fig. 1. Correlation between the aortic calcification index (ACI) and left ventricular diastolic dysfunction. The ACI showed negative correlations with left ventricular end-diastolic volume (LVEDV, A) and left ventricular stroke volume (LVSV, B). The ACI showed positive correlations with mitral valve peak late diastolic flow velocity (MV-A, C) and a ratio of peak early transmitral flow velocity (E) to peak early diastolic mitral annular velocity (E´) (E/E´ ratio, D).
LVEDV (µL) LVSV (µL)
ACI ACI
r = -0.234, P = 0.01 r = -0.290, P = 0.002
0 10 20 30 40 50 60 70 0 10 20 30 40 50 60 70
300
250
200
150
100
50
0
200
150
100
50
0
A B
MV-A (cm/sec) E/E´ ratio
ACI ACI
r = 0.279, P = 0.003 r = 0.238, P = 0.01
0 10 20 30 40 50 60 70 0 10 20 30 40 50 60 70
250
200
150
100
50
0
60
50
40
30
20
10
0
C D
group was significantly older, had a longer dialysis vintage, and higher Charlson comorbidity indices, and more patients had a previous history of CV disease than the low-ACI group.
Echocardiographic measurements
Table 2 shows the comparison of echocardiographic measure- ments between the low-ACI group and the high-ACI group. The high-ACI group had a significantly lower LVEDV and LVSV, and higher MV-A compared with the low-ACI group. There was no significant difference in other echocardiographic measurements between the two groups.
Fig. 1 shows the significant correlations between the ACI and echocardiographic measurements. The ACI was negatively cor- related with LVEDV (A) or LVSV (B), and positively correlated with MV-A (C) or E/E´ ratio (D). From the univariate linear re-
gression analysis, LVEDV, LVSV, and E/E´ ratio showed signifi- cant associations with ACI. In the multivariate regression analy- sis, only the E/E´ ratio was independently associated with ACI (Table 3).
All-cause mortality and nonfatal CV events
A total of 28 deaths were noted during follow-up. Twelve deaths (42.9%) were due to fatal CV events, and 16 deaths (57.1%) were due to non-CV causes. CV-related deaths included heart failure (n = 4, 33.3%), coronary heart disease (n = 3, 25%), cerebrovas- cular disease (n = 3, 25%), and peripheral/pulmonary vascular disease (n = 2, 16.7%). Non-CV-related deaths included infec- tion (n = 13, 81.3%), malignancy (n = 2, 12.5%), and gastrointes- tinal bleeding (n = 1, 6.3%). Nine nonfatal CV events were not- ed, including coronary heart disease (n = 4, 50%), cerebrovas- cular disease (n = 3, 37.5%), and peripheral/pulmonary vascu- lar disease (n = 1, 12.5%).
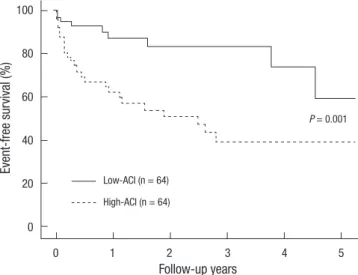
Kaplan-Meier analysis showed that the 5 yr-event-free sur- vival rates for all-cause deaths and nonfatal CV events were sig- nificantly lower in the high-ACI group compared with those in the low-ACI group (39.4% vs 59.5%, P = 0.001; Fig. 2). From the univariate Cox regression analysis, age, dialysis vintage, and ACI showed statistical significance for all-cause deaths and nonfatal CV events. In the multivariate analysis, age (HR 1.045, CI 1.010- 1.082), dialysis vintage (HR 1.027, CI 1.004-1.050), and ACI (HR 1.032, CI 1.011-1.053) were the significant prognostic factors (Table 4).
DISCUSSION
The results clearly demonstrate that ACI is significantly associ- ated with LV diastolic dysfunction and predicts all-cause mor- tality and nonfatal CV events in maintenance HD patients. Al-
Table 4. Cox regression analysis of predictors for all-cause mortality and nonfatal cardiovascular event
Variables Univariate analysis Multivariate analysis
HR P HR P
Age (/1 yr) 1.052 0.001 1.045 0.01
Male (vs female) 0.987 0.97 - -
Diabetes 0.777 0.45 - -
Hemodialysis vintage (/1 mo) 1.022 0.03 1.027 0.02
Charlson comorbidity index 1.069 0.42 - -
Body mass index (/1 kg/m2) 0.967 0.58 - -
LVEF (/1%) 0.981 0.15 - -
LVSV (/1 µL) 0.984 0.08 - -
E/A ratio 1.032 0.93 - -
E/E´ ratio 1.037 0.07 - -
ACI 1.039 < 0.001 1.032 0.003
LVEF, left ventricular ejection fraction; LVSV, left ventricular stroke volume; E/A ratio, ratio of E wave (peak early diastolic flow velocity) and A wave (peak late diastolic flow velocity); E/E´ ratio, a ratio of peak early transmitral flow velocity (E) to peak early dia- stolic mitral annular velocity (E´); ACI, aortic calcification index.
Table 3. Linear regression analysis of echocardiographic predictors for aortic calcifi- cation index
Echocardiographic findings
Univariate analysis Multivariate analysis
r P β-coefficient P
LVMI (g/m2.7) 0.004 0.95 - -
LVEDV (µL) -0.117 0.01 0.007 0.94
LVESV (µL) -0.092 0.29 - -
LVSV (µL) -0.229 0.002 -0.264 0.09
LVEF (%) -0.071 0.60 - -
E/A ratio -3.069 0.39 - -
E/E´ ratio 0.526 0.01 0.527 0.03
LVMI, left ventricular mass index; LVEDV, left ventricular end-diastolic volume; LVESV, left ventricular end-systolic volume; LVEF, left ventricular ejection fraction; LAD, left atrial diameter; LVSV, left ventricular stroke volume; MV-E, mitral valve peak early dia- stolic flow velocity; MV-A, mitral valve peak late diastolic flow velocity; E/A ratio, ratio of E wave (peak early diastolic flow velocity) and A wave (peak late diastolic flow veloc- ity); E/E´ ratio, a ratio of peak early transmitral flow velocity (E) to peak early diastolic mitral annular velocity (E´).
Event-free survival (%)
Follow-up years
0 1 2 3 4 5
100
80
60
40
20
0
Fig. 2. Comparison of event-free survival rates for all-cause mortality and nonfatal cardiovascular (CV) events between the low-aortic calcification index (ACI) group and the high-ACI group. Note that the event-free survival rates for the high-ACI group were significantly lower than the low-ACI group at 5 yr (P = 0.001).
Low-ACI (n = 64)
P = 0.001
High-ACI (n = 64)
though there are reports about the measurement of the AAC using the plain abdomen CT in ESRD patients (8-12), little is re- ported about the association between the degree of AAC and echocardiographic measurements. Moreover, previous reports about the association between vascular calcification and cardi- ac changes focused on calcification in common carotid artery, aorta, and femoral artery (6). In addition to screening for abdom- inal cancer, plain abdomen CT is known as the gold standard for quantification of vascular calcification in maintenance HD patients (3). It does not require a special equipment and is avail- able at small centers, and ACI can be easily measured by inspect- ing multiple aortic slices above the aortic bifurcation (8). There- fore, ACI can be easily used for risk assessment of all-cause mor- tality and nonfatal CV events, as well as assessment of LV dia- stolic dysfunction.
Various risk factors have been implicated in the development of vascular calcification, such as age, dialysis vintage, race, dia- betes, serum calcium and phosphorus levels, lipid levels, and inflammatory markers (2, 18-20). This study also showed that the high-ACI group were significantly older, and had a longer dialysis vintage compared with the low-ACI group. In addition, more patients in the high-ACI group had a previous history of CV disease at the time of CT scan compared with the low-ACI group. This finding is consistent with a previous report which showed that a previous history of CV disease was an indepen- dent predictor for vascular calcification (21).
Until now, little has been reported about the association be- tween the degree of AAC and cardiac performance. In this study, the ACI showed positive correlation with E/E´ ratio. The E/E´
ratio is an accurate estimate of LV filling pressure and a reliable marker of LV diastolic dysfunction in ESRD patients (22). This suggest that ACI is associated with increased LV filling pressure.
Our results also showed that there were negative correlations between ACI and LVEDV or LVSV and a significant difference in LVEDV or LVSV between the low-ACI group and the high-ACI group. Increased filling pressure results from increased LV dia- stolic stiffness and accompanies limited diastolic filling, reduced LVEDV, and consequently reduced LVSV (23). Therefore, our results suggest that ACI is associated with LV diastolic stiffness and limited diastoilc filling. In addition, only the E/E´ ratio was independently associated with ACI in the multivariate regres- sion analysis. Taken together, we can conclude that ACI is inde- pendently associated with LV diastolic dysfunction.
It is well known that LV hypertrophy and systolic dysfunction, represented by LVMI and LVEF, are highly prevalent and are es- tablished predictors of all-cause mortality and CV mortality in ESRD patients (24). In this study, LVMI and LVEF were not sig- nificantly correlated with ACI. In contrast, there was a correla- tion betweeen the ACI and E/E´ ratio. This may be because ap- proximately 80% of the patients had a dialysis vintage less than 12 months, which is a relatively short period compared with
other reports (7-12). As previously established, LV diastolic dys- function usually precedes systolic dysfunction (25). Therefore, these results suggest that AAC may precede LV systolic dysfunc- tion and accompany LV diastolic dysfunction in patients with a relatively short dialysis vintage.
This study showed a significant difference in the MV-A value between the low-ACI and high-ACI groups and a positive cor- relation of the MV-A with ACI. However, the E/A ratio did not significantly correlate with ACI. We believe there are two rea- sons for the discrepant results. First, about 51% of the patients had an E/A ratio less than 0.75, which is shown in mild diastolic dysfunction or impaired relaxation (16). Second, although the E/A ratio is a traditional marker of LV diastolic pressure, it is loaded dependent and is less predictive of LV filling pressure in ESRD patients, in whom the fluid status varies between dialysis sessions (26).
In this study, the ACI was an independent predictor for event- free survival rates of all-cause mortality and nonfatal CV events.
There are several possible reasons. First, the greater intimal cal- cification may induce a greater degree of generalized athereo- sclerosis and a greater rate of occlusive lesions (27). Second, the greater medial calcification may increase arterial stiffness (5, 7, 18) and cause greater mortality and CV events. Third, the asso- ciation between the AAC and LV diastolic dysfunction could be an alternative mechanism. Our data showed a significant asso- ciation between the ACI and E/E´ ratio, and the E/E´ ratio was shown to have independent prognostic values for mortality and CV mortality in ESRD patients (28). Therefore, the greater AAC may cause LV diastolic dysfunction and contribute to greater mortality and nonfatal CV events.
This study has several limitations. First, it was retrospective, and therefore the treatment was not standardized between the two groups. Second, it has a limitation stemming from its small sample size. Futher studies are needed with a larger population and more classified groups. Third, the drug effects on clinical outcomes were not assessed. Finally, the follow-up period of this study was relatively shorter than previous studies. This may be the reason why there was no significant difference in fatal CV mortality between the two groups.
In conclusion, the present study demonstrates that the ACI is significantly associated with LV diastolic dysfunction and pre- dicts all-cause mortality and nonfatal CV events in maintenance HD patients. The ACI, as a measure of the degree of AAC, can be easily used as a risk assessment for all-cause mortality and nonfatal CV events, and as an estimate of LV diastolic dysfunc- tion in clinical practice.
REFERENCES
1. Foley RN, Murray AM, Li S, Herzog CA, McBean AM, Eggers PW, Col- lins AJ. Chronic kidney disease and the risk for cardiovascular disease,
renal replacement, and death in the United States Medicare population, 1998 to 1999. J Am Soc Nephrol 2005; 16: 489-95.
2. London GM, Guerin AP, Marchais SJ, Metivier F, Pannier B, Adda H. Ar- terial media calcification in end-stage renal disease: impact on all-cause and cardiovascular mortality. Nephrol Dial Transplant 2003; 18: 1731-40.
3. Raggi P, Bellasi A. Clinical assessment of vascular calcification. Adv Chronic Kidney Dis 2007; 14: 37-43.
4. Witteman JC, Kok FJ, van Saase JL, Valkenburg HA. Aortic calcification as a predictor of cardiovascular mortality. Lancet 1986; 2: 1120-2.
5. Raggi P, Bellasi A, Ferramosca E, Islam T, Muntner P, Block GA. Associa- tion of pulse wave velocity with vascular and valvular calcification in hemodialysis patients. Kidney Int 2007; 71: 802-7.
6. Sigrist M, Bungay P, Taal MW, McIntyre CW. Vascular calcification and cardiovascular function in chronic kidney disease. Nephrol Dial Trans- plant 2006; 21: 707-14.
7. Fujiu A, Ogawa T, Matsuda N, Ando Y, Nitta K. Aortic arch calcification and arterial stiffness are independent factors for diastolic left ventricular dysfunction in chronic hemodialysis patients. Circ J 2008; 72: 1768-72.
8. Kabaya T, Nitta K, Kimura H, Kawashima A, Narusawa K, Nihei H. In- creased aortic calcification index in hemodialysis patients. Nephron 1999; 81: 354-5.
9. Nitta K, Akiba T, Uchida K, Kawashima A, Yumura W, Kabaya T, Nihei H.
The progression of vascular calcification and serum osteoprotegerin levels in patients on long-term hemodialysis. Am J Kidney Dis 2003; 42: 303-9.
10. Nitta K, Akiba T, Uchida K, Otsubo S, Otsubo Y, Takei T, Ogawa T, Yumu- ra W, Kabaya T, Nihei H. Left ventricular hypertrophy is associated with arterial stiffness and vascular calcification in hemodialysis patients. Hy- pertens Res 2004; 27: 47-52.
11. Takei T, Otsubo S, Uchida K, Matsugami K, Mimuro T, Kabaya T, Akiba T, Nitta K. Effects of sevelamer on the progression of vascular calcification in patients on chronic haemodialysis. Nephron Clin Pract 2008; 108:
c278-83.
12. Taniwaki H, Ishimura E, Tabata T, Tsujimoto Y, Shioi A, Shoji T, Inaba M, Inoue T, Nishizawa Y. Aortic calcification in haemodialysis patients with diabetes mellitus. Nephrol Dial Transplant 2005; 20: 2472-8.
13. Charlson ME, Pompei P, Ales KL, MacKenzie CR. A new method of clas- sifying prognostic comorbidity in longitudinal studies: development and validation. J Chronic Dis 1987; 40: 373-83.
14. de Simone G, Devereux RB, Roman MJ, Alderman MH, Laragh JH. Re- lation of obesity and gender to left ventricular hypertrophy in normoten- sive and hypertensive adults. Hypertension 1994; 23: 600-6.
15. Schiller NB, Shah PM, Crawford M, DeMaria A, Devereux R, Feigen- baum H, Gutgesell H, Reichek N, Sahn D, Schnittger I, et al. Recommen- dations for quantitation of the left ventricle by two-dimensional echocar- diography. American Society of Echocardiography Committee on Stan- dards, Subcommittee on Quantitation of Two-Dimensional Echocardio- grams. J Am Soc Echocardiogr 1989; 2: 358-67.
16. Rakowski H, Appleton C, Chan KL, Dumesnil JG, Honos G, Jue J, Koil-
pillai C, Lepage S, Martin RP, Mercier LA, et al. Canadian consensus recommendations for the measurement and reporting of diastolic dys- function by echocardiography: from the investigators of consensus on di- astolic dysfunction by echocardiography. J Am Soc Echocardiogr 1996; 9:
736-60.
17. Nagueh SF, Middleton KJ, Kopelen HA, Zoghbi WA, Quinones MA.
Doppler tissue imaging: a noninvasive technique for evaluation of left ventricular relaxation and estimation of filling pressures. J Am Coll Car- diol 1997; 30: 1527-33.
18. Guerin AP, London GM, Marchais SJ, Metivier F. Arterial stiffening and vascular calcifications in end-stage renal disease. Nephrol Dial Trans- plant 2000; 15: 1014-21.
19. Shoji T, Nishizawa Y, Kawagishi T, Kawasaki K, Taniwaki H, Tabata T, Inoue T, Morii H. Intermediate-density lipoprotein as an independent risk factor for aortic atherosclerosis in hemodialysis patients. J Am Soc Nephrol 1998; 9: 1277-84.
20. Chertow GM, Raggi P, Chasan-Taber S, Bommer J, Holzer H, Burke SK.
Determinants of progressive vascular calcification in haemodialysis pa- tients. Nephrol Dial Transplant 2004; 19: 1489-96.
21. Honkanen E, Kauppila L, Wikstrom B, Rensma PL, Krzesinski JM, Aas- arod K, Verbeke F, Jensen PB, Mattelaer P, Volck B. Abdominal aortic calcification in dialysis patients: results of the cord study. Nephrol Dial Transplant 2008; 23: 4009-15.
22. Sharma R, Pellerin D, Gaze DC, Mehta RL, Gregson H, Streather CP, Collinson PO, Brecker SJ. Mitral peak doppler e-wave to peak mitral an- nulus velocity ratio is an accurate estimate of left ventricular filling pres- sure and predicts mortality in end-stage renal disease. J Am Soc Echo- cardiogr 2006; 19: 266-73.
23. Westermann D, Kasner M, Steendijk P, Spillmann F, Riad A, Weitmann K, Hoffmann W, Poller W, Pauschinger M, Schultheiss HP, et al. Role of left ventricular stiffness in heart failure with normal ejection fraction.
Circulation 2008; 117: 2051-60.
24. Foley RN, Parfrey PS, Harnett JD, Kent GM, Murray DC, Barre PE. The prognostic importance of left ventricular geometry in uremic cardiomy- opathy. J Am Soc Nephrol 1995; 5: 2024-31.
25. Fathi R, Isbel N, Haluska B, Case C, Johnson DW, Marwick TH. Corre- lates of subclinical left ventricular dysfunction in ESRD. Am J Kidney Dis 2003; 41: 1016-25.
26. Graham RJ, Gelman JS, Donelan L, Mottram PM, Peverill RE. Effect of preload reduction by haemodialysis on new indices of diastolic function.
Clin Sci (Lond) 2003; 105: 499-506.
27. Shanahan CM, Cary NR, Salisbury JR, Proudfoot D, Weissberg PL, Ed- monds ME. Medial localization of mineralization-regulating proteins in association with Monckeberg’s sclerosis: evidence for smooth muscle cell- mediated vascular calcification. Circulation 1999; 100: 2168-76.
28. Wang AY, Wang M, Lam CW, Chan IH, Zhang Y, Sanderson JE. Left ven- tricular filling pressure by doppler echocardiography in patients with end-stage renal disease. Hypertension 2008; 52: 107-14.