Posterior Body Surface Potential Mapping Using Capacitive- Coupled Electrodes and Its Application
Using 49 capacitive-coupled electrodes, mattress-type harness was developed to obtain posterior body surface potential map (P-BSPM) in dressed individuals. The aim of this study was to investigate how valuable information P-BSPM could provide, especially in
discrimination of old myocardial infarction (OMI). P-BSPM of 59 individuals were analyzed;
23 normal control, 11 right bundle branch block (RBBB), 3 left bundle branch block (LBBB) and 19 OMI patients. Principal component analysis and linear hyper-plane approach were used to evaluate diagnostic performance. The axes of P-BSPM vector potential
corresponded well with 12-lead electrocardiogram. During QRS, the end point of P-BSPM vector potential demonstrated characteristic clockwise rotation in RBBB, and
counterclockwise rotation in LBBB patients. In OMI, initial negativity on P-BSPM during QRS was more frequently located at lower half, and also stronger in patients with inferior myocardial infarction (MI). The area under the receiver-operating characteristic curve of P-BSPM during QRS in diagnosing overall OMI, anterior MI, and inferior MI was 0.83 (95%
confidence interval, 0.70-0.97), 0.71 (0.47-0.94), and 0.98 (0.94-1.0), respectively (P = 0.022 for anterior vs inferior MI groups). In conclusion, the novel P-BSPM provides detailed information for cardiac electrical dynamics and is applicable to diagnosing OMI, especially inferior myocardial infarction.
Key Words: Body Surface Potential Map; Electrocardiography; Myocardial Infarction Youngjin Cho1, Seungmin Lee2,
Eue-Keun Choi1, Hyo Eun Park1, Kwang-Suk Park3, and Seil Oh1
1Department of Internal Medicine, Seoul National University College of Medicine, Seoul;
2Interdisciplinary Program for Bioengineering, Seoul National University, Seoul; 3Department of Biomedical Engineering, Seoul National University College of Medicine, Seoul, Korea
Received: 27 June 2012 Accepted: 20 September 2012 Address for Correspondence:
Seil Oh, MD
Department of Internal Medicine, Seoul National University College of Medicine and Seoul National University Hospital, 101 Daehak-ro, Jongno-gu, Seoul 110-744, Korea Tel: +82.2-2072-2088, Fax: +82.2-762-9662 E-mail: [email protected]
This research was partly supported by Public Welfare & Safety Research Program through the National Research Foundation of Korea (NRF) funded by the Ministry of Education, Science and Technology (No. 2011-0020973).
http://dx.doi.org/10.3346/jkms.2012.27.12.1517 • J Korean Med Sci 2012; 27: 1517-1523
INTRODUCTION
The 12-lead electrocardiogram (ECG) is a fundamental and an important measure to examine electrical activity and diagnose coronary heart disease. Despite its usefulness, the standard 12- lead ECG has a limitation in use at practice, since it requires un- exploration of thorax for measurement. Torso-type body sur- face potential mapping (BSPM) collects electrocardiographic signals from numerous leads covering the entire thorax, and was suggested as an alternative. Although it has been reported to be more useful than standard 12-lead ECG in some clinical settings such as non ST-segment elevation myocardial infarc- tion or myocardial infarction (MI) with left bundle branch block (LBBB) (1-3), it seems that BSPM has not yet been widely ad- opted in daily routine practice, probably due to long set-up time and discomforts while attaching numerous electrodes.
We developed the mattress type harness for obtaining poste- rior body surface potential map (P-BSPM) using the capacitive- coupled electrode (CC-electrode) which can record electrocar- diogram from dressed individuals. The aim of this study was to investigate how valuable information P-BSPM could provide, especially in discrimination of prior MI.
MATERIALS AND METHODS Study population and case definition
Individuals who visited outpatient clinic at Seoul National Univer- sity Hospital, and was prescribed for 12-lead ECG were screened.
After excluding patients with known or suspected cardiac dis- eases, 37 individuals were enrolled for the study. The patients were grouped into three, as normal control (NC, n = 23), right bundle branch block (RBBB, n = 11), or LBBB group (n = 3), ac- cording to the ECG manifestation. RBBB was defined as QRS duration > 120 ms and terminal R wave in lead V1 (e.g., R, rR´, rsR´, rSR´ or qR) with slurred S wave in leads I and V6. LBBB was defined by following criteria: QRS duration > 120 ms; small or absent initial R waves in V1 and V2 followed by deep S waves;
broad, notched R waves in leads V5 and V6 and usually I and aVL; and absent septal Q waves in left sided leads (4).
To evaluate patients with old MI, we screened patients who were admitted for scheduled coronary angiographic follow-up, and 19 patients with prior history of MI were enrolled as old myocardial infarction (OMI) group. Myocardial infarction was defined as the presence of at least two of the three followings: 1) ischemic symptoms, 2) CK-MB elevation at least two times the
upper limit of normal, or 3) new ECG changes compatible with MI. Coronary angiography was reviewed, and angiographic oc- clusion of coronary artery was confirmed in all patients. The in- farct-related artery and corresponding region of MI was also determined. Standard 12-lead ECG was reviewed, and the scor- ing system introduced by Strauss et al. (5) was adopted to quan- tify scar % of myocardium. Regional wall motion of left ventricle (LV) was analyzed based on 16-segment model using transtho- racic echocardiography (6) at the time of P-BSPM examination.
Posterior body surface potential mapping
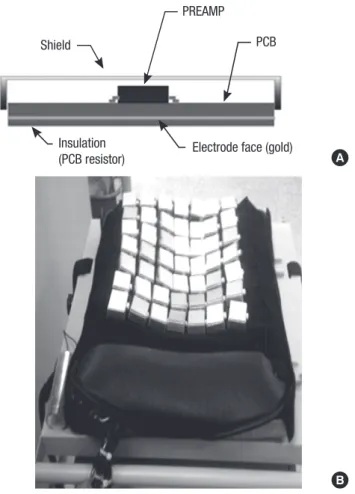
CC-electrode was designed similar to the device produced by Lim et al. (7). Fig. 1A illustrates the geometry. Each CC-electrode was sized 3 × 4 cm2 and used a preamp of ultra-high input im- pedance (1013Ω, OPA124 of Texas Instrument, Dallas, TX, USA) to record surface ECG through the dress of individuals. The elec- trode was covered with gold, insulated, and shielded in order to block noise from external factors. The CC-electrodes were placed in 7 × 7 array to form mattress type P-BSPM harness, and it was installed on the mattress (Fig. 1B). Cushioning of the mattress helped the electrode array to accommodate the curve of the body. Dressed individuals were laid on the system, placing the
center of the electrode array on the 4th intercostal area of the posterior thorax. Signals were digitized by NI-DAQ 6225 (Na- tional Instruments, Austin, TX, USA) with 1 kHz sampling rate per channel and were recorded for 2 min simultaneously on the back of the thorax, and bad channels were interpolated from adjacent channels. Acquired data were averaged to highlight ECG signal against noise, using R-peak as a landmark. Then P- BSPM during the entire cardiac cycle was displayed using MAT- LAB 2006a.
Map display and data analysis
Acquired P-BSPM was displayed in color contoured, iso-poten- tial type map. Direction and magnitude of potential gradient at each electrode was computed, and summed to generate vector potential of P-BSPM (Fig. 2). The direction of vector potential was compared with the axes of P, R, T waves of standard 12-lead ECG at corresponding time point. Also, the end point of vector potential was traced during cardiac cycle and displayed in 3- dimensional cylindrical coordinate system, with average poten- tial of 49 electrodes as z-axis. Along with P-BSPM during the QRS, traditional BSPM parameters such as ST60 integral, T-apex- end integral were computed. ST60 integral was defined as iso- integral of P-BSPM from 0 to 60 ms from the J-point, and T-apex- end integral as iso-integral from the peak to the end of T-wave.
The diagnostic performance of these parameters in discrimi- nating P-BSPM of OMI group from NC group was explored us- ing the methods of principal component analysis (PCA) (8) and linear hyperplane approach (LHA) introduced by Donnelly et al. (9). The number of principal components was arbitrarily de- termined as 5.
Statistical analysis
The student’s t-test was used to compare means, and chi-square test (or Fisher’s exact test) to compare categorical data. Pearson’s Shield
PREAMP
PCB
Electrode face (gold) Insulation
(PCB resistor) A
B Fig. 1. Posterior body surface potential mapping (P-BSPM) system. (A) Geometry of capacitive-coupled electrode including preamp, insulator, electrode face and shield- ing case. (B) Photograph of the mattress-type P-BSPM harness.
Fig. 2. Example of P-BSPM isopotential map and its vector potential. Potential in- creases from blue to red color. Small black arrows represent potential gradient vector at each electrode, which sum to vector potential of P-BSPM, the large blue arrow. Rt, right; Lt, left.
correlation coefficient was used to evaluate correlation between the wave axes of 12-lead ECG and vector potentials of P-BSPM.
Diagnostic performance was evaluated using the receiver-op- erating characteristic (ROC) curve. The confidence interval of the area under the ROC-curve (AUC) was calculated, and com- parison between ROC-curves was performed by DeLong meth- od. All of the statistical analysis was performed using R version 2.13.0 and P values < 0.05 were considered statistically signifi- cant.
Ethics statement
The study protocol was reviewed and approved by the Institu- tional Review Board of Seoul National University Hospital (IRB No. H-0804-043-001), and followed Declaration of Helsinki. In- formed consent was confirmed by the IRB.
RESULTS
P-BSPM of normal control group
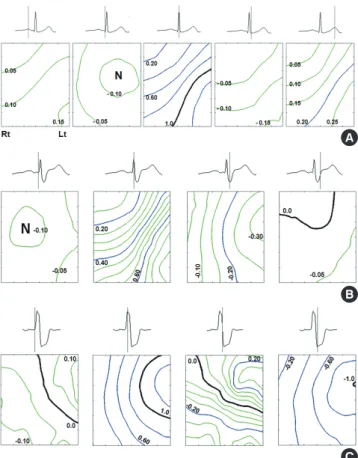
A total of 23 individuals were enrolled as normal control (10 males; age, 44 ± 18 yr). Averaged iso-potential maps of NC group at specified time point are presented in Fig. 3A. Maximum posi- tive potential was located at left inferior field during the P wave.
During ventricular depolarization (QRS complex), negative po- tential appeared at left middle field at early phase, then this neg- ativity migrated toward right superior and strong maximum pos- itivity was shown at left inferior field. Lastly iso-potential map revealed minimum negativity at left inferior field. During ventric- ular repolarization (T-wave), weak positive potential appeared again at left inferior field. The axes of P, R and T waves of stan- dard 12-lead ECG and the corresponding directions of vector potential of P-BSPM were compared and calculated Pearson’s correlation coefficients were 0.85, 0.91, and 0.79, respectively (all P < 0.001).
P-BSPM of bundle branch block groups
A total of 11 patients with RBBB (7 males; age, 62 ± 11 yr) and 3 patients with LBBB (2 males; age, 70 ± 2 yr) were enrolled in this study. Averaged iso-potential maps during ventricular depolar- ization in patients with RBBB are presented as Fig. 3B. In the earlier phase of ventricular depolarization, positive potential site emerged at left lower field, and then negative potential showed at left upper field of P-BSPM. In patients with LBBB, maximal positive potential of ventricular depolarization was located on left middle area of the back, and negative potential followed on the similar site of P-BSPM (Fig. 3C). The end points of summed vector potential on P-BSPM were traced during QRS complex, A
B
C Fig. 3. Averaged iso-potential P-BSPM at specific time. (A) Normal control, (B) right bundle branch block, and (C) left bundle branch block group. Potential interval is 0.05, 0.20, and 1.0 between green, blue, and black lines, respectively. N indicates minimum negativity on the map.
Fig. 4. Representative tracing of vector potential during QRS. (A) Normal control, (B) right bundle branch block, and (C) left bundle branch block patients. The end point of vector was displayed in 3D-cylindrical coordinate, with averaged potential of 49 electrodes as z-axis. Each circle on the line represents 5 ms time interval and darker circles indicates later events.
A B C
Potential Potential
Potential
Upper Upper Upper
Lower Rt Lower Rt Lower Rt
Lt Lt Lt
0.4 0.4
0.4
-0.4 -0.4
-0.4
0 00
and the trace in RBBB patients demonstrated that initial strong positivity directed toward left lower field in the pattern of clock- wise rotation, and later weak negativity slowly moved from left upper to right side of the map (Fig. 4B). In patients with LBBB, the trace of vector potential showed counterclockwise rotation (Fig. 4C), and the trace was relatively linear in NC group (Fig.
4A). Using the method of LHA and PCA, P-BSPM during the QRS provided the highest AUC of the ROC-curve in discrimi- nating RBBB patients from NC group (AUC, 1.0; 95% confidence interval [CI], 1.0-1.0) (Table 1). This analysis was not performed in LBBB patients due to the small number of patients.
P-BSPM of old myocardial infarct group
P-BSPM was acquired from 19 patients of OMI group. Pathologic Q-wave was identified in 9 patients (47%). Anterior infarction due to occlusion of left anterior descending artery (LAD) was most frequent (9 out of 19, 47%). Three patients demonstrated no significant regional wall motion abnormality on echocardiog- raphy. The average percent of LV scar quantified by 12-lead ECG was 11.5 ± 10.9, and it was higher when LAD was the culprit (anterior MI) compared to right coronary artery related infarc- tion (inferior MI group), with borderline statistical significance (15.7 ± 10.9 vs 6.4 ± 6.3, P = 0.089). The clinical characteristics
Table 1. Diagnostic performance of P-BSPM in patients with right bundle branch block
Index QRS
complex ST60
integral T-apex-end integral
Area under the curve* 1.0 0.95 0.86
95% confidence interval 1.0-1.0 0.88-1.0 0.73-0.99
*A total of 23 normal P-BSPM was used as normal control. ROC-curve was generated using the linear hyperplane approach with the principal component analysis. P-BSPM, posterior body surface potential mapping; ROC-curve, receiver-operating characteris- tic curve.
Table 2. Clinical characteristics of old myocardial infarction group
Parameters OMI total
(n = 19) Anterior MI
(n = 9) Inferior MI (n = 7) P value*
Age (yr) 62 ± 11 63 ± 11 65 ± 10 0.84
Male (%) 16 (84) 7 (78) 6 (86) 1.0
ECG abnormality Pathologic Q-wave Abnormal ST segment Abnormal T-wave
9 (47) 9 (47) 11 (58)
5 (56) 4 (44) 5 (55.6)
4 (57) 3 (43) 3 (43)
1.0 1.0 1.0 Infarct related artery
LAD LCX RCA
9 (47) 3 (16) 7 (37)
9 (100) - -
- - 7 (100)
- - - RWMA on echocardiography†
Anterior/Septal wall Lateral/Posterior wall Inferior wall
16 (84.2) 7 (37) 2 (11) 10 (53)
7 (78) 6 (67) 1 (11) 1 (11)
7 (100) 1 (14)
0 7 (100)
0.48 0.060 1.0 0.001
% LV scar by ECG 11.5 ± 10.9 15.7 ± 10.9 6.4 ± 6.3 0.089 Data are expressed as mean ± SD or number (%). *Calculated between anterior and inferior MI groups; †Sum exceeds 100 percent due to multi-vessel disease. LAD, left anterior descending; LCX, left circumflex; RCA, right coronary artery; RWMA, regional wall motion abnormality; LV, left ventricle.
Fig. 5. Locations of initial negativities during the ventricular depolarization normal con- trol, anterior MI, and inferior MI groups. Four patients of anterior MI group had no neg- ativity, and excluded from this plotting. NC, normal control; MI, myocardial infarction.
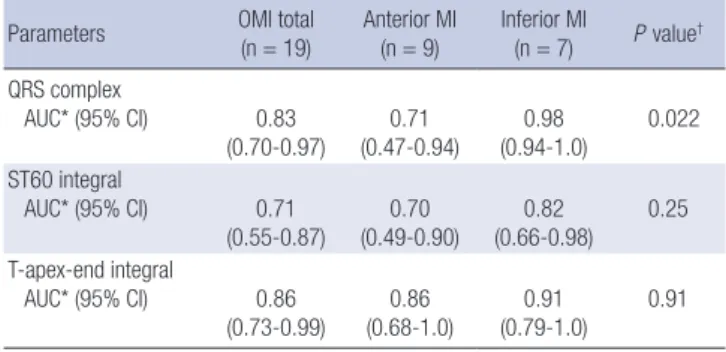
Table 3. Diagnostic performance of P-BSPM in patients with prior myocardial infarction
Parameters OMI total
(n = 19)
Anterior MI (n = 9)
Inferior MI
(n = 7) P value† QRS complex
AUC* (95% CI) 0.83
(0.70-0.97) 0.71
(0.47-0.94) 0.98
(0.94-1.0) 0.022 ST60 integral
AUC* (95% CI) 0.71
(0.55-0.87) 0.70
(0.49-0.90) 0.82
(0.66-0.98) 0.25 T-apex-end integral
AUC* (95% CI) 0.86
(0.73-0.99) 0.86
(0.68-1.0) 0.91
(0.79-1.0) 0.91
*A total of 23 normal P-BSPM was used as normal control. ROC-curve was generated using the linear hyperplane approach with the principal component analysis; †P value for ROC-curve comparison between anterior and inferior MI groups. P-BSPM, poste- rior body surface potential mapping; OMI, old myocardial infarction; AUC, area under the curve; CI, confidence interval; ROC-curve, receiver-operating characteristic curve.
of OMI group are shown in Table 2.
Iso-potential maps in patients of the OMI group showed sim- ilar pattern to those of normal control group. However, initial negativity during the QRS tended to be positioned at lower field of P-BSPM (initial negativity at lower field: OMI vs NC, 68.4% vs 30.4%; P = 0.014) (Fig. 5). Compared to NC group, this negativi- ty was significantly stronger in inferior MI group (inferior MI vs NC, -0.28 ± 0.23 vs -0.15 ± 0.07; P = 0.025), or when abnormal myocardial wall motion was observed at inferior wall (-0.33 ± 0.23 vs -0.15 ± 0.07; P = 0.003). All the potential minima of infe- rior MI patients (7 of 7, 100%) were located on the border of P- BSPM. In anterior MI group, 4 out of 9 patients (44.4%) demon- strated absence of this initial negativity, which was not observed in individuals from normal control or any other OMI group.
Using the method of LHA, the AUC of the ROC-curve of P-
BSPM in discriminating OMI patients from NC group were 0.83 (95% CI, 0.70-0.97; P < 0.001), 0.72 (95% CI, 0.55-0.87; P = 0.009), and 0.86 (95% CI, 0.73-0.99; P < 0.001) for QRS complex, ST60 integral, and T-apex-end integral, respectively (Table 3). Among the three parameters, diagnostic performance represented by the AUC was not significantly different. The AUC of ROC-curve was highest when P-BSPM of QRS complex was utilized to di- agnose inferior MI (AUC, 0.98; 95% CI, 0. 94-1.0; P < 0.001). The AUC of P-BSPM during QRS complex was significantly higher in inferior MI group than in anterior MI group (P = 0.022, Fig. 6).
DISCUSSION
Although 12-lead ECG is a standard measure for diagnosing dis- eases of the heart, there has been a demand for more informa- tive measure of electrical activities of the heart, with better di- agnostic power. BSPM was suggested as a good alternative tool, but attaching the numerous electrodes on the patient was intri- cate, thus it has not been widely adopted in daily practice. Here we developed the CC-electrodes with which ECG of dressed in- dividuals can be recorded, and designed mattress type harness using 49 CC-electrodes to obtain BSPM of posterior thorax. The acquisition of cardiac electrogram with this device was simple:
subjects were required only to lie down properly on the device.
Compared to the torso-type BSPM devices, this P-BSPM device drastically shortened the preparation time and required no lon- ger than 2 min for data acquisition.
Although this novel harness does not cover ECG of anterior chest wall, it provided valuable information on electrical activi- ties of the heart based on the numerous electrodes, implying
potential for the clinical application. First, the obtained P-BSPM corresponded well with the standard 12-lead ECG in terms of vector axes of P, R, and T- waves, and showed similar pattern to the posterior part of previously reported torso-type BSPM (10).
Moreover, P-BSPM of patients with bundle branch block (BBB) or prior MI was well discriminated from P-BSPM of normal pop- ulation, brightening the prospects of its clinical application in various situations.
The presence of BBB is conventionally recognized with pro- longed QRS duration and the characteristic morphologic chang- es in 12-lead ECG. The previous studies on BSPM has also dem- onstrated the similarly prolonged duration of ventricular depo- larization in BSPM, and the rich information of the BSPM pro- vided valuable diagnostic power on BBB (11). A recent study suggested even higher sensitivity of BSPM on diagnosing BBB than 12-lead ECG, showing distinctive QRS-T integral maps in patients on dialysis (12). In the current study, the end points of P-BSPM vector potential during the ventricular depolarization demonstrated the intuitively discernible patterns in BBB pa- tients: clockwise rotation in patients with RBBB and counter- clockwise rotation in patients with LBBB. This characteristic ro- tation of vector potential was mostly formed in earlier phase of ventricular depolarization, and the BSPM changed rather slow- ly and heterogeneously during later phase of ventricular depo- larization, especially in LBBB patients. Clear discrimination of RBBB from normal control using P-BSPM during the QRS (AUC of ROC-curve, 1.0) suggests that acquiring BSPM from the pos- terior thorax is enough to diagnose BBB, and that the traces of vector potential on P-BSPM can serve a useful parameter for studying conduction abnormality of the heart.
Several studies have reported the usefulness of torso-type BSPM in the field of diagnosing ischemic heart disease, mostly focusing on the urgent situations (2, 13-15). In patients with OMI, the validity of BSPM has not been clarified, and the stan- dard ECG diagnosis is largely determined by pathologic Q-wave (16). In the current study, P-BSPM of OMI group differed from NC group in terms of the location and the strength of negative potential appearing in the earlier phase of ventricular depolar- ization (Fig. 5). In inferior MI group, initial negativities were sig- nificantly stronger and located on the border of P-BSPM, pre- sumably because damaged myocardium of inferior wall high- lighted depolarization of the LV anterior and lateral wall. On the contrary, 44% of anterior MI patients showed absence of nega- tivity because of weakened cardiac vector toward the anterior chest wall.
With the assistance of the LHA and PCA, P-BSPM parame- ters for depolarization (QRS complex) and repolarization peri- od (T-apex-end integral) both demonstrated acceptable diag- nostic performance, considering that only 9 out of 19 OMI pa- tients (47%) demonstrated pathologic Q-wave in this study. As expected, the diagnostic performance of P-BSPM during the Fig. 6. Receiver-operating characteristic curves of P-BSPM during the QRS in diag-
nosing OMI. The method of the linear hyperplane approach and the principal compo- nent analysis was used. Area under the curve was 0.83 (95% confidence interval, 0.70-0.97), 0.71 (0.47-0.94), and 0.98 (0.94-1.0) for total OMI, anterior MI, and in- ferior MI group, respectively. OMI, old myocardial infarct; MI, myocardial infarction.
Sensitivity
1-specificity
0 0.2 0.4 0.6 0.8 1
1.0
0.8
0.6
0.4
0.2
0
Total OMI (n = 19) Anterior MI (n = 9) Inferior MI (n = 7)
QRS was better in patients with pathologic Q-wave than in pa- tients without pathologic Q-wave (pathologic Q vs no patholog- ic Q: AUC 0.94 [95% CI, 0.88-1.0] vs 0.83 [0.66-0.94]; P = 0.001).
The diagnostic performance was also influenced by the infarct territory. Despite the comparable proportions of pathologic Q- wave between the subgroups (anterior vs inferior MI group: 56%
vs 57%; P = 1.0), P-BSPM during the QRS diagnosed the pres- ence of prior MI better in inferior MI than in anterior MI (ante- rior vs inferior MI: AUC 0.71 [95% CI, 0.47-0.94] vs 0.98 [0.94-1.0];
P = 0.022). The LV scar score reflecting infarction size was even higher in anterior MI group. This result might be contributed to by the P-BSPM system which focused on the posterior thorax as the source of cardiac electrogram. P-BSPM can be more use- ful in diagnosing MI of posterior wall which is supplied by left circumflex artery, but the analysis was not performed due to the small number of patients.
Since the heart is situated anteriorly in the middle mediasti- num, surface electrocardiogram is stronger at the anterior chest wall. Thus, transverse leads of standard 12-lead ECG are focused on the anterior chest wall. In the current study, the P-BSPM har- ness acquired electrogram only from the posterior wall of the thorax using 49 CC-electrodes to maximize convenience of the examination. Nevertheless, P-BSPM demonstrated comparable axes data with the standard ECG and provided excellent infor- mation on ventricular depolarization pattern to differentiate normal ventricular conduction from BBB. Moreover, P-BSPM data from the patients with prior MI suggested that it can be uti- lized in diagnosing cardiac problems such as ischemic heart diseases. Although the newly developed P-BSPM harness was evaluated independently in the current study, it may be possi- ble to use it in combination with 12-lead ECG in the future. What is needed to obtain P-BSPM data is only lying down on a P-BSPM harness during the standard 12-lead ECG examination. In this manner, P-BSPM data can be additionally acquired without re- quiring extra time or complex procedures. Since standard 12- lead ECG does not cover the posterior thorax, P-BSPM may give additional diagnostic information. The greater AUC of ROC- curve in diagnosing inferior MI supports this potentiality. An- other potential application of P-BSPM is in the field of out-of- hospital monitoring. Since the CC-electrodes can obtain elec- trocardiogram from a dressed individual, installing CC-elec- trodes in daily furniture such as a bed, a chair, or a car seat may work as a potentially good monitoring system for P-BSPM.
This study has several limitations. First, this study enrolled small number of individuals, as a pilot study before elaborately validating the diagnostic performance of P-BSPM in various clin- ical settings. Age difference between NC and OMI group might influence the diagnostic performance of P-BSPM, especially that of T-apex-end integral, considering that the prevalence of T wave abnormality was reported to be higher in eldery popula- tion (17). Since ECG from right precordial or posterior leads can
enhance the diagnosis of RCA-related MI, lack of these data may limit the comparison of P-BSPM between anterior and inferior MI groups. Lastly, the results from the method of the LHA and PCA are limited in this study population, and generalization re- quires further studies.
In conclusion, the newly developed mattress-type harness using 49 CC-electrodes successfully records P-BSPM in dressed individuals. P-BSPM provides detailed information for cardiac electrical dynamics, and suggests applicability in diagnosing OMI, providing better diagnostic performance for RCA-territo- ry infarction.
REFERENCES
1. Maynard SJ, Menown IB, Manoharan G, Allen J, McC Anderson J, Adgey AA. Body surface mapping improves early diagnosis of acute myocardial infarction in patients with chest pain and left bundle branch block. Heart 2003; 89: 998-1002.
2. McClelland AJ, Owens CG, Menown IB, Lown M, Adgey AA. Compari- son of the 80-lead body surface map to physician and to 12-lead electro- cardiogram in detection of acute myocardial infarction. Am J Cardiol 2003; 92: 252-7.
3. Suzuki A, Hirai M, Hayashi H, Tomita Y, Ichihara Y, Adachi M, Oguchi S, Takatsu F. The ability of QRST isointegral maps to detect myocardial in- farction in the presence of simulated left bundle branch block. Eur Heart J 1993; 14: 1094-101.
4. Libby P. Braunwald’s heart disease: a textbook of cardiovascular medi- cine. 8th ed. Philadelphia: Saunders/Elsevier, 2008.
5. Strauss DG, Selvester RH, Lima JA, Arheden H, Miller JM, Gerstenblith G, Marbán E, Weiss RG, Tomaselli GF, Wagner GS, et al. ECG quantifi- cation of myocardial scar in cardiomyopathy patients with or without conduction defects: correlation with cardiac magnetic resonance and arrhythmogenesis. Circ Arrhythm Electrophysiol 2008; 1: 327-36.
6. Cerqueira MD, Weissman NJ, Dilsizian V, Jacobs AK, Kaul S, Laskey WK, Pennell DJ, Rumberger JA, Ryan T, Verani MS. Standardized myo- cardial segmentation and nomenclature for tomographic imaging of the heart: a statement for healthcare professionals from the Cardiac Imag- ing Committee of the Council on Clinical Cardiology of the American Heart Association. Circulation 2002; 105: 539-42.
7. Lim YG, Kim KK, Park KS. ECG measurement on a chair without con- ductive contact. IEEE Trans Biomed Eng 2006; 53: 956-9.
8. Jolliffe IT. Principal component analysis. 2nd ed. New York: Springer, 2002. p.xxix, 487.
9. Donnelly MP, Nugent CD, Finlay DD, Rooney NF, Black ND. Diagnos- ing old MI by searching for a linear boundary in the space of principal components. IEEE Trans Inf Technol Biomed 2006; 10: 476-83.
10. Green LS, Lux RL, Haws CW, Williams RR, Hunt SC, Burgess MJ. Effects of age, sex, and body habitus on QRS and ST-T potential maps of 1100 normal subjects. Circulation 1985; 71: 244-53.
11. Donis V, Guillem MS, Climent AM, Castells F, Chorro FJ, Millet J. Im- proving the diagnosis of bundle branch block by analysis of body surface potential maps. J Electrocardiol 2009; 42: 651-9.
12. Polak-Jonkisz D, Laszki-Szczachor K, Purzyc L, Zwoliñska D, Musial K, Pilecki W, Rusiecki L, Janocha A, Kalka D, Sobieszczañska M. Useful-
ness of body surface potential mapping for early identification of the in- traventricular conduction disorders in young patients with chronic kid- ney disease. J Electrocardiol 2009; 42: 165-71.
13. Kornreich F, Montague TJ, Rautaharju PM. Body surface potential map- ping of ST segment changes in acute myocardial infarction. Implications for ECG enrollment criteria for thrombolytic therapy. Circulation 1993;
87: 773-82.
14. Kornreich F, Montague TJ, Rautaharju PM. Identification of first acute Q wave and non-Q wave myocardial infarction by multivariate analysis of body surface potential maps. Circulation 1991; 84: 2442-53.
15. Self WH, Mattu A, Martin M, Holstege C, Preuss J, Brady WJ. Body sur- face mapping in the ED evaluation of the patient with chest pain: use of the 80-lead electrocardiogram system. Am J Emerg Med 2006; 24: 87-112.
16. Thygesen K, Alpert JS, White HD, Jaffe AS, Apple FS, Galvani M, Katus HA, Newby LK, Ravkilde J, Chaitman B, et al. Universal definition of myocardial infarction. Circulation 2007; 116: 2634-53.
17. Moller CS, Byberg L, Sundstrom J, Lind L. T wave abnormalities, high body mass index, current smoking and high lipoprotein (a) levels predict the development of major abnormal Q/QS patterns 20 years later. A pop- ulation-based study. BMC Cardiovasc Disord 2006; 6: 10.