Vascular Cell Adhesion Molecule 1, Intercellular Adhesion Molecule 1, and Cluster of Differentiation 146 Levels in Patients with Type 2 Diabetes with Complications
F. Sinem Hocaoglu-Emre1, Devrim Saribal2, Guven Yenmis3, Guvenc Guvenen4
1Department of Clinical Chemistry, Duzen Clinical Laboratories; Departments of 2Biophysics, 3Medical Biology, Istanbul University Cerrahpasa Medical Faculty; 4Department of Clinical Chemistry, Bezmi Alem University Medical Faculty, Istanbul, Turkey
Background: Type 2 diabetes mellitus (T2DM) is a multisystemic, chronic disease accompanied by microvascular complications involving various complicated mechanisms. Intercellular adhesion molecule 1 (ICAM-1), vascular cell adhesion molecule 1 (VCAM-1), and cluster of differentiation-146 (CD146) are mainly expressed by endothelial cells, and facilitate the adhesion and transmigration of immune cells, leading to inflammation. In the present study, we evaluated the levels of soluble adhesion molecules in patients with microvascular complications of T2DM.
Methods: Serum and whole blood samples were collected from 58 T2DM patients with microvascular complications and 20 age- matched healthy subjects. Levels of soluble ICAM-1 (sICAM-1) and soluble VCAM-1 (sVCAM-1) were assessed using enzyme- linked immunosorbent assay, while flow cytometry was used to determine CD146 levels.
Results: Serum sICAM-1 levels were lower in T2DM patients with microvascular complications than in healthy controls (P<0.05).
No significant differences were found in sVCAM-1 and CD146 levels between the study and the control group. Although patients were subdivided into groups according to the type of microvascular complications that they experienced, cell adhesion molecule lev- els were not correlated with the complication type.
Conclusion: In the study group, most of the patients were on insulin therapy (76%), and 95% of them were receiving angiotensin-con- verting enzyme (ACE)-inhibitor agents. Insulin and ACE-inhibitors have been shown to decrease soluble adhesion molecule levels via various mechanisms, so we suggest that the decreased or unchanged levels of soluble forms of cellular adhesion molecules in our study group may have resulted from insulin and ACE-inhibitor therapy, as well as tissue-localized inflammation in patients with T2DM.
Keywords: Cell adhesion molecules; CD146; Diabetes mellitus; Intercellular adhesion molecule-1; Microvascular complications;
Vascular cell adhesion molecule-1
INTRODUCTION
Type 2 diabetes mellitus (T2DM), which is characterized by hy-
perglycemia, is a metabolic disease increasing in prevalence worldwide. In patients with uncontrolled diabetes, hyperglyce- mia leads to oxidative stress and consequent endothelial dys-
Received: 7 September 2016, Revised: 2 January 2017, Accepted: 10 January 2017
Corresponding author: F. Sinem Hocaoglu-Emre
Department of Clinical Chemistry, Duzen Clinical Laboratories, Mecidiyekoy Mah, Cemal Sahir Sok No. 14, Istanbul 34387, Turkey
Tel: +90-506-503-0680, Fax: +90-212-272-4804, E-mail: sinememre@duzen.com.tr
Copyright © 2017 Korean Endocrine Society
This is an Open Access article distributed under the terms of the Creative Com- mons Attribution Non-Commercial License (http://creativecommons.org/
licenses/by-nc/4.0/) which permits unrestricted non-commercial use, distribu- tion, and reproduction in any medium, provided the original work is properly cited.
function via inflammation. The long-term course of diabetes in- duces systemic endothelial dysfunction and chronic inflamma- tion, which are responsible for microvascular complications such as diabetic kidney disease (DKD), diabetic retinopathy (DR), and diabetic neuropathy (DN) [1].
DR is characterized by the loss of pericytes, endothelial cell dysfunction, blood-retinal barrier breakdown, diminished capil- lary perfusion, microaneurysms, hemorrhages, and neovascular- ization [2].
DKD occurs when postinflammatory vascular changes, dif- fuse nodular or (less frequently) exudative glomerulosclerosis, and hyalinizing alterations are observed in the blood vessels, along with gradual reduction in the glomerular filtration rate [3].
Tumor necrosis factor α, a proinflammatory cytokine, stimu- lates endothelial cells, and the induced endothelium expresses adhesion molecules, such as intercellular adhesion molecule 1 (ICAM-1); vascular cell adhesion molecule 1 (VCAM-1); and melanoma cell adhesion molecule 1, which is also known as cluster of differentiation 146 (CD146) [4]. These adhesion mol- ecules are found on the walls of vessels, and they mediate the rolling and transendothelial migration of inflammatory cells into the intima by providing an anchor into the circulation [5].
Prior studies have shown soluble forms of these adhesion mole- cules to be present in the serum of diabetic patients, suggesting that endothelial activation may play a role in diabetes [6-8].
Thus, these processes not only affect the vascular endothelium as such, but also contribute to the development of microvascular complications.
Four cellular adhesion molecule (CAM) families have been identified to date: cadherins, selectins, integrins, and the immu- noglobulin CAM superfamily (IgSF-CAM). ICAM-1, VCAM- 1, and CD146 are normally expressed on the surface of endo- thelial and epithelial cells at low levels under physiological con- ditions [9].
Inflammatory cells do not adhere to the vessel wall of a prop- erly functioning endothelium, as a result of the balance between pro- and anti-inflammatory factors. In contrast, under hypergly- cemic conditions, excess glucose molecules are non-enzymati- cally coupled with the lateral chains of lysine in proteins, which is the mechanism through which glycosylation end products are produced, and as a result of oxidative stress, adhesion molecules are produced in higher amounts on the surface of activated en- dothelial cells [7]. Leukocytes bind to the activated endothelium via CAMs and their receptors (lymphocyte function-associated antigen 1 and very late antigen-4) and transmigrate into the tis- sues, where they then initiate the inflammatory process [10,11].
With the further induction of these pathways, the vascular endo- thelium is impaired and capillary permeability is increased, leading to substantial microvascular damage and, eventually, the complications observed in T2DM patients [7].
The soluble forms of CAMs can be detected in circulation as potential markers of endothelial dysfunction. Numerous studies have suggested that CAMs play an important role in the devel- opment of diabetic complications.
In this study, we aimed to evaluate the concentrations of solu- ble forms of selected CAMs, since their concentrations might reflect their expression in endothelial cells in patients with mi- crovascular complications of uncontrolled T2DM. We attempt- ed to determine whether levels of these molecules were related to the state of endothelial dysfunction, the extent of systemic in- flammation, or the severity of T2DM.
METHODS
The study group consisted of 58 T2DM patients with microvas- cular complications (DKD, DR, or DN) and 20 healthy age- matched volunteers. All subjects were clinically stable, without acute or chronic infections.
DKD was present in all of the diabetic patients with micro- vascular complications; DKD was accompanied by DN in three patients, DR in 27 patients, and both DR and DN in 10 patients.
A total of 44 of the 58 subjects in the study group were receiv- ing insulin therapy, and 32 were on oral hypoglycemic agents (sulfonylureas or sulfonylureas and biguanides). Eighteen of the subjects in the study group were taking a combination of insulin and oral hypoglycemic agents. Forty-two of the diabetic patients were treated with angiotensin-converting enzyme (ACE) inhibi- tors. The subjects in the control group were not on medications affecting carbohydrate or lipid metabolism and did not take any vitamin or mineral supplement.
Microvascular complications related to T2DM were identi- fied as present if patients suffered from DKD, DR, or DN based on a diagnosis made by expert nephrologists, neurologists, and ophthalmologists on the basis of detailed examinations, includ- ing fundoscopy and electromyelography.
DKD was defined using the urine albumin to creatinine ratio (ACR). Microalbuminuria was defined as an ACR between 30.0 and 299 mg/g and macroalbuminuria as an ACR ≥300 mg/g.
This study was conducted in accordance with the Declaration of Helsinki and approved by the Ethical Committee of Istanbul Education and Research Hospital. Written informed consent was obtained from all subjects.
Demographic data (gender and age), anthropometric data (weight, height, and body mass index [BMI]), and clinical data (disease duration and medication usage) were verified in face- to-face interviews with the subjects.
Routine analyses
Venous blood samples and spot urine samples were obtained for analysis following overnight fasting. All icteric, lipemic, or he- molytic blood samples were discarded. Clinical chemistry analy- ses (high density lipoprotein cholesterol [HDL-C], low density li- poprotein cholesterol [LDL-C], triglycerides, total cholesterol, glucose, insulin, C-peptide, high-sensitivity C-reactive protein, blood urea nitrogen [BUN], creatinine, hemoglobin A1c [HbA1c], and urinary ACR) were performed on the same day that the sam- ple was obtained, using Siemens Advia 2400 and Centaur XP au- toanalyzers with enzymatic and immunoassay methods using commercial kits (Siemens Diagnostics, Siemens Healthcare GmbH, Erlangen, Germany).
Serum soluble ICAM-1 and soluble VCAM-1 levels For the measurement of serum soluble ICAM-1 (sICAM-1) and soluble VCAM-1 (sVCAM-1) levels, serum samples were stored at −80ºC until the day of analysis. Serum sICAM-1 and sV- CAM-1 levels were measured with human sICAM-1 (RayBio- tech Inc., Norcross, GA, USA) and human sVCAM-1 (RayBio- tech) reagents using the enzyme-linked immunosorbent assay method. For absorbance measurements, a Synergy HT Multi- Mode Microplate Reader (Bio-Tek, Winooski, VT, USA) was used.
Flow cytometric analyses
Flow cytometric analyses were performed using fresh whole blood samples in order to obtain the greatest possible viable cell count. For the flow cytometric analysis of CD146 levels, PE mouse anti-human CD146 (BD Biosciences, San Jose, CA, USA) antibody was used. Peripheral blood cells were dyed us- ing 7-aminoactinomycin D, fluorescent isothiocyanide-marked anti-CD31, phycoerythrin-marked anti-CD146, and PC5- marked anti-lymphocyte common antigen (CD45) antibodies.
Following erythrolysis, cells were evaluated using a FACS- Canto II flow cytometer (BD Biosciences). First, cells were grouped according to their expression of CD45. When CD45- negative cells (i.e., non-lymphocytic cells) were subgrouped ac- cording to the expression of CD31 (also known as platelet-en- dothelial cell adhesion molecule 1) and CD146 on the surface, three different subpopulations (CD31+/CD146+, CD31−/
CD146+, and CD31+/CD146−) were obtained. The percentage of these populations was compared between the study group and the control group and within the study group. Peripheral en- dothelial cells were defined as cells with the CD45−/CD31+/
CD146+ expression pattern.
Statistical analyses
Statistical analyses were performed using SPSS version 10.0 (SPSS Inc., Chicago, IL, USA). The Student t test and the Mann-Whitney U test were performed to compare the continu- ous data, along with the mean and standard deviation. The chi- square test was performed to evaluate the categorical data.
P<0.05 was considered to indicate statistical significance with- in the 95% confidence interval. Correlations between parame- ters were tested using the Pearson and Spearman correlation co- efficients.
RESULTS
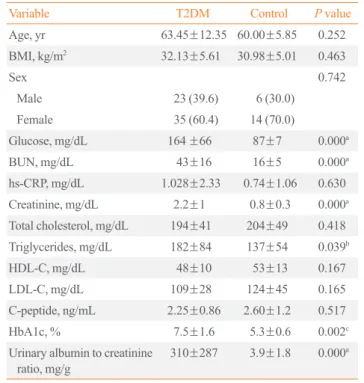
Table 1 summarizes the demographic and biochemical data of Table 1. Demographic and Biochemical Variables in the Diabetic and Control Subjects
Variable T2DM Control P value
Age, yr 63.45±12.35 60.00±5.85 0.252
BMI, kg/m2 32.13±5.61 30.98±5.01 0.463
Sex 0.742
Male 23 (39.6) 6 (30.0)
Female 35 (60.4) 14 (70.0)
Glucose, mg/dL 164 ±66 87±7 0.000a
BUN, mg/dL 43±16 16±5 0.000a
hs-CRP, mg/dL 1.028±2.33 0.74±1.06 0.630 Creatinine, mg/dL 2.2±1 0.8±0.3 0.000a Total cholesterol, mg/dL 194±41 204±49 0.418 Triglycerides, mg/dL 182±84 137±54 0.039b
HDL-C, mg/dL 48±10 53±13 0.167
LDL-C, mg/dL 109±28 124±45 0.165
C-peptide, ng/mL 2.25±0.86 2.60±1.2 0.517
HbA1c, % 7.5±1.6 5.3±0.6 0.002c
Urinary albumin to creatinine
ratio, mg/g 310±287 3.9±1.8 0.000a
Values are expressed as mean±SD or number (%).
T2DM, type 2 diabetes mellitus; BMI, body mass index; BUN, blood urea nitrogen; hs-CRP, high-sensitive C-reactive protein; HDL-C, high density lipoprotein cholesterol; LDL-C, low density lipoprotein choles- terol; HbA1c, hemoglobin A1c.
the T2DM patients and the control group. Comparisons of the groups according to age, gender, and BMI revealed no signifi- cant differences (P>0.05).
The blood lipid profile, including total cholesterol, LDL-C, and HDL-C, was not significantly different between the groups;
however, triglyceride levels were higher in the T2DM group (P<0.05). Glucose, BUN, creatinine, and HbA1c levels, as well as the urinary ACR, were significantly higher in patients with T2DM than in the control group (P<0.001, except for HbA1c).
No significant differences were found between the groups in C- peptide or high-sensitive C-reactive protein (hs-CRP) levels.
The endothelial sICAM-1, sVCAM-1, CD31−/CD146+, CD31+/CD146+, and CD31+/CD146− parameters of the con- trol and patient groups are shown in Table 2. sICAM-1 levels were significantly lower in the T2DM group than in the controls (P<0.05). However, no significant differences were found be- tween the groups in the levels of sVCAM-1 or the CD31−/
CD146+, CD31+/CD146+, and CD31+/CD146− patterns. No statistically significant difference in the levels of soluble adhe- sion molecules were found according to gender (Table 2).
When complications were investigated in isolation, glucose and HbA1c levels were significantly higher in the neuropathy group than in the T2DM patients without neuropathy (P<0.05).
However, the demographic, clinical, and biochemical variables did not differ between these groups, and no significant differ- ences were found in the endothelial parameters (P>0.05). When T2DM patients were subdivided according to the presence of DR, no statistically significant differences were observed in the levels of either biochemical or endothelial parameters (P>0.05) (Table 3).
DISCUSSION
In the present study, we investigated whether circulating levels of sICAM-1, sVCAM-1, and CD146 were correlated with en- dothelial damage leading to diabetic microvascular complica- tions. According to our results, sICAM-1 levels were consider- ably lower in T2DM patients with microvascular complications than in age-matched healthy controls, irrespective of the type of diabetic complication. The levels of the other soluble CAMs did not differ between the groups.
As a result of long-term hyperglycemia and the development of complications via inflammatory processes, glucose, HbA1c, creatinine, and BUN levels were significantly higher in the T2DM group. We did not detect any significant differences in lipoprotein levels, although triglyceride levels were notably higher in the T2DM group.
DKD was present in all members of the study group, and it was accompanied by DN in 13 patients and by DR in 37 pa- tients. When patients were subdivided according to the type of microvascular complication, no statistically significant differ- ences were found in the levels of circulating CAMs. However, glucose and HbA1c levels were significantly higher in the DN group, as a natural consequence of uncontrolled T2DM that had persisted for a long time.
When compared with the healthy controls, the decreased lev- els of sICAM-1 in the study group may have been a cause of late-stage diabetic complications. Supporting this hypothesis, studies have shown decreased or stabilized levels of soluble CAMs in unstable diabetic patients [12,13]. Additional evidence comes from recent studies showing that the concentrations of soluble CAMs reflected the degree of endothelial damage in the Table 2. Comparison of sICAM-1, sVCAM-1, and CD146 Levels between the T2DM Patients and the Control Group
Variable T2DM Control
P valueb Female (60.4%) Male (39.6%) P valuea Female (70%) Male (30%) P valuea
sVCAM-1, ng/mL 28.40±13.96 25.77±11.70 0.50 32.00±16.02 29.00±14.16 0.88 0.059
sICAM-1, ng/mL 3.72±0.71 3.91±0.77 0.65 4.27±0.91 4.11±0.78 0.78 0.013c
CD31−/CD146+, % 0.05±0.007 0.04±0.066 0.78 0.01±0.01 0.01±0.01 1.00 0.233
CD31+/CD146+, % 0.12±0.17 0.14±0.16 0.32 0.01±0.02 0.015±0.02 0.67 0.178
CD31+/CD146−, % 1.87±6.51 1.68±4.78 0.06 0.16±0.12 0.12±0.14 0.78 0.566
Values are expressed as mean±SD.
sICAM-1, soluble intercellular adhesion molecule 1; sVCAM-1, soluble vascular cell adhesion molecule 1; CD, center of differentiation; T2DM, type 2 diabetes mellitus.
aStatistically significance value when female and male patients were compared within the same group; bStatistically significance value when the T2DM and control groups were compared; cStatistically significant value when the T2DM and control groups were compared in terms of sICAM-1 levels (P<0.05).
progression of diabetic complications [14-16].
The conflicting evidence about the levels of soluble CAMs in circulation suggests that different CAMs may play different roles in different stages of microangiopathy over the course of T2DM, since endothelial cells isolated from diabetic patients have been found to express higher amounts of VCAM-1 than ICAM-1 when stimulated by cytokines in a high-glucose-medi- ated microenvironment [17,18]. In a study of patients with T2DM, the sICAM-1 and sVCAM-1 concentrations were found to be higher in the study group. However, plasma sVCAM-1, but not sICAM-1, was independently associated with DKD, suggesting that sICAM-1 and sVCAM-1 may play different roles in the different stages of the same disease [19].
Increased levels of ICAM-1 have been reported in the diabet- ic retina in the early stages of retinopathy, suggesting that ICAM-1 mediates the adhesion and transendothelial migration
of circulating leukocytes through the retinal vessel walls, one of the earliest pathological changes observed in the course of the development of DR [19]. Further research has found plasma CD146 levels to be elevated at the early stage of diabetic com- plications [20].
Additional data have shown the increased expression of adhe- sion molecules in the kidneys during the progression of DKD in T2DM [21]. This is consistent with our findings, in which ele- vated levels of soluble CAMs were observed in the early stages of diabetic complications. Excess CAMs may be localized on sites of inflammation, such as microvessels, and thus, in the late stages, their levels could be decreased or diminished in the cir- culation.
However, the studies by Guler et al. [22] and Lu et al. [17], which compared T2DM patients with and without DKD, re- vealed higher mean levels of sICAM-1 in patients with DKD Table 3. Comparison of Biochemical Variables and sICAM-1, sVCAM-1, and CD146 Levels between the Complication Groups among T2DM
Variable Neuropathy Retinopathy
Without With P value Without With P value
Age, yr 65.80±11.39 58.22±13.45 0.128 65.00±11.85 62.35±12.93 0.579
BMI, kg/m2 32.22±5.14 31.93±6.89 0.901 32.78±4.98 31.68±6.13 0.613
hs-CRP, mg/dL 0.50±0.45 2.19±4.03 0.070 0.57±0.41 1.36±3.01 0.377
Glucose, mg/dL 141±44 215±81 0.004a 143.75±62.75 179.18±67.17 0.162
BUN, mg/dL 45±17 39±16 0.375 41±20 46±15 0.509
Creatinine, mg/dL 2.4±1.1 1.7±0.6 0.104 2.23±1.07 2.21±1.07 0.946
Total cholesterol, mg/dL 199±42 182±38 0.320 189.92±30.53 197.12±48.25 0.653
Triglycerides, mg/dL 183±87 180±83 0.920 185.00±89.81 181.18±83.75 0.907
HDL-C, mg/dL 48±9 48±13 0.902 48.08±8.71 48.59±12.40 0.904
LDL-C, mg/dL 114±27 98±28 0.178 104.92±21.43 112.29±33.16 0.505
Insulin, pmol/L 45.56±45.22 53.09±54.65 0.810 18.030±17.41 59.65±49.26 0.198
C-peptide, ng/mL 1.7±1 1.6±0.85 0.925 1.48±0.53 1.76±1.06 0.678
Urinary albumin to creatinine ratio, mg/g 220±250 300±310 0.511 225±265 257±285 0.767
HbA1c, % 7.1±1 8.7±2.1 0.015b 7.51±1.92 7.80±1.46 0.645
Diabetes duration, yr 11.89±8.76 15.11±6.81 0.342 9.73±9.09 15.00±7.08 0.097
sVCAM-1. ng/mL 25.14±10.21 24.10±9.79 0.800 26.06±9.16 23.93±10.61 0.578
sICAM-1, ng/mL 3.73±8.63 3.43±0.57 0.351 3.66±0.62 3.62±0.90 0.892
CD31−/CD146+, % 0.05±0.06 0.04±0.05 0.899 0.03±0.02 0.06±0.07 0.273
CD31+/CD146+, % 0.11±0.16 0.14±0.21 0.675 0.05±0.08 0.16±0.20 0.095
CD31+/CD146−, % 2.45±7.81 0.56±0.73 0.480 0.76±1.69 2.65±8.40 0.452
Values are expressed as mean±SD.
sICAM-1, soluble intercellular adhesion molecule 1; sVCAM-1, soluble vascular cell adhesion molecule 1; CD, center of differentiation; T2DM, type 2 diabetes mellitus; BMI, body mass index; hs-CRP, high-sensitive C-reactive protein; BUN, blood urea nitrogen; HDL-C, high density lipoprotein choles- terol; LDL-C, low density lipoprotein cholesterol; HbA1c, hemoglobin A1c.
than in patients without nephropathy.
According to the theory proposed by Kanasaki et al. [23], the binding between CAMs and their receptors can further aggra- vate tissue damage by causing leukocytes to aggregate on endo- thelial cells. Additionally, impaired blood flow increases glo- merular capillary pressure and stimulates ICAM-1 expression by endothelial cells, resulting in chronic inflammation [23].
A study with a larger sample size by Matsumoto et al. [24] sug- gested that elevated levels of soluble adhesion molecules might promote diabetic microangiopathy, since ICAM-1, VCAM-1, and E-selectin levels were significantly elevated in patients with mi- croangiopathy. They also speculated that the contribution of ICAM-1 may be greater in microangiopathy than in macroangi- opathy, and that diabetic microangiopathy may be closely corre- lated with chronic hyperglycemia resulting from insulin resis- tance [24].
Insulin has been shown to be an arterial and venous vasodila- tor that acts by stimulating nitric oxide (NO) release through in- creased endothelial nitric oxide synthase (e-NOS) expression, and an inhibitor of ICAM-1 expression that acts by inducing e- NOS and NO generation [25]. Supporting this hypothesis, the majority of our patients (76%) in the microangiopathy group were on insulin therapy.
In order to prevent the above-mentioned adverse changes, ACE inhibitors are used to treat patients. Numerous studies have reported that angiotensin II increased endothelial cell death [7]. As a vasodilator molecule, NO has anti-inflammatory prop- erties and decreases VCAM expression [26]. It has been shown that the inhibition of ACE stimulates NO production by increas- ing bradykinin [27]. Furthermore, ACE inhibitors have been shown to reduce circulating levels of CAMs in T2DM patients [28].
The ACE inhibitors, which were present in the medication regimen of most of our patients (72%), may have been why re- duced sICAM-1 levels were observed jointly with the presence of diabetic microvascular complications in this group. However, why only the sICAM-1 levels were found to be decreased needs more investigation.
Additionally, hs-CRP levels did not differ significantly be- tween the groups, indicating that a non-inflammatory microen- vironment was present in the T2DM patients; in light of this finding, observing increased levels of inflammatory substances would not be expected.
In summary, our study shows that circulating sICAM-1 levels were decreased in late-stage T2DM patients with complications, whereas the levels of the other variables that we investigated
(sVCAM-1 and CD146) did not differ, suggesting that a local inflammatory model would be appropriate for these molecules.
Additionally, the widespread use of insulin and ACE inhibitors in our study group may explain these findings, because those medications have vasodilatory and anti-inflammatory proper- ties. In conclusion, our data suggest that circulating levels of CAMs are not associated with chronic and late-stage complica- tions in T2DM patients, but their role in different stages of the inflammatory process in diabetic patients should be studied fur- ther.
CONFLICTS OF INTEREST
No potential conflict of interest relevant to this article was re- ported.
REFERENCES
1. American Diabetes Association. Diagnosis and classification of diabetes mellitus. Diabetes Care 2014;37 Suppl 1:S81-90.
2. Stratton IM, Kohner EM, Aldington SJ, Turner RC, Holman RR, Manley SE, et al. UKPDS 50: risk factors for incidence and progression of retinopathy in type II diabetes over 6 years from diagnosis. Diabetologia 2001;44:156-63.
3. Haneda M, Utsunomiya K, Koya D, Babazono T, Moriya T, Makino H, et al. A new classification of diabetic nephropa- thy 2014: a report from Joint Committee on Diabetic Ne- phropathy. J Diabetes Investig 2015;6:242-6.
4. Golias C, Tsoutsi E, Matziridis A, Makridis P, Batistatou A, Charalabopoulos K. Review. Leukocyte and endothelial cell adhesion molecules in inflammation focusing on inflamma- tory heart disease. In Vivo 2007;21:757-69.
5. Hansson GK, Libby P. The immune response in atheroscle- rosis: a double-edged sword. Nat Rev Immunol 2006;6:508- 19.
6. Joussen AM, Murata T, Tsujikawa A, Kirchhof B, Bursell SE, Adamis AP. Leukocyte-mediated endothelial cell injury and death in the diabetic retina. Am J Pathol 2001;158:147- 52.
7. Hadi HA, Suwaidi JA. Endothelial dysfunction in diabetes mellitus. Vasc Health Risk Manag 2007;3:853-76.
8. Endemann DH, Schiffrin EL. Endothelial dysfunction. J Am Soc Nephrol 2004;15:1983-92.
9. Aricescu AR, Jones EY. Immunoglobulin superfamily cell adhesion molecules: zippers and signals. Curr Opin Cell Biol 2007;19:543-50.
10. Chen C, Mobley JL, Dwir O, Shimron F, Grabovsky V, Lobb RR, et al. High affinity very late antigen-4 subsets ex- pressed on T cells are mandatory for spontaneous adhesion strengthening but not for rolling on VCAM-1 in shear flow.
J Immunol 1999;162:1084-95.
11. Schnoor M, Alcaide P, Voisin MB, van Buul JD. Crossing the vascular wall: common and unique mechanisms exploit- ed by different leukocyte subsets during extravasation. Me- diators Inflamm 2015;2015:946509.
12. Liu JJ, Yeoh LY, Sum CF, Tavintharan S, Ng XW, Liu S, et al. Vascular cell adhesion molecule-1, but not intercellular adhesion molecule-1, is associated with diabetic kidney dis- ease in Asians with type 2 diabetes. J Diabetes Complica- tions 2015;29:707-12.
13. Noda K, Nakao S, Zandi S, Sun D, Hayes KC, Hafezi- Moghadam A. Retinopathy in a novel model of metabolic syndrome and type 2 diabetes: new insight on the inflamma- tory paradigm. FASEB J 2014;28:2038-46.
14. Goldberg RB. Cytokine and cytokine-like inflammation markers, endothelial dysfunction, and imbalanced coagula- tion in development of diabetes and its complications. J Clin Endocrinol Metab 2009;94:3171-82.
15. Lin J, Glynn RJ, Rifai N, Manson JE, Ridker PM, Nathan DM, et al. Inflammation and progressive nephropathy in type 1 diabetes in the diabetes control and complications tri- al. Diabetes Care 2008;31:2338-43.
16. Persson F, Rossing P, Hovind P, Stehouwer CD, Schalkwijk CG, Tarnow L, et al. Endothelial dysfunction and inflamma- tion predict development of diabetic nephropathy in the Irbe- sartan in patients with type 2 diabetes and microalbuminuria (IRMA 2) study. Scand J Clin Lab Invest 2008;68:731-8.
17. Lu J, Randell E, Han Y, Adeli K, Krahn J, Meng QH. In- creased plasma methylglyoxal level, inflammation, and vas- cular endothelial dysfunction in diabetic nephropathy. Clin Biochem 2011;44:307-11.
18. Ruszkowska-Ciastek B, Sokup A, Wernik T, Ruprecht Z, Goralczyk B, Goralczyk K, et al. Effect of uncontrolled hy- perglycemia on levels of adhesion molecules in patients with diabetes mellitus type 2. J Zhejiang Univ Sci B 2015;16:355- 61.
19. Ugurlu N, Gerceker S, Yulek F, Ugurlu B, Sari C, Baran P, et al. The levels of the circulating cellular adhesion molecules ICAM-1, VCAM-1 and endothelin-1 and the flow-mediated vasodilatation values in patients with type 1 diabetes mellitus with early-stage diabetic retinopathy. Intern Med 2013;52:
2173-8.
20. Wang F, Xing T, Wang N, Liu L. Clinical significance of plasma CD146 and P-selectin in patients with type 2 diabet- ic nephropathy. Cytokine 2012;57:127-9.
21. Luis-Rodriguez D, Martinez-Castelao A, Gorriz JL, De-Al- varo F, Navarro-Gonzalez JF. Pathophysiological role and therapeutic implications of inflammation in diabetic ne- phropathy. World J Diabetes 2012;3:7-18.
22. Guler S, Cakir B, Demirbas B, Yonem A, Odabasi E, Onde U, et al. Plasma soluble intercellular adhesion molecule 1 levels are increased in type 2 diabetic patients with nephrop- athy. Horm Res 2002;58:67-70.
23. Kanasaki K, Taduri G, Koya D. Diabetic nephropathy: the role of inflammation in fibroblast activation and kidney fi- brosis. Front Endocrinol (Lausanne) 2013;4:7.
24. Matsumoto K, Sera Y, Ueki Y, Inukai G, Niiro E, Miyake S.
Comparison of serum concentrations of soluble adhesion molecules in diabetic microangiopathy and macroangiopa- thy. Diabet Med 2002;19:822-6.
25. Aljada A, Saadeh R, Assian E, Ghanim H, Dandona P. Insu- lin inhibits the expression of intercellular adhesion mole- cule-1 by human aortic endothelial cells through stimulation of nitric oxide. J Clin Endocrinol Metab 2000;85:2572-5.
26. De Caterina R, Libby P, Peng HB, Thannickal VJ, Rajavash- isth TB, Gimbrone MA Jr, et al. Nitric oxide decreases cyto- kine-induced endothelial activation. Nitric oxide selectively reduces endothelial expression of adhesion molecules and proinflammatory cytokines. J Clin Invest 1995;96:60-8.
27. Drexler H, Kurz S, Jeserich M, Munzel T, Hornig B. Effect of chronic angiotensin-converting enzyme inhibition on en- dothelial function in patients with chronic heart failure. Am J Cardiol 1995;76:13E-8E.
28. Berg AH, Scherer PE. Adipose tissue, inflammation, and cardiovascular disease. Circ Res 2005;96:939-49.