pISSN 2288-3886 / eISSN 2288-3959
국민건강영양조사에 활용 가능한 식생활 조사항목 개발 및 유용성 검증*
임아현1
·
최숙영1·
심재은2·
황지윤3·
문현경1·
김기랑1†단국대학교식품영양학과,1대전대학교식품영양학과,2상명대학교교육대학원영양교육전공3
Development of dietary behavior items available in Korea National Health and Nutrition Examination Survey*
Lim, A-Hyun
1· Choi, Suk-Young
1· Shim, Jae-Eun
2· Hwang, Ji-Yun
3· Moon, Hyun-Kyung
1· Kim, Kirang
1†1Department of Food Science and Nutrition, Dankook University, Chungnam 31116, Korea
2Department of Food and Nutrition, Daejeon University, Daejeon 34520, Korea
3Nutrition Education Major, Graduate School of Education, Sangmyung University, Seoul 03016, Korea
서 론
경제성장과 더불어 식생활이 빠르게 변화하면서 당뇨병, 고지혈증, 고혈압, 비만과 같은 만성질환의 위험이 증가하 고 있다. 만성질환과 현대인의 식생활의 상관성은 많은 논 문과 보고서를 통해 입증되어왔다.1-3이에 따라 현대에 이 르러 건강검진을 위한 평가 중 식생활 항목이 대부분 포함 되어있으며 만성질환 발생을 선별함에 있어서 식생활 평 가 도구가 이용되고 있다. 국민영양관리법에 따르면 식생 활이란 “식문화, 식습관, 식품의 선택 및 소비 등 식품의 섭 취와 관련된 모든 양식화된 행위”를 말한다. 따라서 국민
식생활에 대한 모니터링을 통해서 국민의 영양 상태를 평 가하고 질환 발생 예방을 위한 정책 개발은 중요하다고 할 수 있다.
현재 질병관리본부에서 시행되고 있는 국민건강영양조 사 (Korean National Health and Nutrition Examination Survey, KNHANES)는 국민의 식생활을 모니터링하기 위 해 구축된 체계적인 조사로 이에 관련된 기초자료를 생산 하는 것을 목적으로 하고 있다. 또한 국민건강증진종합계 획 (Health Plan 2020)의 목표 달성을 평가하는 지표로 활 용할 수 있도록 하는 것도 목적에 포함된다.4현재 국민건 강영양조사에서 진행되고 있는 식생활 조사항목 (2014년
ABSTRACT
Purpose: Given that the indicators related to chronic diseases are important to evaluating goals of the national health
policy, the aim of this study was to develop dietary behavior items available in the Korea National Health and Nutrition Examination Survey.
Methods:The dietary behavior items were developed based on the literature reviews, need assessment of the field, expert focus-group interviews, and expert advisory meeting. Questions for each dietary behavior item were developed by reflecting on environmental, personal, and behavior factors of the ecological frame and then revised through expert focus-group interview and expert advisory meeting. The understanding and reliability of the developed questionnaire were assessed by cognitive interview and test-retest reliability. Results: The developed items were sodium and salt intake, added and simple sugar intake, enough time to consume a meal for all ages, caffeine drinks and fresh/healthy food intake for children and adolescents, and limited dietary intake, fresh/healthy food intake for seniors.
In most questions except some questions on sodium and salt intake, subjects understood over 70% and consistency of responses based on the kappa values was acceptable.
Conclusion: Developed dietary behavior items are expected to beuseful for evidence-based nutrition policy, interventions and research targeting dietary patterns through investigating and monitoring dietary behavior patterns.
KEY WORDS: dietary behavior, food behavior survey, eating behavior survey, Korean National Health and Nutrition
Examination Survey
Received: September 15, 2015 / Revised: October 1, 2015 / Accepted: October 1, 2015
*This research was supported by a fund by Research of Korea Centers for Disease Control and Prevention (2014-E3500600).
†To whom correspondence should be addressed.
tel: 82-41-550-3472, e-mail: [email protected]
© 2015 The Korean Nutrition Society
This is an Open Access article distributed under the terms of the Creative Commons Attribution Non-Commercial License (http://creative- commons.org/licenses/by-nc/3.0/) which permits unrestricted non-commercial use, distribution, and reproduction in any medium, provided the original work is properly cited.
도 제 5기 기준)은 식습관, 식이보충제, 영양지식, 식생활지 원, 영유아기 식생활 조사항목을 포함하고 있다. 이 항목들 은 국민건강증진종합계획의 평가 지표를 산출하기 위해 활용되고 있으나, 여전히 나트륨 저감화 정책과 같은 국가 정책을 평가하기 위한 지표들은 미비한 상황이다. 최근 국 제적으로 나트륨 및 당류 등으로 인한 만성 질환 발생률이 증가함에 따라 이들 섭취 수준을 파악하기 위한 지표 개발 및 모니터링 체계가 활발히 진행되고 있다.5
이에 본 연구는 현재 국민건강영양조사의 식생활조사 항목과 국내 및 국외에서 실시하고 있는 식생활 조사항목 을 고찰하여 변화하고 있는 국민 식생활 패턴이 반영되면 서 국가 정책의 평가 지표로 활용될 수 있는 식생활 조사항 목을 개발하여 국민건강영양조사에 활용되고자 하였다.
연구방법
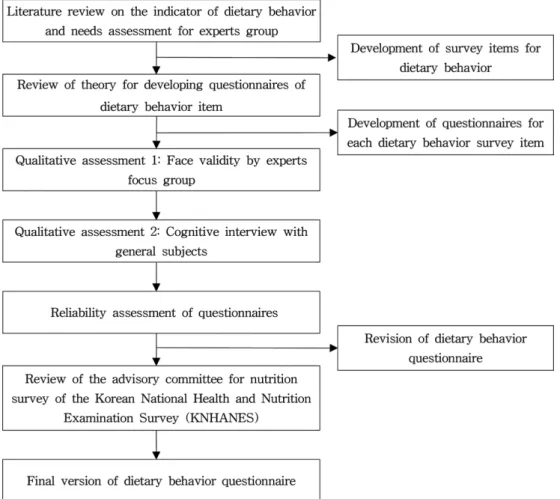
국민건강영양조사 식생활 조사 항목 개발 과정 국민건강영양조사 식생활 조사항목 개발은 7단계에 걸
쳐 2014년 3월부터 12월까지 진행되었다 (Fig. 1). 첫 번째 단계로 국내외 식생활 조사 항목 현황을 고찰한 뒤 식생활 관련 전문가에게 각 항목에 대한 수요도 조사를 실시하여 우선순위를 결정하였다. 두 번째 단계로 수요도 조사에서 선정된 식생활 항목을 생태학적 프레임과 사회인지이론 을 적용하여 식생활 문항 개발 원칙을 검토하였다. 세 번째 단계로 개발된 조사 항목과 항목별 문항은 전문가 대상으 로 안면타당도 평가가 이루어졌고 이어서 일반인을 대상 으로 인지조사 (cognitive interview)와 신뢰도 평가가 이 루어진 후, 이 결과를 통해 식생활 항목을 추가적으로 수정 하였다. 마지막 단계로 질병관리본부 국민건강영양조사 영양조사 담당자 및 영양분과 위원회의 검토 후 식생활 조 사 항목 및 문항이 확정되었다.
식생활 조사 항목과 관련된 국내외 문헌 고찰을 기반 으로 국민건강영양조사에 활용 가능한 식생활 조사 추 가 항목 개발
국내외 식생활에 관련된 학술지와 국가기관, 국가정책
Fig. 1. The development procedure of dietary behavior questionnaire.
등에서 이용하고 있는 식생활 조사 문항에 대한 현황을 조 사하고 고찰하였다. 국가차원의 국민건강영양조사로는 미 국의 국민건강영양조사 (NHANES), 행동위험요인조사 (BRFSS), 영국의 국민건강영양조사 (NDNS), 영유아 영양 조사 (DNSIYC), 캐나다 지역사회건강조사 (CCHS), 일본 의 국민건강영양조사 (NHNSJ), 호주의 국민건강영양조 사 (NHS, NNPAS) 등을 포함하였다.6-12국내의 정책을 고 찰하기 위해 보건복지부에서 발표한 식생활 지침과 국민 건강증진종합계획 (Health Plan 2020)을 조사하였으며 국 내 부처별에서 실시하고 있는 청소년 건강행태온라인 조 사, 지역사회건강조사, 한국인 유전체 역학조사, 식품소비 행태조사를 조사하였다.13-16또한 국내 학술자료에서 연구 에 사용한 식생활 조사항목을 조사하기 위해서 KoreaMed, DBpia (www.google.com, http://www.kns.or.kr, www.dietnet.
or.kr, https://www.schoolhealth.kr)를 이용하여 2004년부 터 2014년까지 검색하였다. 검색 단어는 food behavior survey, eating behavior survey, 식행동이었다.
전문가 포커스 그룹 조사 및 수요도 조사
각 학회로부터 관련 분야의 전문가 추천을 받아 총 23명 을 대상으로 기존 관련 문헌고찰 결과로부터 도출된 식생 활 조사 항목에 대한 조사 필요 여부 및 이에 대한 우선순 위를 조사하였다. 또한 대한지역사회영양학회, 한국임상 영양학회, 한국역학회, 대한비만학회, 대한예방의학회, 대 한가정의학회, 대한치과보존학회의 회원들을 대상으로 식생활 항목에 대한 수요도 조사 및 문헌고찰로부터 도 출된 식생활 조사 항목에 대한 조사의 우선순위를 조사 하였다.
식생활 조사 항목의 문항 개발
식행동 개선을 위한 다수준적 중재 전략으로 유용하게 사용되고 있는 Story 등17이 제시한 생태학적 프레임 (ecological framework)모델은 식행동에 영향을 미치는 요 인을 개인수준의 요인과 환경적 요인으로 구분하였으며 환경적인 요인에는 사회적 환경, 물리적 환경, 거시적 수준 의 환경을 포함하고 있다.17사회인지이론 (social cognitive theory) 또한 개인적요인, 환경적요인, 행동이 끊임없이 상 호작용하며 서로에게 영향을 주면서 행동 변화를 가져올 수 있다는 이론18으로 개인의 인식이나 기술뿐만 아니라 사회적, 물리적 환경도 행동변화에 중요한 영향을 미친다 는 점을 고려하고 있다. 이에 식생활 조사 항목의 문항 개 발을 위해서 문헌 고찰 및 전문가 조사로부터 도출된 항목 을 생태학적 모델을 기반으로 한 사회인지이론에 적용하
여19-21각 조사 항목별로 환경, 개인적 요인, 행동의 영역으
로 나누어 설문 문항을 구성하고, 이에 대해 전문가 검토를 받았다.
조사 문항에 대한 안면 타당도 평가
조사 문항에 대한 안면 타당도는 영양조사 전문가, 영양 학자, 역학자와 질병관리본부 국민건강영양조사 관련 담 당자들로 구성된 전문가 7명을 대상으로 1차, 2차로 평가 되었다. 1차 평가에서는 문헌 고찰 및 전문가 조사로부터 도출된 조사 항목 및 각 조사 항목별로 개발된 조사 문항 검토가 이루어졌다. 2차 평가에서는 최종으로 도출된 조사 항목의 재검토와 1차 평가에서 제안된 아동 및 청소년과 노인 대상의 별도 문항에 대한 검토, 국민건강영양조사 설 문지 형태에 맞춘 조사 문항 틀에 대한 평가가 이루어졌다.
인지조사
전문가 대상 안면 타당도를 통해 수정 및 보완된 항목은 일반 인구집단에서의 적용성을 검토하기 위하여 인지조 사가 시행되었다. 조사는 2014년 8월과 9월에 시행하였다.
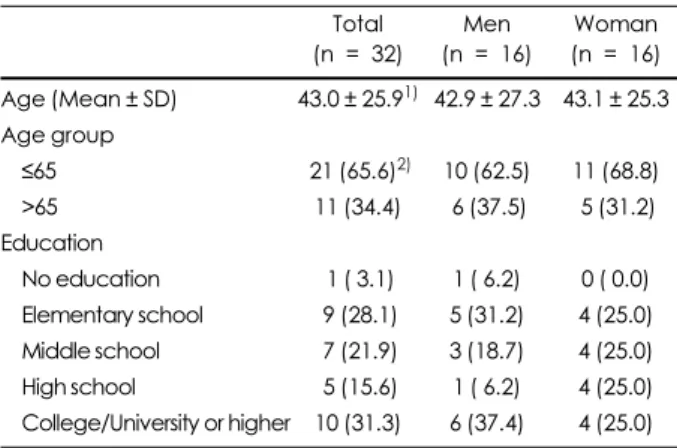
인지조사는 숙련된 6명의 연구진이 본 연구를 위해 개발된 인지조사 지침서를 통해 교육을 받은 후 진행하였다. 조사 대상자는 지역, 연령, 성별을 고려하여 총 32명을 선정하였 다. 조사 대상자의 일반적 특성은 Table 1과 같다. 대상자의 평균 연령은 43세로 65세 미만이 65.6%, 65세 이상은 34.4%였다. 교육수준은 초등학교 졸업이 28.1%, 중학교 졸업 21.9%, 4년제 대학졸업 이상 18.8%, 고등학교 졸업 15.6%, 2년제 대학졸업 12.5%, 미취학은 3.1%순이었다 (Table 1).
조사대상자에게는 면접 전 연구의 목적과 방법에 대해 충분히 설명하고, 연구 참여에 대한 동의를 구한 후 동의서 에 서명을 받았다. 또한 미성년자에게는 부모님에게도 동
Table 1. General characteristics of participants in the cognitive interview
Total (n = 32)
Men (n = 16)
Woman (n = 16) Age (Mean ± SD) 43.0 ± 25.91) 42.9 ± 27.3 43.1 ± 25.3 Age group
≤65 21 (65.6)2) 10 (62.5) 11 (68.8)
>65 11 (34.4) 6 (37.5) 5 (31.2)
Education
No education 1 ( 3.1) 1 ( 6.2) 0 ( 0.0) Elementary school 9 (28.1) 5 (31.2) 4 (25.0) Middle school 7 (21.9) 3 (18.7) 4 (25.0) High school 5 (15.6) 1 ( 6.2) 4 (25.0) College/University or higher 10 (31.3) 6 (37.4) 4 (25.0) 1) Mean ± SD (Standard deviation) 2) n (%)
의를 구한 후 서명을 받았다. 이 연구의 IRB는 단국대학교 기관생명윤리위원회를 통해 승인되었다 (승인번호 DKU 2014-04-034). 대상자의 특성을 파악하기 위해 연령, 성별, 직업, 교육수준의 간단한 설문 조사를 실시 한 후 인지조사 지침서에 준하여 약 1시간 정도로 진행하였다. 조사는 일 대일 심층 면접으로 진행되었으며 설문응답자가 설문 문 항을 한 개씩 읽어나가면서 각 질문에 포함된 용어나 전체 적인 의미구성에 대해서 질문하고 확인해나가는 방식으 로 진행되었다.22-25설문 응답자가 큰 소리로 질문을 읽게 하고 그때 떠오르는 생각이나 의문들을 설명하게 하고 (think-aloud techniques), 다른 용어를 사용해서 그 의미를 표현하도록 하며 (verbal probing techniques) 응답자들이 설문문항에 사용된 용어들과 설문도구 전체의 맥락을 어 떻게 이해하고 있는지를 파악하였다. 또한 혼동되거나 모 호한 질문은 없는지, 질문을 응답함에 있어 어려움이 없이 잘 대답할 수 있도록 설정되었는지 등의 조사를 통하여 설 문지 문항에 대한 적합도를 평가하였다. 면접 조사자는 조 사대상자의 동의하에 면접내용을 모두 녹음하였고, 녹음 된 내용을 모두 듣고 기록하였다. 기록된 내용을 토대로 조 사대상자들의 응답에서 공통점과 상이점을 찾아내고 각 문항의 문제점을 분석하였다.
신뢰도 평가
인지조사 대상자들을 대상으로 조사-재조사 방법에 의 한 조사 문항의 신뢰도 평가를 실시하였다. 신뢰도 검증방 법은 1차와 2차 조사 결과에 대한 일치도를 우연에 의한 일 치를 보정한 값 (chance adjusted measure)인 Cohen의 Kappa와 weighted Kappa를 이용하여 평가하였다. 분석은 통계 프로그램인 SAS 9.3을 이용하였다. 각 Kappa 값의 95%의 신뢰구간을 제시하였으며 Kappa의 통계적 검정은 ASE (Asymptotic Standard Error) under Kappa = 0 값을 가지고 단측 검정으로 평가하였다. 대상자가 모두 ‘예’라고 답변한 문항인 ‘저녁식사 여부’와 행과 열의 수가 같지 않 아 Kappa값이 적절하지 않은 문항인 ‘구강문제 관련 주변 환경’, ‘소금섭취 줄이기에 대한 인식’, ‘저녁식사 시간’, ‘아 침식사 소요시간’, ‘점심식사 소요시간’, ‘저녁식사 소요시 간’은 일부 분석에서 제외되었다.
Cohen의 Kappa값에 대한 평가는 Landis과 Koch26이 제 시한 기준을 이용하였다. 이 기준에 따르면 Kappa값이 0.2 미만인 경우 낮은 일치도, 0.2~0.4 미만인 경우에는 보통의 일치도, 0.4~0.6 미만인 경우에는 약간 높은 일치도, 0.6~0.8 미만인 경우에는 높은 일치도, 0.8이상인 경우는 거의 완벽한 일치도를 보이는 것으로 평가되었다.
설문 문항 확정
최종 문항에 대해서는 질병관리본부 국민건강영양조사 영양조사 담당자 및 영양분과위원회의 회의 및 검토를 통 해 확정되었다.
결 과
식생활 조사 항목과 관련된 국내외 문헌 고찰을 기반 으로 국민건강영양조사에 활용 가능한 식생활 조사 추 가 항목 개발
고찰된 국내외 식생활 조사 항목들과 국민건강영양조사 식생활 조사 항목을 비교·검토하여 국민건강영양조사에서 조사하고 있지 않는 식생활 관련 항목 총 21개를 도출하였 다 (Table 2). 도출된 항목을 식사의 균형성, 다양성, 적절 성과 관련된 항목별로 분류한 결과, 식사의 균형성에서는 문헌고찰에서 도출된 항목으로 편식 여부의 항목이 있었 고, 다양성 영역에서는 국외 조사 항목 검토에서 도출된 항 목으로 식이 보충제 복용 여부, 특수 식품 섭취 여부, 거부 하는 식품 여부 및 이유의 항목이 포함되었다. 절제성 영역 으로는 식생활 지침서, 국외 조사, 문헌 고찰 모두에서 항 목들이 포함되었는데, 적당한 식사량의 인식 및 조절, 소금 (나트륨) 섭취 인식도, 섭취 절제 여부, 특별한 이유로 식이 조절 여부, 저염식, 저지방식, 고열량저영양식품 섭취 감소 여부, 가당 음료 섭취 빈도, 디카페인 음료 섭취 여부, 튀김 이나 볶음 요리 섭취 빈도 항목이 포함되었다. 그 밖에 기 타로서 식품 위생의 인식, 충분한 식사시간 여부, 식사 속 도, 식생활 지침 인지 및 실천 여부, 주관적인 자가 식사 평 가, 건강한 생활 실천 인지 및 실천 여부, 식사예절의 인지, 식품 알레르기 여부와 그 종류, 국민건강증진종합계획 인 지 여부, 사회심리적 요인관련 식행태가 포함되었다.
전문가 포커스 그룹 조사 및 수요도 조사
문헌 고찰을 근거로 도출된 식생활 조사 후보 항목에 대 해서 연구진 내부 회의와 전문가 포커스 그룹 조사를 통해 지표의 측정 타당성, 중요도, 활용도를 고려하여 총 8개의 식생활 항목이 선정되었다. 선정된 식생활 조사 항목으로 는 소금 및 나트륨 섭취, 가당 음료 섭취, 카페인 음료 섭취, 식생활 지침 인식 및 실천, 식사시간 및 식사 속도, 거부 식 품, 식생활 정보 경로, 국민건강증진종합계획 인지 여부였 다. 식생활 조사와 관련된 학회 회원들을 대상으로, 선정된 8개의 식생활 조사 항목 중 조사 필요성에 대한 우선순위 를 분석한 결과, 소금 및 나트륨 섭취 인지 여부가 가장 순 위가 높았으며, 다음으로는 가당 음료 섭취 여부, 카페인 음료 섭취 여부, 식생활 지침 인지 및 실천 여부, 충분한 식
사시간 확보여부 및 식사속도, 거부하는 식품의 유무와 그 이유, 식생활 정보를 얻는 경로, 국민건강증진종합계획 인 지여부 순으로 나타났다 (Table 3).
식생활 조사 항목의 문항개발 및 전문가 대상 안면 타 당도 평가
안면 타당도 평가는 총 두 차례로 평가가 이루어졌다.
1차 평가에서는 전문가 포커스 그룹 조사 및 수요도 조사
결과에서 선정된 8개의 항목 중에서 조사 필요성 및 타당 성에 대한 전문가 의견의 합의가 있는 항목을 도출한 결과, 소금 및 나트륨 섭취, 가당 및 단순당 섭취, 충분한 식사시 간 확보 및 식사속도, 아동 및 청소년에 한하여 카페인 음 료 섭취가 선정되었다. 더불어 아동 및 청소년과 노인은 2012년부터 새로 도입된 식품섭취빈도조사 (FFQ)의 조사 대상자에서 제외되었기 때문에 식생활 조사에서 이에 대 한 보완의 필요성이 제안되었다. 특히 노인의 경우 식품 구 매에 관련된 조사가 필요함이 제안되었다.
1차 평가결과를 근거로 소금 및 나트륨 섭취, 가당 및 단 순당 섭취, 충분한 식사시간 확보 및 식사속도에 대한 항목 은 전체를 대상으로 조사하는 것으로 결정하였으며 아동 및 청소년 대상으로는 카페인 음료 섭취, 간식 및 건강한 식품섭취 항목을 추가하고 노인 대상으로는 섭취 제한, 간 식 및 건강한 식품섭취 항목을 추가하였다.
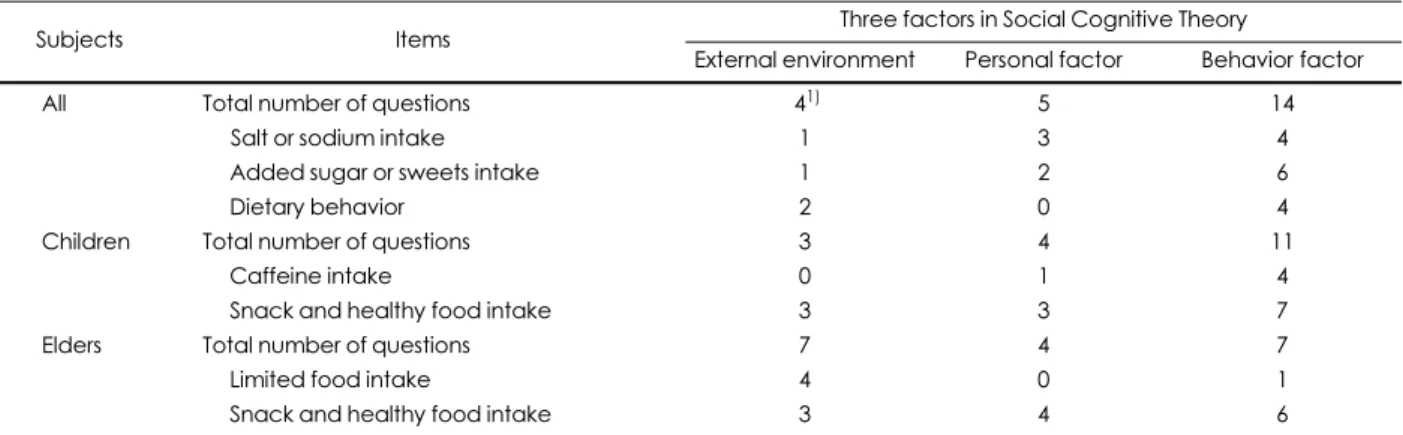
각 조사 항목에 대한 문항 개발은 생태학적 모델을 사회 인지이론에 적용하여 환경, 개인적 요인, 행동의 세 영역으 로 구성하였다. 구성된 문항 중 전체 대상으로 개발된 소금 및 나트륨 섭취, 가당 및 단순당 섭취, 충분한 식사시간 확 보 및 식사속도의 항목에서 환경영역에 포함되는 문항은 총 4문항, 개인적 요인 영역은 총 5문항, 행동영역은 총 14 문항이었다. 아동을 대상으로 개발된 카페인 음료 섭취, 간
Table 2. Candidates of survey items that are not included in the Korea National Health and Nutrition Examination Survey based on the literature review
Dimension Items from dietary guideline Items from international national survey Items from literatures
Balance Unbalanced diet intake
Variety Reason of supplement use
Special food intake Reasons of food avoidance Moderation Perception of the control of portion
size
Perception of moderate amount of diet Perception of sodium intake
Compliance with low-salt eating Dietary control by special reason Intake frequency of fried or roasted food
Compliance with low fat diet Perception of salt or sodium intake Intake frequency of processed food intake
Compliance with low energy dense and nutrient poor food intake
Intake frequency of added-sugar beverage
De-caffeinated beverage consumption
Others Perception of food hygiene Enough time to eat Eating speed
Compliance with healthy eating Compliance with and perception of dietary guideline
Compliance with healthy lifestyle Subjective evaluation of dietary intake Perception of table manners Perception of healthy lifestyle and nutrition
knowledge
Food allergy and type of food allergy Perception of national health promotion plan
Dietary behavior related to psychosocial factor
Table 3. Result of need assessment of dietary behavior items for Korea National Health and Nutrition Examination Survey
Ranking Score1)
1. Salt and sodium intake 114
2. Added sugar beverage intake 80
3. Caffeine beverage intake (included energy drink) 38 4. Perception and compliance of dietary guideline 38 5. Enough time to eat and eating speed 33 6. Avoidant food and reasons of food avoidance 32 7. Ways to get the health and dietary information 18 8. Perception of national health promotion plan 10 1) 5 items for multiple-response were scored by ranking of priority for the survey item (1st= 5 points, 2nd= 4 points, 3rd= 3 points, 4th= 2 points, 5th= 1 point).
식 및 건강한 식품섭취 항목에서는 환경영역은 총 3문항, 개인적 요인 영역은 총 4문항, 행동영역은 총 11문항이었 다. 노인을 대상으로 개발된 섭취제한, 간식 및 건강한 식 품섭취 항목에서는 환경영역은 총 7문항, 개인적 요인 영 역은 총 4문항, 행동영역은 총 7문항이었다 (Table 4).
추가로 포함된 조사 항목의 타당성 및 항목별로 개발된 조사 문항들을 평가하기 위해 실시된 2차 안면 타당도가 평가 결과를 근거로 문항을 수정하였고, 또한 국민건강영 양조사에 적용 가능한 질문 형식과 단어, 보기 문항에 대해 추가 검토하여 수정 보완하였다.
인지조사
인지조사를 통하여 아동, 성인, 노인으로 나누어 각 문항 에 대한 이해도를 평가하였고, 잘못된 이해에 대한 답변 관 련 내용은 문항 보완의 근거로 사용되었다. 인지조사를 통 한 개발 문항의 이해도에서는 소금 및 나트륨 섭취 관련 문항 일부 (‘평상 시 음식의 간은 어느 정도를 좋아하십니 까?’, ‘식당 또는 급식에서 저염식이 제공된다면 저염식을 선택하겠습니까?’)를 제외하고는 아동, 성인, 노인 모두 모 든 항목에서 70%이상 이해하고 있는 것으로 나타났다. 아 동 및 청소년 대상 문항에서는 80~100%의 이해도를 보였 고, 노인 대상 문항에서는 75~100%의 이해도를 보여 각 생애주기별 문항의 이해도가 높았다.
이해도가 가장 낮게 나온 문항으로는 ‘식당 또는 급식에 서 저염식이 제공된다면 저염식을 선택하겠습니까?’로 이 해도가 낮은 이유는 ‘저염식의 의미를 모르겠다’가 가장 많 은 답변이었다. 이러한 결과에 따라 저염식을 싱겁게 조리 된 음식으로 표현을 바꾸었다. 다음으로 이해도가 낮게 나 온 문항으로는 ‘평상시 음식의 간은 어느 정도를 좋아하십 니까?’로 이해도가 낮은 이유로는 ‘평상시에 어느 정도의 간으로 먹는지’로 잘못 이해하는 경우가 있었다. ‘평상시
음식의 간은 어느 정도를 좋아하십니까?’의 문항은 개인적 요인 영역인 인식에 대한 문항이었는데, 섭취에 대한 행동 영역으로 이해하고 대답하는 것으로 나타났다. 따라서 조 사지침서에 조사 시 좋아하는 정도를 물어보는 질문이라 는 것을 조사자가 부연 설명하도록 조사 지침서에 기술하 였다.
신뢰도 평가
신뢰도는 전체, 아동, 노인, 성인 대상의 문항으로 구분하 여 평가하였다. 전체를 대상으로 하는 조사 항목의 공통 질 문에서 낮은 일치도를 보여준 문항은 없었으며, 보통의 일 치도를 보인 문항은 ‘싱겁게 먹을 수 있는 주변 환경 (κ = 0.38)’, ‘물 대신 가당 음료를 섭취하려는 빈도 (κ = 0.36)’,
‘차와 전통음료 섭취빈도 (κ = 0.40)’로 나타났다. 전체 공 통 문항에서 노인 대상에서는 ‘싱겁게 먹을 수 있는 환경 (κ = -0.22)’, ‘소금 섭취 줄이기에 대한 노력 (κ = -0.15)’,
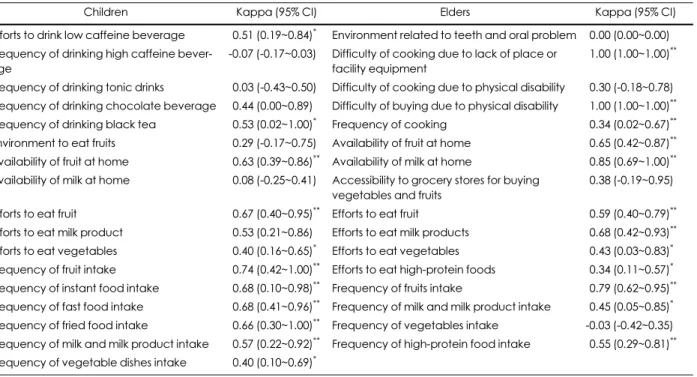
‘탄산음료 섭취 빈도 (κ = -0.05)’ 문항이 일치도가 없는 것 으로 나타났으며, ‘물 대신 가당음료를 섭취하려는 빈도 (κ = 0.14)’, ‘식사를 빨리 해야 하는 경우의 빈도 (κ = 0.13)’의 문항이 낮은 일치도를 보였다 (Table 5). 생애주기별 문항 에서, 아동만을 대상으로 한 문항에서 일치도를 보이지 않 은 문항은 ‘고카페인 음료의 섭취 빈도 (κ = -0.07)’, ‘강장 음료의 섭취 빈도 (κ = 0.03)’, ‘집에서 유제품의 유용성 (κ = 0.08)’으로 나타났다. 노인만을 대상으로 한 문항에서
‘채소반찬 섭취 빈도 (κ = -0.03)’를 제외하고는 모두 보통 이상의 일치도를 보였다 (Table 6).
설문 문항 확정
전문가 대상으로 안면 타당도를 거쳐 일반인 대상의 인 지조사 및 신뢰도 평가를 통해 수정 보완된 문항들은 국 민영양조사 영양조사 담당자 및 영양분과 위원회의 회의
Table 4. The number of questions for dietary behavior items developed by social cognitive theory
Subjects Items Three factors in Social Cognitive Theory
External environment Personal factor Behavior factor
All Total number of questions 41) 5 14
Salt or sodium intake 1 3 4
Added sugar or sweets intake 1 2 6
Dietary behavior 2 0 4
Children Total number of questions 3 4 11
Caffeine intake 0 1 4
Snack and healthy food intake 3 3 7
Elders Total number of questions 7 4 7
Limited food intake 4 0 1
Snack and healthy food intake 3 4 6
1) All values are number of questions.
Table 5. Reliability of dietary behavior questionnaires for all subjects
All All Children Adult Elders
Kappa (95% CI) Kappa (95% CI) Kappa (95% CI) Kappa (95% CI) Environments to eat unsalty food 0.38 (0.06~0.71)* 0.62 (-0.04~1.00)* 0.78 (0.39~1.00)** -0.22 (-0.73~0.29) Preference for a salty taste 0.70 (0.50~0.90)** 0.72 (0.38~1.00)** 0.85 (0.67~1.00)** 0.44 (0.02~0.86)* Perception of low-salt eating 0.51 (0.14~0.88)** 0.80 (0.44~1.00)** 0.00 (0.00~0.00) 0.00 (0.00~0.00) Efforts to eat low-salt food 0.59 (0.27~0.91)** 1.00 (1.00~1.00)** 0.41 (-0.18~1.00) -0.15 (-0.37~0.07) Choice of low-salt food 0.77 (0.53~1.00)** 1.00 (1.00~1.00)** 0.78 (0.39~1.00)** 0.56 (0.06~1.00)* Level of salt intake 0.75 (0.57~0.93)** 0.31 (-0.32~0.94) 0.68 (0.37~0.99)** 1.00 (1.00~1.00)**
Soy sauce use for fried food 0.75 (0.61~0.88)** 0.87 (0.69~1.00)** 0.76 (0.57~0.96)** 0.49 (0.23~0.75)**
Soup intake during meal time 0.56 (0.33~0.79)** 0.43 (-0.06~0.91)* 0.68 (0.34~1.00)** 0.52 (0.10~0.93)**
Frequency of salty food intake 0.60 (0.37~0.83)** 0.62 (0.21~1.00)** 0.74 (0.42~1.00)** 0.41 (0.02~0.80)* Environments related to added-sugar
beverages
0.64 (0.42~0.86)** 0.59 (0.23~0.95)** 0.83 (0.61~1.00)** 0.30 (0.05~0.55)
Preference for sweetness 0.68 (0.50~0.87)** 0.89 (0.68~1.00)** 0.76 (0.54~0.98)** 0.48 (0.16~0.81)**
Frequency of drinking water instead of added sugar beverages
0.36 (0.14~0.58)** 0.37 (-0.08~0.82) 0.25 (-0.11~0.61) 0.14 (-0.20~0.48)
Frequency of soda intake 0.61 (0.39~0.83)** 0.53 (0.16~0.89)** 0.68 (0.51~0.85)** -0.05 (-0.15~0.04) Frequency of coffee intake 0.78 (0.61~0.95)** 0.71 (0.51~0.91)** 0.85 (0.62~1.00)** 0.59 (0.22~0.95)**
Frequency of fruit juice intake 0.67 (0.44~0.90)** 0.76 (0.43~1.00)** 0.57 (0.22~0.91)** 0.49 (0.17~0.80)* Frequency of sports drink intake 0.67 (0.42~0.92)** 0.77 (0.44~1.00)** 0.53 (0.24~0.82)** 0.52 (0.14~0.90)**
Frequency of fruit flavored beverages 0.57 (0.34~0.81)** 0.76 (0.45~1.00)** 0.39 (-0.11~0.88)* 0.42 (0.05~0.78)* Frequency of tea and traditional bever-
ages
0.40 (0.15~0.66)** 0.61 (0.23~1.00)** 0.39 (0.00~0.78)** 0.22 (-0.06~0.50)
Enough time to eat breakfast 0.50 (0.29~0.70)** 0.47 (0.13~0.81)* 0.53 (0.15~0.90)* 0.33 (-0.02~0.69)* Frequency of eating fast 0.54 (0.24~0.84)** 0.67 (0.33~1.00)** 0.55 (0.12~0.98)* 0.13 (-0.29~0.55)
*p-value < 0.05 **p-value < 0.01
Table 6. Reliability of dietary behavior questionnaire for children and elders
Children Kappa (95% CI) Elders Kappa (95% CI)
Efforts to drink low caffeine beverage 0.51 (0.19~0.84)* Environment related to teeth and oral problem 0.00 (0.00~0.00) Frequency of drinking high caffeine bever-
age
-0.07 (-0.17~0.03) Difficulty of cooking due to lack of place or facility equipment
1.00 (1.00~1.00)**
Frequency of drinking tonic drinks 0.03 (-0.43~0.50) Difficulty of cooking due to physical disability 0.30 (-0.18~0.78) Frequency of drinking chocolate beverage 0.44 (0.00~0.89) Difficulty of buying due to physical disability 1.00 (1.00~1.00)**
Frequency of drinking black tea 0.53 (0.02~1.00)* Frequency of cooking 0.34 (0.02~0.67)**
Environment to eat fruits 0.29 (-0.17~0.75) Availability of fruit at home 0.65 (0.42~0.87)**
Availability of fruit at home 0.63 (0.39~0.86)** Availability of milk at home 0.85 (0.69~1.00)**
Availability of milk at home 0.08 (-0.25~0.41) Accessibility to grocery stores for buying vegetables and fruits
0.38 (-0.19~0.95)
Efforts to eat fruit 0.67 (0.40~0.95)** Efforts to eat fruit 0.59 (0.40~0.79)**
Efforts to eat milk product 0.53 (0.21~0.86) Efforts to eat milk products 0.68 (0.42~0.93)**
Efforts to eat vegetables 0.40 (0.16~0.65)* Efforts to eat vegetables 0.43 (0.03~0.83)* Frequency of fruit intake 0.74 (0.42~1.00)** Efforts to eat high-protein foods 0.34 (0.11~0.57)* Frequency of instant food intake 0.68 (0.10~0.98)** Frequency of fruits intake 0.79 (0.62~0.95)**
Frequency of fast food intake 0.68 (0.41~0.96)** Frequency of milk and milk product intake 0.45 (0.05~0.85)* Frequency of fried food intake 0.66 (0.30~1.00)** Frequency of vegetables intake -0.03 (-0.42~0.35) Frequency of milk and milk product intake 0.57 (0.22~0.92)** Frequency of high-protein food intake 0.55 (0.29~0.81)**
Frequency of vegetable dishes intake 0.40 (0.10~0.69)*
*p-value < 0.05 **p-value < 0.01
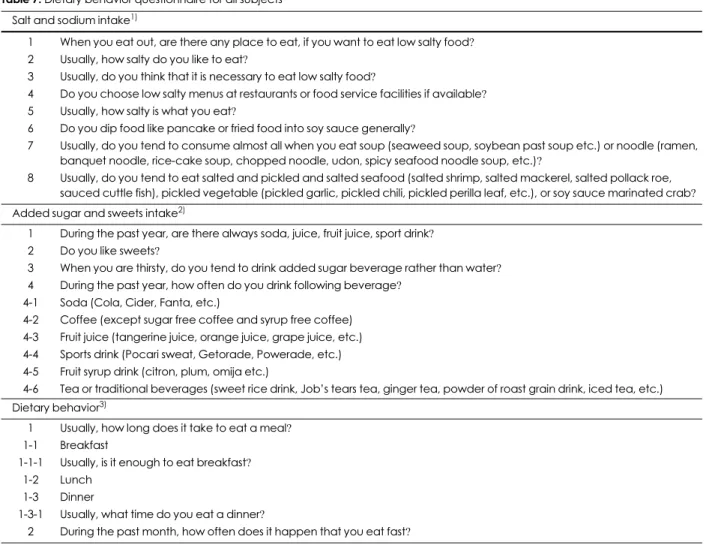
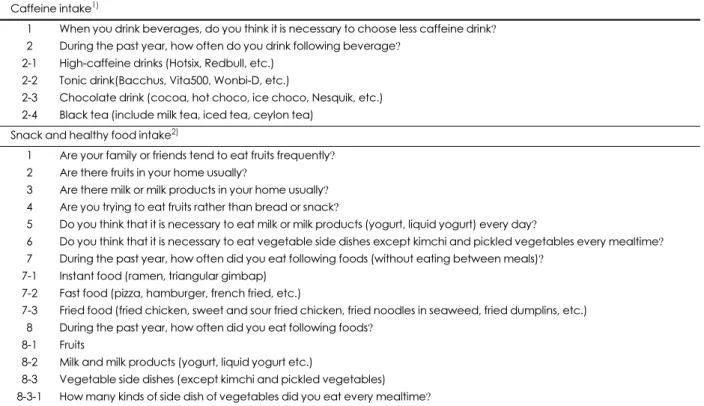
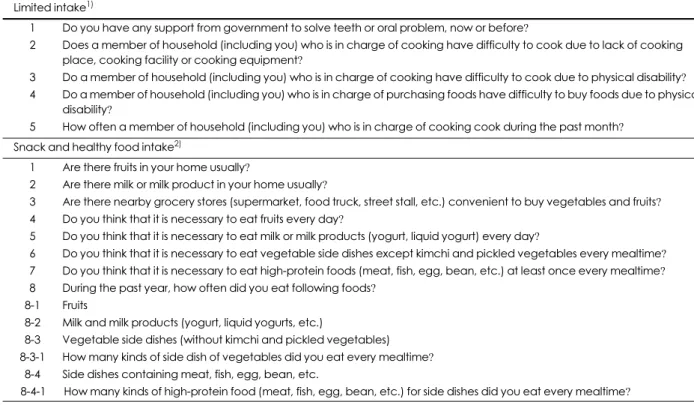
검토를 통해 확정되었으며, 확정된 문항은 Table 7, 8, 9와 같다.
고 찰
국민 식생활에 대한 모니터링은 국민건강영양조사 자료 를 기반으로 상당한 부분이 이루어져 왔으나, 영양조사를 통한 식생활 조사는 식품 및 영양소 섭취량 위주의 평가 중 심으로 이루어져 있어 만성질환에 관련된 식생활 요인과 이에 대한 추이를 파악하기에 일부 제한점이 있었다. 이에 본 연구에서는 국민건강영양조사에서 현재 조사되고 있
는 식생활 조사 항목의 확대 및 개편을 위하여 변화하고 있 는 국민 식생활 패턴이 반영되면서 국가 정책의 평가 지표 로 활용될 수 있는 식생활 조사항목을 국민건강영양조사 에 활용 가능할 수 있도록 개발하였다.
국민건강증진종합계획의 수립방향의 설정에 따르면 건 강결정요인인 건강행동, 보건의료서비스제공환경, 사회물 리적환경요인의 개선을 사업과제에 적용하여 건강수명 연장을 목표의 하나로 선정하였다. 이렇듯 건강증진을 위 한 건강한 식생활 개선을 위한 주요 전략으로 식생활 환경 변화를 강조하고 있다. 건강 증진과 밀접한 환경에는 일반 적으로 물리적, 경제적, 정치적, 사회문화적 환경이 포함된
Table 7. Dietary behavior questionnaire for all subjects Salt and sodium intake1)
1 When you eat out, are there any place to eat, if you want to eat low salty food? 2 Usually, how salty do you like to eat?
3 Usually, do you think that it is necessary to eat low salty food?
4 Do you choose low salty menus at restaurants or food service facilities if available?
5 Usually, how salty is what you eat?
6 Do you dip food like pancake or fried food into soy sauce generally?
7 Usually, do you tend to consume almost all when you eat soup (seaweed soup, soybean past soup etc.) or noodle (ramen, banquet noodle, rice-cake soup, chopped noodle, udon, spicy seafood noodle soup, etc.)?
8 Usually, do you tend to eat salted and pickled and salted seafood (salted shrimp, salted mackerel, salted pollack roe, sauced cuttle fish), pickled vegetable (pickled garlic, pickled chili, pickled perilla leaf, etc.), or soy sauce marinated crab?
Added sugar and sweets intake2)
1 During the past year, are there always soda, juice, fruit juice, sport drink? 2 Do you like sweets?
3 When you are thirsty, do you tend to drink added sugar beverage rather than water?
4 During the past year, how often do you drink following beverage? 4-1 Soda (Cola, Cider, Fanta, etc.)
4-2 Coffee (except sugar free coffee and syrup free coffee) 4-3 Fruit juice (tangerine juice, orange juice, grape juice, etc.) 4-4 Sports drink (Pocari sweat, Getorade, Powerade, etc.) 4-5 Fruit syrup drink (citron, plum, omija etc.)
4-6 Tea or traditional beverages (sweet rice drink, Job’s tears tea, ginger tea, powder of roast grain drink, iced tea, etc.) Dietary behavior3)
1 Usually, how long does it take to eat a meal?
1-1 Breakfast
1-1-1 Usually, is it enough to eat breakfast? 1-2 Lunch
1-3 Dinner
1-3-1 Usually, what time do you eat a dinner?
2 During the past month, how often does it happen that you eat fast?
1) For salt or sodium Intake 1,3,4,8 items, response options were: (a) yes, (b) no, (c) don’t know. For 2,5 items, response options were: (a) No salty, (b) Less salty, (c) Average (d) a little salty, (e) salty. For 6,7 items, response options were: (a) hardly, (b) sometimes, (c) usually, (d) often, (e) always. 2) For Added Sugar or Sweetness Intake 1 items, response options were: (a) hardly, (b) irregularly, (c) always. For 2 items, response options were: (a) yes, (b) no, (c) don’t know. For 3 items, response options were: (a) hardly, (b) sometimes, (c) usually, (d) often, (e) always. For 4-1-6) items, response options were: (a) hardly, (b) once a month, (c) 2-3 a month (d) once a week, (e) 2-3 a week, (f) 5-6 a week, (g) once a day, (h) twice a day, (i) three times a day. 3) For Added Meal Behavior 1-(1-3) items, response options were: (a) don’t eat, (b) ○○ minutes. For 1-1-1 items, response options were: (a) yes, (b) no, (c) don’t know. For 1-3-1 items, response options were: at ○○:○○. For 2 item, response options were: (a) less than once a week, (b) 1-3 times a week, (c) 4-6 times a week, (d) once a month, (e) more than twice (total ○○ times)
다. 이는 건강한 선택을 할 수 있는 기회의 유용성을 제공 하는 물리적 환경, 건강한 선택을 하기 위한 비용과 관련된 경제적 환경, 건강한 선택에 영향을 미치는 규칙과 법령을 의미하는 정치적 환경, 건강한 행동 선택과 수행에 영향을 미치는 주관적, 서술적인 규범, 건강한 행동을 취하는데 있 어서의 사회적지지, 건강하지 않은 습관에 개입하도록 하 는 사회적 압력과 같은 사회적문화적 환경 등이 해당된 다.27이와 같은 환경들은 물론 식생활 변화에도 같은 영향 을 미친다.28최근 식생활 개선을 위하여 식생활 환경 개선 을 위한 다양한 사업들이 진행됨에 따라 식생활 환경 개선 에 대한 인식도 평가는 사업 효과 평가에 필수적이라고 할 수 있겠다.
최근 행동 변화에 영향을 주는 요인 분석 및 프로그램 개 발을 위해서 생태학적 모델 (ecological framework)을 적 용하고 있는데,28이러한 적용은 세 가지의 핵심 원칙을 담 고 있다. 첫째, ‘사람들이 알고 생각하는 것이 그들의 행동 에 영향을 준다.’ 둘째, ‘지식은 필요하나 충분하지 않으면 대부분의 행동변화를 유도할 수 없다.’ 셋째, ‘인식, 동기부 여, 기술, 사회 환경은 행동의 중요한 영향요인이다.’29제5
기 국민건강영양조사 식생활 조사항목30을 생태학적 모델 과 비교해본 결과 개인적 요인에 해당하는 지식과 인식 관 련 조사 항목으로는 식사 빈도, 외식, 식이보충제, 영양교 육 및 상담이 포함될 수 있었고, 개인적 요인에서 행동 기 술에 해당되는 항목으로 영양표시관련 항목이 있었으며 사회적 환경요인으로 가족 및 동료와의 네트워크에 관련 된 항목으로 동반식사여부가 해당되었다. 또한 거시적 수 준의 정치적 환경 관련 요인으로 식생활 지원 프로그램 참 여 여부 항목이 포함되어 있었다.
생태학적 모델에서 강조되듯이 행동 변화는 각 요인이 별개로 영향을 주기 보다는 서로 상호작용을 통하여 영향 을 미치므로 하나의 식행동에 있어서 다수준의 요인이 고 려되어야 한다. 그러나 기존의 국민건강영양조사의 식생 활 조사 항목들은 수준별로 평가되고 있지 않아 정책 적용 에 일부 제한이 있을 수 있다. 따라서 이 연구에서는 개인 요인과 환경요인을 함께 고려하는 생태학적 모델을 근거 로 정책에서도 활용 가능할 수 있도록 각 식생활 조사 항목 별로 다수준의 조사 문항을 개발하고자 하였다.
개발된 소금 및 나트륨 섭취 항목에서의 조사 문항들은
Table 8. Dietary behavior questionnaire for children Caffeine intake1)
1 When you drink beverages, do you think it is necessary to choose less caffeine drink? 2 During the past year, how often do you drink following beverage?
2-1 High-caffeine drinks (Hotsix, Redbull, etc.) 2-2 Tonic drink(Bacchus, Vita500, Wonbi-D, etc.)
2-3 Chocolate drink (cocoa, hot choco, ice choco, Nesquik, etc.) 2-4 Black tea (include milk tea, iced tea, ceylon tea)
Snack and healthy food intake2)
1 Are your family or friends tend to eat fruits frequently?
2 Are there fruits in your home usually?
3 Are there milk or milk products in your home usually? 4 Are you trying to eat fruits rather than bread or snack?
5 Do you think that it is necessary to eat milk or milk products (yogurt, liquid yogurt) every day?
6 Do you think that it is necessary to eat vegetable side dishes except kimchi and pickled vegetables every mealtime? 7 During the past year, how often did you eat following foods (without eating between meals)?
7-1 Instant food (ramen, triangular gimbap) 7-2 Fast food (pizza, hamburger, french fried, etc.)
7-3 Fried food (fried chicken, sweet and sour fried chicken, fried noodles in seaweed, fried dumplins, etc.) 8 During the past year, how often did you eat following foods?
8-1 Fruits
8-2 Milk and milk products (yogurt, liquid yogurt etc.)
8-3 Vegetable side dishes (except kimchi and pickled vegetables) 8-3-1 How many kinds of side dish of vegetables did you eat every mealtime?
1) For caffeine intake 1 item, response options were: (a) yes, (b) no, (c) don’t know. For 2-(1-4) items, response options are: (a) hardly, (b) once a month, (c) 2-3 a month (d) once a week, (e) 2-3 a week, (f) 5-6 a week, (g) once a day, (h) twice a day, (i) three times a day.
2) For snack and healthy food intake 1,5,6 items, response options were: (a) yes, (b) no, (c) don’t know. For 2, 3 items, response options were: (a) hardly, (b) irregularly, (c) always. For 4 item, response options were: (a) hardly, (b) sometimes, (c) usually, (d) often, (e) always.
For 7-(1-3) and 8-(1-3) items, response options were: (a) hardly, (b) once a month, (c) 2-3 a month (d) once a week, (e) 2-3 a week, (f) 5- 6 a week, (g) once a day, (h) twice a day, (i) three times a day. For 8-3-1 item, response options were: ○○ dishes.
최근 나트륨 저감화 사업의 사회·물리적 환경 평가지표나 정책 개발에 활용될 수 있을 것으로 사료된다.31,32가당 및 단순당 섭취영역에서는 음료를 세분화하여 섭취의 기호 를 파악할 수 있도록 질문33,34을 구성하여 만성질환에 대 한 당 음료의 섭취 영향을 일부 파악할 수 있을 것으로 기 대된다. 또한 아동 및 청소년의 다소비 식품 중 음료류가 높은 비중을 차지하고 있고, 카페인 음료의 섭취가 증가하 고 있는 것이 문제가 되고 있으므로35,36아동 및 청소년 대 상의 음료섭취 문항을 추가하여 이를 파악하도록 하였다.
식사행태영역에서는 빠른 식사속도가 비만에 영향을 미 친다는 연구결과에 따라37,38 현대인의 식사속도에 대한 추이를 파악하고 이에 대한 사회 환경의 영향을 분석할 수 있을 것으로 생각된다.
아동 및 청소년, 노인대상과 같은 영양 취약계층에 대 한 건강한 식품 섭취의 모니터링은 중요하다. 그러나 국 민건강영양조사의 식품섭취빈도조사의 대상이 만 18세 부터 64세로 바뀌면서 이들의 장기적인 식품섭취패턴의 파악이 어려워졌다. 이에 이 연구에서는 아동 및 청소년 과 노인 대상으로 부족하기 쉬운 채소 및 과일, 우유 및 유
제품, 단백질 급원 식품 섭취에 대한 별도 문항을 추가하 여 보건복지부의 식생활 지침과 국민건강증진종합계획 의 목표 평가를 위한 지표로 활용될 수 있도록 하였다. 노 인 대상으로 별도 개발된 추가 항목으로는 거동의 불편으 로 인한 식품의 접근성을 고려39,40하여 관련된 환경 영역의 문항을 개발하였고 이는 국민건강영양조사의 식품안정성 문항과 연결하여 노인복지정책에 적용할 수 있을 것으로 사료된다.
요 약
본 연구는 국민건강영양조사의 식생활 조사영역에서 만 성질환의 요인을 파악할 수 있는 항목의 개발 및 보완의 필 요성이 제기됨에 따라 국내 및 국외에서 실시하고 있는 식 생활 조사항목을 고찰하였다. 고찰된 결과를 기반으로 국 민 식생활 패턴이 반영되면서 국가 정책의 평가 지표로 활 용될 수 있는 식생활 조사항목을 국민건강영양조사에서 활용 가능하도록 개발하였다. 연구결과를 요약하면 다음 과 같다.
Table 9. Dietary behavior questionnaire for elders Limited intake1)
1 Do you have any support from government to solve teeth or oral problem, now or before?
2 Does a member of household (including you) who is in charge of cooking have difficulty to cook due to lack of cooking place, cooking facility or cooking equipment?
3 Do a member of household (including you) who is in charge of cooking have difficulty to cook due to physical disability?
4 Do a member of household (including you) who is in charge of purchasing foods have difficulty to buy foods due to physical disability?
5 How often a member of household (including you) who is in charge of cooking cook during the past month? Snack and healthy food intake2)
1 Are there fruits in your home usually?
2 Are there milk or milk product in your home usually?
3 Are there nearby grocery stores (supermarket, food truck, street stall, etc.) convenient to buy vegetables and fruits? 4 Do you think that it is necessary to eat fruits every day?
5 Do you think that it is necessary to eat milk or milk products (yogurt, liquid yogurt) every day?
6 Do you think that it is necessary to eat vegetable side dishes except kimchi and pickled vegetables every mealtime? 7 Do you think that it is necessary to eat high-protein foods (meat, fish, egg, bean, etc.) at least once every mealtime? 8 During the past year, how often did you eat following foods?
8-1 Fruits
8-2 Milk and milk products (yogurt, liquid yogurts, etc.)
8-3 Vegetable side dishes (without kimchi and pickled vegetables) 8-3-1 How many kinds of side dish of vegetables did you eat every mealtime?
8-4 Side dishes containing meat, fish, egg, bean, etc.
8-4-1 How many kinds of high-protein food (meat, fish, egg, bean, etc.) for side dishes did you eat every mealtime?
1) For limited intake, 1,2,3,4 items response options were: (a) yes, (b) no. For 5 item, response options were: (a) less than once a week, (b) 1-3 times a week, (c) 4-6 times a week, (d) once a month, (e) more than twice (total ○○ times). 2) For snack and healthy food intake, 1,2 items response options were: (a) hardly, (b) irregularly, (c) always. For 3 item, response options were: (a) yes, (b) no. For 4,5,6,7 items, response options were: (a) yes, (b) no, (c) don’t know. For 8-(1-4) items, response options were: (a) hardly, (b) once a month, (c) 2-3 a month (d) once a week, (e) 2-3 a week, (f) 5-6 a week, (g) once a day, (h) twice a day, (i) three times a day. For 8-3-1, 8-4-1 items, response options were: ○○ dishes.
1) 개발 및 보완된 식생활조사항목은 국내외 식생활 관 련 연구 및 정책에서 사용한 식생활 조사항목을 고찰한 결 과를 기반으로 후보 항목을 도출하였고, 전문가 포커스 그 룹 조사 및 수요도 조사를 통해 검토되어 8개의 식생활 조 사 항목이 선정되었다.
2) 전문가 포커스 그룹 조사 및 수요도 조사 결과에서 선 정된 8개의 조사 항목 중에서 조사 필요성 및 타당성에 대 해 전문가 의견의 합의가 있는 항목을 최종 선정한 결과, 전체 대상으로는 소금 및 나트륨 섭취, 가당 및 단순당 섭 취, 충분한 식사시간 확보 및 식사속도에 대한 항목이 선정 되었고, 아동 및 청소년 대상에서는 전체 대상 조사 항목에 추가적으로 카페인 음료 섭취, 간식 및 건강한 식품섭취 항 목이 추가되었고, 노인 대상에서는 섭취 제한, 간식 및 건 강한 식품섭취 항목이 추가되었다.
3) 최종 선정된 식생활 조사 항목별 설문 문항을 구성하 기 위하여 생태학적 모델을 기반으로 한 사회인지이론에 적용하여 각 조사 항목별로 환경, 개인적 요인, 행동의 영 역으로 구분하여 문항을 개발하였다.
4) 개발된 식생활 조사 항목별 설문 문항은 학계 전문가 들을 대상으로 안면 타당도를 검증하였고 일반인을 대상 으로 인지조사를 통해 이해도 평가와 신뢰도 평가를 측정 한 결과 적합한 것으로 나타났다.
5) 최종적으로 국민건강영양조사 영양조사 담당자 및 영양분과위원회의 회의 및 검토를 통하여 설문문항이 확 정되었다.
이 연구에서 개발된 조사 문항의 활용성을 높이기 위한 제언은 다음과 같다. 첫째, 개발된 조사 영역 중 국민건강 영양조사 대상자로 pilot study를 수행하여 신뢰도 및 타당 도가 높게 나타난 영역부터 우선적으로 적용될 수 있으며 향후 우선순위에 따라 순환 조사를 할 수 있다. 둘째, 식생 활 조사 시, 각 영역별의 환경, 개인적 요인, 행동 문항은 같 이 조사하여 서로 문항 간의 상관성 및 유효성에 대한 검토 가 필요할 것이다. 셋째, 개발된 신규 조사 문항은 현재 중 요한 영양 이슈 중심의 항목으로 개발되었으므로 향후 추 가적인 영양문제로 새로운 항목 개발 시에도 좀 더 구체적 인 원인 파악을 위해서는 생태학적 모델을 적용한 문항을 이용하여 현황을 파악하고, 그 결과를 근거로 정책 마련에 활용해야 하겠다.
References
1. Kim HR. Nutrition transition and shifting diet linked non-commu- nicable diseases and policy issues. Health Welfare Policy Forum 2013; 198: 27-37.
2. Shim JE, Kim JH, Nam GY, Paik HY, Moon HK, Kim YO. Com- parative analysis and evaluation of dietary intakes of Koreans by age groups: (3) Risk factors for chromic degenerative diseases.
Korean J Nutr 2002; 35(1): 78-89.
3. McCullough ML, Feskanich D, Stampfer MJ, Giovannucci EL, Rimm EB, Hu FB, Spiegelman D, Hunter DJ, Colditz GA, Willett WC. Diet quality and major chronic disease risk in men and women: moving toward improved dietary guidance. Am J Clin Nutr 2002; 76(6): 1261-1271.
4. Kim MK, Kim K, Kim CI, Oh K, Oh YJ, Choi BY. The current sta- tus and the perspectives of nutrition survey. Korean J Epidemiol 2007; 29(2): 111-128.
5. World Health Organization. Diet, nutrition and the prevention of chronic diseases. World Health Organ Tech Rep Ser 2003; 916: i- viii, 1-149.
6. Centers for Disease Control and Prevention (US). National health and nutrition examination survey 2011-12 [Internet]. Hyattsville (MD): National Center for Health Statistics; 2013 [cited 2014 Jan 5]. Available from: http://wwwn.cdc.gov/nchs/nhanes/search/
nhanes11_12.aspx.
7. Centers for Disease Control and Prevention (US). 2012 behavioral risk factor surveillance system questionnaire [Internet]. Atlanta (GA): Centers for Disease Control and Prevention; 2012 [cited 2014 Jan 5]. Available from: http://www.cdc.gov/brfss/question- naires/pdf-ques/2012_BRFSS.pdf.
8. Department of Health (GB). Diet and nutrition survey of infants and young children, 2011 [Internet]. London: Department of Health; 2013 [cited 2014 Aug 13]. Available from: https://www.
gov.uk/government/publications/diet-and-nutrition-survey-of- infants-and-young-children-2011.
9. Department of Health (GB). National diet and nutrition survey:
headline results from years 1 and 2 (combined) of the rolling pro- gramme 2008-9 - 2009-10 [Internet]. London: Department of Health; 2011 [cited 2014 Jan 5]. Available from: https://www.
gov.uk/government/publications/national-diet-and-nutrition-sur- vey-headline-results-from-years-1-and-2-combined-of-the-rolling- programme-2008-9-2009-10.
10. Statistics Canada. Canadian community health survey (CCHS) cycle 2.2 nutrition: Questionnaire [Internet]. Ottawa: Statistics Canada; 2005 [cited 2014 Jan 5]. Available from: http://www23.
statcan.gc.ca/imdb/p3Instr.pl?Function=getInstrumentList&Item_
Id=33187&UL=1V&.
11. National Institute of Health and Nutrition (JP). National health and nutrition survey Japan, 2004 [Internet]. Tokyo: National Institute of Health and Nutrition; 2004 [cited 2014 Jan 5]. Available from:
http://www0.nih.go.jp/eiken/english/.
12. Australian Bureau of Statistics. Australian health survey 2011-13 (AHS) [Internet]. Sydney: Australian Bureau of Statistics; 2012 [cited 2014 Jan 5]. Available from: http://www.abs.gov.au/websit- edbs/d3310114.nsf/home/australian+health+survey.
13. Korea Centers for Disease Control and Prevention. 2013 commu- nity health survey [Internet]. Cheongwon: Korea Centers for Dis- ease Control and Prevention; 2014 [cited 2014 Aug 13]. Available from: https://chs.cdc.go.kr/chs/index.do.
14. Ministry of Education; Korea Centers for Disease Control and Pre- vention. The 9th (2013) Korean youth risk behavior online survey [Internet]. Seoul: Ministry of Education; 2013 [cited 2014 Aug
13]. Available from: http://yhs.cdc.go.kr/.
15. Korea Centers for Disease Control and Prevention. Korean genome and epidemiology study (KoGES) [Internet]. Cheong- won: Korea Centers for Disease Control and Prevention; 2014 [cited 2014 Aug 13]. Available from: http://www.cdc.go.kr/CDC/
contents/CdcKrContentView.jsp?cid=24606&viewType= CDC&
menuIds=HOME001-MNU1136-MNU1223-MNU1348.
16. Korea Rural Economic Institute. 2013 consumer behavior survey for food [Internet]. Seoul: Korea Rural Economic Institute; 2013 [cited 2014 Aug 13]. Available from: http://foodsurvey.krei.re.kr/
board/primitive_data.
17. Story M, Kaphingst KM, Robinson-O'Brien R, Glanz K. Creating healthy food and eating environments: policy and environmental approaches. Annu Rev Public Health 2008; 29(1): 253-272.
18. Park YS, Lee JW, Seo JS, Lee BK, Lee HS, Lee SK. Nutrition edu- cation & counseling, 5th revision. Paju: Kyomunsa; 2013.
19. Baranowski T, Perry CL, Parcel GS. How individuals, environ- ments, and health behavior interact: social cognitive theory. In:
Glanz K, Lewis FM, Rimer BK, editors. Health Behavior and Health Education: Theory, Research, and Practice, 2nd edition.
San Francisco (CA): Jossey-Bass; 1997. p.153-178.
20. Booth SL, Sallis JF, Ritenbaugh C, Hill JO, Birch LL, Frank LD, Glanz K, Himmelgreen DA, Mudd M, Popkin BM, Rickard KA, St Jeor S, Hays NP. Environmental and societal factors affect food choice and physical activity: rationale, influences, and leverage points. Nutr Rev 2001; 59(3 Pt 2): S21-S39.
21. Glanz K, Sallis JF, Saelens BE, Frank LD. Healthy nutrition envi- ronments: concepts and measures. Am J Health Promot 2005;
19(5): 330-333.
22. Willis GB. Cognitive interviewing - a "how to" guide. Research Triangle Park (NC): Research Triangle Institute; 1999.
23. Fowler FJ. Getting beyond pretesting and cognitive interviews: the case for more experimental pilot studies. In: Presser S, Rothged JM, Couper MP, Lessler JT, Martin E, Martin J, editors. Question- naire Development Evaluation and Testing Methods. New York (NY): John Wiley; 2004. p. 109-130.
24. Madans J, Miller K, Maitland A, Willis G. Question evaluation methods: contributing to the science of data quality. Hoboken (NJ):
John Wiley & Sons; 2011.
25. Jobe JB, Mingay DJ. Cognitive research improves questionnaires.
Am J Public Health 1989; 79(8): 1053-1055.
26. Landis JR, Koch GG. The measurement of observer agreement for categorical data. Biometrics 1977; 33(1): 159-174.
27. Brug J. Determinants of healthy eating: motivation, abilities and environmental opportunities. Fam Pract 2008; 25 Suppl 1: i50-i55.
28. Swinburn B, Egger G, Raza F. Dissecting obesogenic environ- ments: the development and application of a framework for identi- fying and prioritizing environmental interventions for obesity.
Prev Med 1999; 29(6 Pt 1): 563-570.
29. Washington State Department of Health (US). Nutrition & physi- cal activity plan: policy & environmental approach. Olympia (WA): Washington State Department of Health; 2008.
30. Ministry of Health and Welfare, Korea Centers for Disease Control and Prevention. Korea Health Statistics 2012: Korea National Health and Nutrition Examination Survey (KNHANES V-3) [Internet]. Cheongwon: Korea Centers for Disease Control and Prevention; 2013 [cited 2014 Aug 13]. Available from: https://
knhanes.cdc.go.kr/knhanes/index.do.
31. Kim HJ, Paik HY, Lee SY, Shim JE, Kim YS. Salt usage behaviors are related to urinary sodium excretion in normotensive Korean adults. Asia Pac J Clin Nutr 2007; 16(1): 122-128.
32. Ahn SH, Kwon JS, Kim K, Yoon JS, Kang BW, Kim JW, Heo S, Cho HY, Kim HK. Study on the eating habits and practicability of guidelines for reducing sodium intake according to the stage of change in housewives. Korean J Community Nutr 2012; 17(6):
724-736.
33. Bjelland M, Lien N, Grydeland M, Bergh IH, Anderssen SA, Ommundsen Y, Klepp KI, Andersen LF. Intakes and perceived home availability of sugar-sweetened beverages, fruit and vegeta- bles as reported by mothers, fathers and adolescents in the HEIA (HEalth In Adolescents) study. Public Health Nutr 2011; 14(12):
2156-2165.
34. Hedrick VE, Savla J, Comber DL, Flack KD, Estabrooks PA, Nsiah-Kumi PA, Ortmeier S, Davy BM. Development of a brief questionnaire to assess habitual beverage intake (BEVQ-15):
sugar-sweetened beverages and total beverage energy intake. J Acad Nutr Diet 2012; 112(6): 840-849.
35. Park S, Sherry B, Foti K, Blanck HM. Self-reported academic grades and other correlates of sugar-sweetened soda intake among US adolescents. J Acad Nutr Diet 2012; 112(1): 125-131.
36. Davis JN, Whaley SE, Goran MI. Effects of breastfeeding and low sugar-sweetened beverage intake on obesity prevalence in His- panic toddlers. Am J Clin Nutr 2012; 95(1): 3-8.
37. Sinn DH, Shin DH, Lim SW, Kim KM, Son HJ, Kim JJ, Rhee JC, Rhee PL. The speed of eating and functional dyspepsia in young women. Gut Liver 2010; 4(2): 173-178.
38. Thivel D, Aucouturier J, Isacco L, Lazaar N, Ratel S, Doré E, Meyer M, Duché P. Are eating habits associated with physical fit- ness in primary school children? Eat Behav 2013; 14(1): 83-86.
39. Wolfe WS, Olson CM, Kendall A, Frongillo EA Jr. Understanding food insecurity in the elderly: a conceptual framework. J Nutr Educ 1996; 28(2): 92-100.
40. Suh Y, Seok YH, Chung YJ. Relationship of dietary self-efficacy and illness beliefs, perceived benefits and perceived barriers for the reduction of sodium intake in the elderly. Korean J Nutr 2012;
45(4): 324-335.