CONTENTS
Ⅰ. INTRODUCTION
Ⅱ. MATERIALS AND METHODS
Ⅲ. RESULTS
Ⅳ. DISCUSSION
Ⅴ. CONCLUSIONS REFERENCES KOREAN ABSTRACT
Ⅰ. INTRODUCTION
Saliva plays a major role in the maintenance of oral health by exhibiting multiple host defense functions.
1,2)Saliva is important for maintenance of oral hard and soft tissues, mastication, degluti- nation, digestion, tasting, control of oral microbial colonization, and speech articulation.
2)The presence or absence of saliva impacts our daily activities.
Dry mouth (xerostomia) is a common clinical complaint with a variety of causes and compli- cations.
3)This xerostomic condition is primarily found among the elderly
4), though it is now generally accepted that salivary function is well preserved throughout life in healthy individuals.
1)A number of systemic conditions, drugs, and radiation therapies may, via their effects on the salivary glands, induce a reduction in the flow of saliva. The
systemic disorders may be of an organic or functional nature. Prominent among the organic causes are autoimmune diseases such as Sjögren's syndrome, irradiation, possibly depression, dehydration, and debilitation. Drugs and decreased mastication are examples of functional disorders.
4)Patients suffering from xerostomia may complain of oral burning sensation, ulceration or soreness, difficulty in swallowing, and poor denture retention.
5)These difficulties may lead to inadequate nutrition and a general decline in quality of life.
6)Some investigators have observed a positive correlation between the perception of dryness and a reduction in the production of saliva.
4,7)Data from previous studies indicate that dry mouth is noted that when the flow rate of unstimulated whole saliva approaches 0.1 ml/min.
4)It is well known, however, that some patients who complain of dry mouth do not show evidence of decreased salivary flow.
8,9)In others, the converse is true.
5,8,9)Therefore, objective examination techniques are necessary for diagnosis and treatment of the xerostomic patient.
Objective examination techniques for quantifying saliva production/gland function include sialometry directly measuring the flow of whole saliva or saliva derived from the individual salivary glands
Quantification of Salivary Gland Scan Image and its Correlation with Salivary Flow Rate
Sung-Hun Kim, D.D.S., Youn-Joong Kim, D.D.S.,M.S.D.,Ph.D., Sung-Chang Chung, D.D.S.,M.S.D.,Ph.D.
Department of Oral Medicine and Oral Diagnosis, College of Dentistry, Seoul National University
and other tests such as sialochemistry, salivary scintigraphy, sialography, computed tomography (CT), and biopsy.
Dry mouth is a multiglandular condition wherein the overall flow of saliva is seriously impaired.
Thus, the determination of the flow rate of whole saliva is essential to confirm its diagnosis. The previous studies suggested that the subjective feeling of oral dryness was most closely correlated with the flow of unstimulated rater than stimulated saliva.
7,8,10)Scintigraphy is primarily a function test although the method also provides some information on the structure and topography of the major salivary glands.
11)Scintigraphy with
99mTc-technetium pertechnetate (Tc-99) is a readily available, minimally invasive, valuable diagnostic test used to evaluate salivary gland function. The scintigraphy has been used in the diagnosis of a variety of salivary gland dysfunctions, including Sjögren's syndrome, Bell's palsy, sialolithiasis, gland aplasia, and duct obstruction.
12-16)However the principal limitation of the scintigraphy is the power of resolution, or lack of detail.
17)Therefore standardized quantitative salivary gland scintigraphy is said to be essential for the reliable detection of mild parenchymal malfunction.
18)Previous studies suggested that salivary flow rates made a correlation with scintigraphic findings.
16,19)However, there is no sufficient literature which report the relationship between the salivary flow rate and scintiscan images by quantitative data in normal and xerostomic groups.
The purpose of this study was to investigate the relationship between salivary flow rate and salivary gland scan by quantifying the scintiscan images of major salivary glands in xerostomic patients and normosalivaters.
Ⅱ. MATERIALS AND METHODS 1. Subjects
Among patients who visited the Department of
Oral Diagnosis, Seoul National University Dental Hospital, complaining of dry mouth, 40 patients whose unstimulated whole salivary flow rates were less than 0.2 ml/min were included (Table 1). Their ages ranged from 19 to 71 years, the mean being 44 years. Eight patients were male and 32 were female. Ten male normosalivaters without xerostomic symptoms whose unstimulated whole salivary flow rates were more than 0.3 ml/min were included as controls. They had no histories of serious illness and did not take any medications known to affect salivary flow rate for the last several months. The purpose of study and procedures of experiment were explained to them and informed consents were taken.
2. Determination of whole salivary flow rate
Whole salivary flow rates were determined through use of a standard, reproducible method.
20)Unstimulated whole salivary flow rates of the controls and patients were measured before meals or at least 2 hours after meals. During the time of measuring salivary flow rate, smoking, eating, and talking were prohibited. Unstimulated whole saliva was collected for 10 minutes through use of the spitting method (after swallowing, saliva is collected with closed lips; all saliva is then expectorated into a vessel 1 or 2 times per minute).
21)The collection was timed so that the flow rate (mL/min) could be determined.
3. Taking salivary scintigraphy
All subjects were sent to the Department of
Nuclear Medicine, Seoul National University
Hospital for salivary gland scan. A Digitrac 7500
Orbiter Camera with a low energy, high resolution
collimator(Siemens Gammasonics Inc., Illinois,
USA) was used. Patients were positioned in supine
position with necks slightly extended prior to
intravenous injection of tracer. Each patient was
slowly injected intravenously in the antecubital
fossa with approximately 444 MBq of
99mTc sodium
pertechnetate. The camera gained anterior and lateral static images of 5 minutes, 20 minutes after injection. Thirty-five minutes after injection, sour lemon candy was given to the patient and then 40 minutes after injection another images were taken.
4. Analyzing scintiscan images
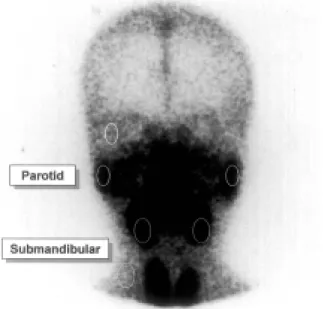
Among the images on each scintiscan, anterior view of 5 min image was used. Scintiscan images were transformed to computer file and then quantified by means of densitometer program(Tina ver 2.10, Fuji film, Tokyo, Japan). Four region of interests(ROIs) were drawn on each scintiscan image.; elliptical ROI on both parotid and submnadibular glands. Background subtraction was performed using regions superior to each parotid gland on temporal area and lateral to each submandibular gland, avoiding the subclavian vein (Fig. 1).
22)5. Statistics
Paired t-test was used for examining side-to- side difference. Student t-test was used to compare the control and patient groups. To examine the
Fig. 1. Regions of interest in scintigraphic image.
relationship between scintiscan quantification and whole salivary flow rate, Pearson's correlation test was done. The subgroups of xerostomic patients were compared by oneway ANOVA and Duncan's multiple comparison test.
Ⅲ. RESULTS
Mean values of unstimulated whole salivary flow rates in control and patient groups are shown (Table 2). In control group unstimulated whole salivary flow rate is 0.44±0.14 ml/min and in patient group, 0.07±0.06 ml/min. The side-to-side
Table 1. Subjects included
No. of subjects Mean age (years)
Patient 40 43.6 ± 17.1
Control 10 22.7 ± 1.8
Table 2. Comparison of whole salivary flow rate between control and patient groups
Salivary
flow rate Control Patient Significance UWS
(ml/min)
0.44±0.14 (n=10)
0.07±0.06
(n=40) p=0.000
UWS : unstimulated whole salivary flow rate
Table 3. Comparison of side-to-side difference in salivary gland scintiscan quantification in control and patient groups
Group Gland Rt Lt Significance
Control n=10
P 52330±15787 49959±16921 p=0.118 S 71758±14127 71296±13772 p=0.594 Patient
n=40
P 44034±21980 43161±21300 p=0.600 S 59029±17165 59159±17558 p=0.850 P : parotid gland
S : submandibular gland
Table 5. Correlation of salivary gland scintiscan quantification and unstimulated whole salivary flow rate in control and patient groups
Gland
UWS P' S' P' + S'
Control(n=10) -0.114 -0.526 -0.325
Patient(n=40) 0.382
*0.384
*0.406
***
p<0.05,
**p<0.01
UWS : unstimulated whole salivary flow rate P' : sum of right and left parotid glands S' : sum of right and left submandibular glands P' + S' : sum of P' and S'
differences in salivary gland scintiscan quantifi- cation were examined in control and patient groups (Table 3). There was no significant difference of parotid and submandibular gland quantification values between right and left sides in both control and patient groups. The parotid gland quantification values varies more than submandibular ones, especially in control group.
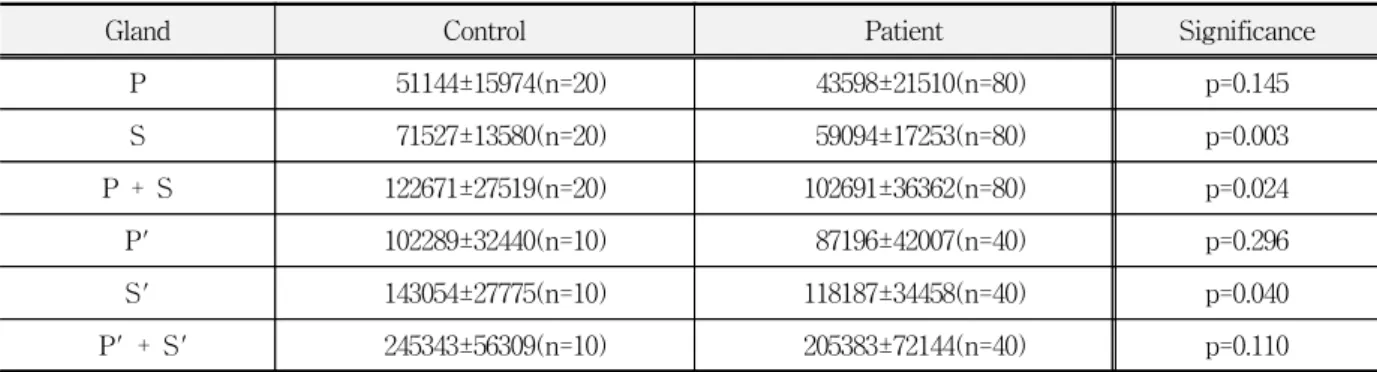
In order to compare salivary gland scintiscan quantification between control and patient groups, quantification values of parotid and submandibular
glands were compared between control and patient groups (Table 4). Quantification values of each submandibular gland, sum of each parotid and submandibular gland, and sum of both submandibular glands were significantly different (respectively, p=0.003, 0.024, 0.040). However quantification values of each parotid gland, sum of both parotid glands, and sum of both parotid and submandibular glands were not significantly different.
For investigating the relationship between salivary gland scintiscan quantification and whole salivary flow rate in control and patient groups, correlation values of salivary gland scintiscan quantification with unstimulated whole salivary flow rate are shown (Table 5). Quantification values of sum of both parotid glands, sum of both submandibular glands, and sum of both parotid and submandibular glands made positive correlation with unstimulated whole salivary flow rate in patient group, especially for those of sum of both parotid and submandibular glands. However in control group scintiscan quantification values were not significantly correlated with salivary flow rate.
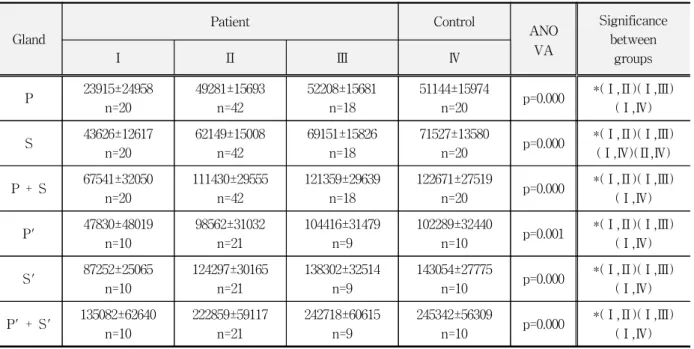
The patient group was divided into three subgroups according to the level of unstimualted Table 4. Comparison of salivary gland scintiscan quantification between control and patient groups
Gland Control Patient Significance
P 51144±15974(n=20) 43598±21510(n=80) p=0.145
S 71527±13580(n=20) 59094±17253(n=80) p=0.003
P + S 122671±27519(n=20) 102691±36362(n=80) p=0.024
P' 102289±32440(n=10) 87196±42007(n=40) p=0.296
S' 143054±27775(n=10) 118187±34458(n=40) p=0.040
P' + S' 245343±56309(n=10) 205383±72144(n=40) p=0.110
P : parotid gland S : submandibular gland
P + S : sum of parotid and submandibular glands P' : sum of right and left parotid glands
S' : sum of right and left submandibular glands
P' + S' : sum of P' and S'
Table 6. Comparison of whole salivary flow rate between controls and the subgroups of patients Salivary
flow rate
Patient Control
ANOVA Significance
between groups
Ⅰ Ⅱ Ⅲ Ⅳ
UWS (ml/min)
0.00±0.00 n=10
0.06±0.03 n=21
0.15±0.03 n=9
0.44±0.14
n=10 p=0.000 * (Ⅰ,Ⅱ)(Ⅰ,Ⅲ)(Ⅰ,Ⅳ)
(Ⅱ,Ⅲ)(Ⅱ,Ⅳ)(Ⅲ,Ⅳ)
*
p<0.05
UWS : unstimulated whole salivary flow rate
Group Ⅰ: UWS ≃ 0.00 ml/min (impossible to measure) Group Ⅱ: 0.00 ml/min < UWS ≤ 0.10 ml/min
Group Ⅲ: 0.10 ml/min < UWS ≤ 0.20 ml/min Group Ⅳ: Control group, UWS > 0.30 ml/min
Table 7. Comparison of salivary gland scintiscan quantification between controls and the subgroups of patients
Gland
Patient Control
ANO VA
Significance between
groups
Ⅰ Ⅱ Ⅲ Ⅳ
P 23915±24958
n=20
49281±15693 n=42
52208±15681 n=18
51144±15974
n=20 p=0.000 *(Ⅰ,Ⅱ)(Ⅰ,Ⅲ)
(Ⅰ,Ⅳ)
S 43626±12617
n=20
62149±15008 n=42
69151±15826 n=18
71527±13580
n=20 p=0.000 *(Ⅰ,Ⅱ)(Ⅰ,Ⅲ)
(Ⅰ,Ⅳ)(Ⅱ,Ⅳ) P + S 67541±32050
n=20
111430±29555 n=42
121359±29639 n=18
122671±27519
n=20 p=0.000 *(Ⅰ,Ⅱ)(Ⅰ,Ⅲ)
(Ⅰ,Ⅳ)
P' 47830±48019
n=10
98562±31032 n=21
104416±31479 n=9
102289±32440
n=10 p=0.001 *(Ⅰ,Ⅱ)(Ⅰ,Ⅲ)
(Ⅰ,Ⅳ)
S' 87252±25065
n=10
124297±30165 n=21
138302±32514 n=9
143054±27775
n=10 p=0.000 *(Ⅰ,Ⅱ)(Ⅰ,Ⅲ)
(Ⅰ,Ⅳ) P' + S' 135082±62640
n=10
222859±59117 n=21
242718±60615 n=9
245342±56309
n=10 p=0.000 *(Ⅰ,Ⅱ)(Ⅰ,Ⅲ)
(Ⅰ,Ⅳ)
*