ABSTRACT
Background: To evaluate the strategy for detection of prostate cancer (PCa) with low prostate specific antigen (PSA) level (2.5–4.0 ng/mL), prostate biopsy patients with low PSA were assessed. We evaluated the risk of low PSA PCa and the strategy for screening low-PSA patients.
Methods: We retrospectively analyzed the patients who underwent prostate biopsy with low PSA level. Baseline characteristics, PSA level before prostate biopsy, prostate volume, prostate specific antigen density (PSAD), and pathological data were assessed.
Results: Among the 1986 patients, 24.97% were diagnosed with PCa. The PSAD was 0.12 ± 0.04 ng/mL2 in the PCa-diagnosed group and 0.10 ± 0.04 ng/mL2 in non-cancer-diagnosed group (P < 0.001). Of the 496 patients diagnosed with PCa, 302 (60.89%) were in the intermediate- or high-risk group. PSAD was 0.13 ± 0.04 ng/mL2 in the intermediate- or high- risk group and 0.11 ± 0.03 ng/mL2 in the very low- and low-risk group (P < 0.001). Of 330 patients who underwent radical prostatectomy, 85.15% were diagnosed as having significant cancer. There was significant correlation between PSAD and PCa (r = 0.294, P < 0.001).
PSAD with a specificity of 80.00% of a clinically significant cancer diagnosis was assessed at 0.1226 ng/mL2.
Conclusion: The PCa detection rate in the low-PSA group was not lower than that of previous studies of patients with PSA from 4.0 to 10.0 ng/mL. Further, it may be helpful to define a strategy for PCa detection using PSAD in the low-PSA group.
Keywords: Prostatic Neoplasms; Prostate-Specific Antigen; Diagnosis; Biopsy
INTRODUCTION
Serum prostate specific antigen (PSA) and digital rectal examination (DRE) are widely used for prostate cancer (PCa) screening. These examinations are suitable for screening because they are easy to perform and are inexpensive. However, in early stage PCa, the detection rate by DRE is very low, and the optimal PSA cut-off value has not yet been established.1 PSA has traditionally recommended biopsy at > 4 ng/mL.2 On the other hand, many studies have reported that the traditional PSA cut-off (> 4 ng/mL) value is too high, and significant PCa have been detected even at a PSA level less than 4 ng/mL. For the first time, Littrup et al.3 reported that the PSA cut-off value should be reduced to 3.0 ng/mL. Thereafter, many studies
Original Article
Received: Apr 5, 2020 Accepted: Aug 20, 2020 Address for Correspondence:
Seong Soo Jeon, MD, PhD
Department of Urology, Samsung Medical Center, Sungkyunkwan University School of Medicine, 81 Irwon-ro, Gangnam-gu, Seoul 06351, Korea.
E-mail: [email protected]
© 2020 The Korean Academy of Medical Sciences.
This is an Open Access article distributed under the terms of the Creative Commons Attribution Non-Commercial License (https://
creativecommons.org/licenses/by-nc/4.0/) which permits unrestricted non-commercial use, distribution, and reproduction in any medium, provided the original work is properly cited.
ORCID iDs Jae Hoon Chung
https://orcid.org/0000-0002-9729-3457 Jiwoong Yu
https://orcid.org/0000-0003-2147-2915 Wan Song
https://orcid.org/0000-0003-0971-1805 Minyong Kang
https://orcid.org/0000-0002-6966-8813 Hyun Hwan Sung
https://orcid.org/0000-0001-9845-3742 Hwang Gyun Jeon
https://orcid.org/0000-0002-5613-8389 Byong Chang Jeong
https://orcid.org/0000-0002-5399-2184 Seong IL Seo
https://orcid.org/0000-0002-9792-7798 Hyun Moo Lee
https://orcid.org/0000-0003-3969-4540
Jae Hoon Chung , Jiwoong Yu , Wan Song , Minyong Kang ,
Hyun Hwan Sung , Hwang Gyun Jeon , Byong Chang Jeong , Seong IL Seo , Hyun Moo Lee , and Seong Soo Jeon
Department of Urology, Samsung Medical Center, Sungkyunkwan University School of Medicine, Seoul, Korea
Strategy for Prostate Cancer Patients with Low Prostate Specific Antigen Level (2.5 to 4.0 ng/mL)
Urology
Seong Soo Jeon
https://orcid.org/0000-0002-3265-6261 Funding
This research was supported by the National Research Foundation of Korea (NRF) grant funded by the Korea government (MSIT) (NRF- 2020R1A2C2007662).
Disclosure
The authors have no potential conflicts of interest to disclose.
Author Contributions
Conceptualization: Jeon SS. Data curation:
Yu J. Formal analysis: Chung JH. Funding acquisition: Jeon SS. Methodology: Jeon HG, Jeong BC. Project administration:
Song W, Jeon HG, Jeong BC, Seo SI, Lee HM. Resources: Song W, Seo SI, Lee HM.
Supervision: Jeon SS. Writing - original draft:
Chung JH. Writing - review & editing: Kang M, Sung HH.
have reported that the PSA cut-off level should be reduced to 2.5 ng/mL.4,5 In particular, Kim et al.,6 reported that the detection rate of PCa and significant PCa was not different between PSA levels of 2.5–4.0 ng/mL and 4.0–10.0 ng/mL. Prostate cancer is detected at a rate of about 26% in American men with PSA levels between 2.5 and 4.0 ng/mL.7 Moreover, Kobayashi et al.8 reported a cancer detection rate of 23.6% for Japanese men with PSA levels between 2.0 and 4.0 ng/mL.
However, There are no previous studies evaluating the characteristics of patients with PCa who have PSA level less than 4.0 ng/mL (≥ 2.5 ng/mL). The efficiency of detection for prostate cancer in the patients with PSA between 2.5–4.0 ng/mL will be improved when their oncological parameters, including baseline characteristics, prostate cancer incidence and pathologic outcomes, are evaluated.
In this study, patients who had underwent prostate biopsy for PCa and presented a 2.5 to 4.0 ng/mL PSA were evaluated. We evaluated the risk of low PSA PCa and a strategy for screening of low-PSA patients.
METHODS
Patients
From January 2008 to December 2018, we retrospectively analyzed 2,204 patients who underwent prostate biopsy at a single center with PSA level of 2.5 ng/mL to less than 4.0 ng/
mL. Patients were excluded from the study if they had a history of PSA greater than 4.0 ng/
mL, had previously undergone prostate surgery such as transurethral prostate resection, or had received 5-alpha reductase inhibitors.
Clinicopathological parameters
To evaluate the baseline characteristics, age at prostate biopsy, body mass index, hypertension (HTN), diabetes mellitus (DM), serum PSA level before prostate biopsy, prostate volume (measured by transrectal ultrasonography or magnetic resonance imaging [MRI]), prostate specific antigen (PSAD), and history of prostate biopsy were evaluated. For analysis of needle biopsy specimens, we evaluated the positive core ratio of all biopsy cores, the largest tumor area among needle biopsies, and the Gleason score. The pathologic results of prostate specimen, the presence of significant cancer, and Gleason score upgrading ratio were also assessed in the patients who underwent radical prostatectomy. In addition, the correlation between PSAD and PCa and the cut-off value of PSAD were evaluated.
Classification
The biopsy results were classified into very low- or low-risk and intermediate- or high-risk groups (≥ T2b-T2c or ≥ Gleason score 3 + 4, PSA ≥ 10 ng/mL or percentage of positive biopsy cores ≥ 50%) according to the National Comprehensive Cancer Network classification (Reference, National Comprehensive Cancer Network classification, NCCN guidelines Version 4.2018 prostate cancer). Patients who underwent RP were classified as having significant cancer (tumor volume greater than 0.5 cm3 or ≥ Gleason score 3 + 4 or positive extracapsular extension) based on the results of pathology reports.9
Statistical analysis
The groups were compared using the χ2 test for categorical variables and Student's t-test for continuous variables. Pearson correlation was performed to evaluate the association between PSAD and PCa. Statistical analyses were carried out with SPSS® (version 21.0), and all two- sided P < 0.05 were considered statistically significant.
Ethics statement
The study was performed in agreement with applicable laws and regulations, good clinical practices, and ethical principles as described in the Declaration of Helsinki. The Institutional Review Boards of the Samsung Medical Center approved the present study (approval No.
2019-06-138). Informed consent was waived by the board.
RESULTS
Patients who had underwent prostate biopsy
Of the total 2,204 patients, 1,986 were enrolled in this study after patients based on exclusion criteria. Among 1,986 patients, 496 (24.97%) were diagnosed with prostate cancer. Of these, 34 patients (6.85%) underwent active surveillance, and 330 patients (66.53%) underwent radical prostatectomy. Ninety-four patients (18.95%) received focal treatment or were lost during follow-up (Fig. 1).
The mean age of patients diagnosed with PCa was 64.48 ± 7.88 years, and the mean age of patients without PCa was 61.19 ± 8.69 years (P < 0.001). The prevalence of HTN and DM was 37.50%
and 18.95% in the PCa-diagnosed group, respectively, and 23.96% and 14.30% in non-cancer- diagnosed group (P < 0.001, P = 0.013). PSAD was 0.12 ± 0.04 ng/mL2 in the PCa-diagnosed group and 0.10 ± 0.04 ng/mL2 in the non-cancer-diagnosed group (P < 0.001) (Table 1).
Prostate cancer population
Of the 496 patients diagnosed with PCa, 302 (60.89%) were in the intermediate- or high-risk group, and 222 (44.76%) had prostate cancer with a Gleason score of 7 or more. The mean
Prostate biopsy 2.5 ≤ PSA < 4.0 ng/mL
n = 1,986
Negative
n = 1,490 (75.03%) Prostate cancer n = 496 (24.97%)
Active surveillance n = 34 (6.85%) Radical prostatectomy
n = 330 (66.53%)
Radiation therapy n = 21 (4.23%) Androgen deprivation therapy
n = 17 (3.43%) Others n = 94 (18.95%) Fig. 1. Flowchart of patients who underwent prostate biopsy (2.5 ≤ PSA< 4.0 ng/mL).
PSA = prostate specific antigen.
positive core ratio was 28.02% ± 22.91%, and the largest tumor area in the needle specimen was 33.99% ± 27.27% (Table 2).
The mean age of the intermediate- or high-risk group was 65.28 ± 7.73, while the mean age of the very low- or low-risk group was 63.24 ± 7.97 years (P = 0.005). The prevalence of HTN was 41.72% in the intermediate- or high-risk group and 30.93% in the very low- or low-risk group (P = 0.015). PSAD was 0.13 ± 0.04 ng/mL2 in the intermediate- or high-risk group and 0.11 ± 0.03 ng/mL2 in the very low- or low-risk group (P < 0.001) (Table 3).
Table 2. Pathologic outcomes of prostate biopsy (n = 496)
Pathologic outcomes Values
Positive cores, % 28.02 ± 22.91
Tumor area, % 33.99 ± 27.27
Gleason score
3 + 3 274 (55.24)
3 + 4 117 (23.59)
4 + 3 63 (12.70)
4 + 4 31 (6.25)
3 + 5 2 (0.40)
4 + 5 7 (1.41)
5 + 4 1 (0.20)
5 + 5 1 (0.20)
National Comprehensive Cancer Network classification
Very low and low risk 194 (39.11)
Data are presented as mean ± standard deviation or number (%).
Table 3. Low-risk prostate cancer according the National Comprehensive Cancer Network classification Characteristics Very low and low risk (n = 194) Intermediate or above (n = 302) P value
Age, yr 63.24 ± 7.97 65.28 ± 7.73 0.005
Hypertension 60 (30.93) 126 (41.72) 0.015a
Diabetes mellitus 33 (17.01) 61 (20.20) 0.377a
Body mass index, kg/m2 24.54 ± 2.72 24.90 ± 2.94 0.158
PSA, ng/mL 3.29 ± 0.40 3.35 ± 0.40 0.140
Prostate volume, mL 33.80 ± 11.36 28.64 ± 9.76 < 0.001
PSA density, ng/mL2 0.11 ± 0.03 0.13 ± 0.04 < 0.001
Prostate biopsy, %
Positive cores 11.20 ± 6.27 38.83 ± 23.20 < 0.001
Tumor area 14.23 ± 14.43 46.61 ± 26.03 < 0.001
No. of prostate biopsies 1.07 ± 0.25 1.04 ± 0.20 0.176
Data are presented as mean ± standard deviation or number (%).
PSA = prostate specific antigen.
Student's t-test, aχ2 test.
Table 1. Baseline characteristics of prostate biopsy patients
Characteristics Prostate cancer (n = 496) Non-cancer (n= 1,490) P value
Age, yr 64.48 ± 7.88 61.19 ± 8.69 < 0.001
Hypertension 186 (37.50) 357 (23.96) < 0.001a
Diabetes mellitus 94 (18.95) 213 (14.30) 0.013a
Body mass index,b kg/m2 24.76 ± 2.83 24.71 ± 3.06 0.776
PSA, ng/mL 3.33 ± 0.40 3.27 ± 0.42 0.006
Prostate volume, mL 30.66 ± 10.70 38.87 ± 16.09 < 0.001
PSA density, ng/mL2 0.12 ± 0.04 0.10 ± 0.04 < 0.001
No. of prostate biopsies 1.05 ± 0.22 1.05 ± 0.21 0.671
Data are presented as mean ± standard deviation or number (%).
PSA = prostate specific antigen.
Student's t-test, aχ2 test; bBody mass index: prostate cancer (n = 466), non-cancer (n = 1,027).
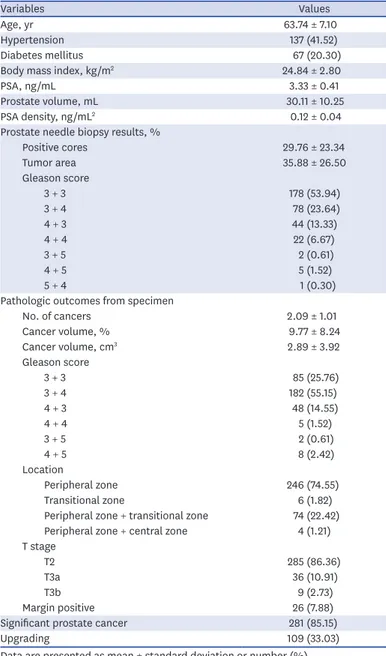
Of 330 patients who underwent radical prostatectomy, 281 (85.15%) were diagnosed as having significant cancer and 45 (13.64%) were diagnosed as T3. Of the total, 245 patients (74.24%) had a Gleason score ≥ 7, and the mean prostate cancer volume was 2.89 ± 3.92 cm3 (Table 4).
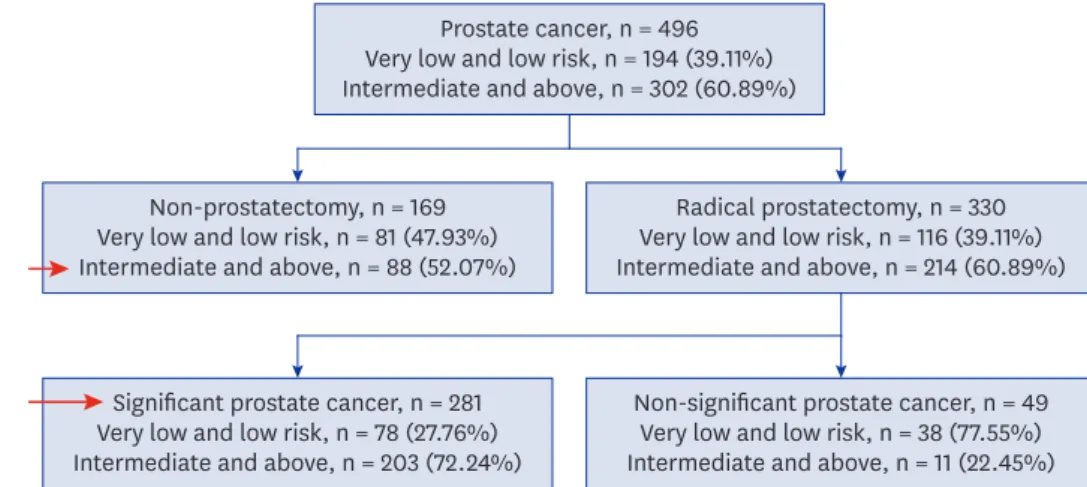
Of the 1,986 patients who underwent prostate biopsy, 369 (18.58%) (significant cancer by radical prostatectomy: 281, intermediate- or high-risk patients without prostatectomy: 88) were diagnosed as having clinically significant PCa (Fig. 2).
Correlation between PSAD and PCa
There was a statistically significant positive correlation between PSAD and PCa (r = 0.294, P <
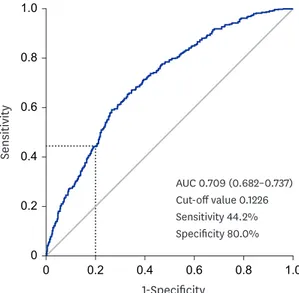
0.001) (Fig. 3). PSAD with a specificity of 80.00% for a clinically significant cancer diagnosis was assessed as 0.1226 ng/mL2 (Fig. 4).
Table 4. Patients who underwent radical prostatectomy (n = 330)
Variables Values
Age, yr 63.74 ± 7.10
Hypertension 137 (41.52)
Diabetes mellitus 67 (20.30)
Body mass index, kg/m2 24.84 ± 2.80
PSA, ng/mL 3.33 ± 0.41
Prostate volume, mL 30.11 ± 10.25
PSA density, ng/mL2 0.12 ± 0.04
Prostate needle biopsy results, %
Positive cores 29.76 ± 23.34
Tumor area 35.88 ± 26.50
Gleason score
3 + 3 178 (53.94)
3 + 4 78 (23.64)
4 + 3 44 (13.33)
4 + 4 22 (6.67)
3 + 5 2 (0.61)
4 + 5 5 (1.52)
5 + 4 1 (0.30)
Pathologic outcomes from specimen
No. of cancers 2.09 ± 1.01
Cancer volume, % 9.77 ± 8.24
Cancer volume, cm3 2.89 ± 3.92
Gleason score
3 + 3 85 (25.76)
3 + 4 182 (55.15)
4 + 3 48 (14.55)
4 + 4 5 (1.52)
3 + 5 2 (0.61)
4 + 5 8 (2.42)
Location
Peripheral zone 246 (74.55)
Transitional zone 6 (1.82)
Peripheral zone + transitional zone 74 (22.42) Peripheral zone + central zone 4 (1.21) T stage
T2 285 (86.36)
T3a 36 (10.91)
T3b 9 (2.73)
Margin positive 26 (7.88)
Significant prostate cancer 281 (85.15)
Upgrading 109 (33.03)
Data are presented as mean ± standard deviation or number (%).
PSA = prostate specific antigen.
DISCUSSION
In the present study, PCa was diagnosed in approximately 25% of prostate biopsies at PSA levels of 2.5 to 4.0 ng/mL, and clinically significant cancer was diagnosed in 18.5% of these patients. We also found that PSAD is a predictor of PCa detection in patients with low PSA (2.5 ng/mL to 4.0 ng/mL).
Prostate cancer diagnosed with PSA level of 4.0–10 ng/mL is reported in approximately 25%
of patients.10 Approximately 30% of these patients are diagnosed with T3 or T4 PCa.10,11 However, PCa is diagnosed in more than 20% of patients with PSA level less than 4.0 ng/mL.4 Therefore, it was suggested that the PSA cut-off level be lowered from 4.0 ng/mL. A cancer detection rate of 25% was also confirmed in this study.
Prostate cancer, n = 496 Very low and low risk, n = 194 (39.11%) Intermediate and above, n = 302 (60.89%)
Non-prostatectomy, n = 169 Very low and low risk, n = 81 (47.93%) Intermediate and above, n = 88 (52.07%)
Radical prostatectomy, n = 330 Very low and low risk, n = 116 (39.11%) Intermediate and above, n = 214 (60.89%)
Significant prostate cancer, n = 281 Very low and low risk, n = 78 (27.76%) Intermediate and above, n = 203 (72.24%)
Non-significant prostate cancer, n = 49 Very low and low risk, n = 38 (77.55%) Intermediate and above, n = 11 (22.45%) Fig. 2. Risk classification according to the National Comprehensive Cancer Network classification.
r = 0.294 P < 0.001 0
Prostate specific antigen density, ng/mL Significant
prostate cancer
Intermediate and above risk group prostate cancer
Very low and low risk group prostate cancer
No malignancy
0.25 0.20
0.15 0.30 0.35
0.10 0.05
Fig. 3. Correlation between prostate specific antigen density and prostate cancer.
However, when the PSA cut-off level is 4.0 ng/mL, the specificity of PCa detection is 21%
and sensitivity is 91%.12 These values lead to a high false positive rate and unnecessary prostate biopsy (negative for cancer). In addition, this may increase the complications of prostate biopsy, such as acute prostatitis.13 Moreover, patients suffer mental and physical stress.14 Lowering the PSA cut-off value is still controversial as adverse effects will increase.
In addition, there have been recent reports of problems with overdiagnosis of nonsignificant cancer and its overtreatment.15
Due to the limitations of this screening test, several diagnostic tools have been proposed to increase the sensitivity and specificity of PCa detection. Many biomarkers, such as free PSA,16 prostate health index,17 4Kscore,18 PCA3,19 select MDx,20 and ExoDX prostate,21 have been suggested. Additional test modalities were also developed to improve sensitivity and specificity, such as mpMRI and PET.22,23 However, despite these technological advances, PCa screening has not been clearly established.
Although recent efforts to reduce overdiagnosis and overtreatment of PCa have been continuing, more than 20% of patients diagnosed with PCa with a low PSA level cannot be overlooked. The strategy for cancer detection in the low PSA group (2.5 to 4.0 ng/mL) and evaluation of PCa patient characteristics with low PSA are not well known. According to Kim et al.,6 43.6% of PCa patients with a 4.0 to 10.0 ng/mL PSA level had a Gleason score of 7 or higher upon biopsy. The average cancer volume of patients undergoing radical prostatectomy was 4.68 ± 4.19 cm3, and 27.6% of them were graded as T3 or T4. In the present study, 13.64%
of patients presented with T3 and a 3.33 ± 0.41 cm3 cancer volume, but the proportion of those with a Gleason score of 7 or higher on biopsy was 44.76%, which was similar to that of PSA 4.0–10.0 ng/mL PCa patients.
The results in this study indicate a significant difference in PSAD between the group diagnosed with PCa and the group without PCa in the low PSA level group of 2.5–4.0 ng/
mL. There was a significant difference in PSAD between the very low- or low-risk group and the intermediate- or high-risk group. In addition, a significant correlation between PSAD
AUC 0.709 (0.682–0.737) Cut-off value 0.1226 Sensitivity 44.2%
Specificity 80.0%
00 0.2 0.4 0.6 1.0
1-Specificity
Sensitivity
0.8
1.0 0.8 0.6 0.4 0.2
Fig. 4. Receiver operating characteristic curve for prostate specific antigen density and clinically significant prostate cancer.
AUC = area under the curve.
and PCa was also confirmed. The efficacy of PSAD has been reported in many studies.24,25 However, the efficacy of PSAD in the low PSA group of 2.5 to 4.0 ng/mL had not been evaluated. In this study, with 80% specificity of the low PSA group and 44.2% sensitivity, the PSAD cut-off value was suggested as 0.1226 ng/mL2. Based on the recent trend of avoiding unnecessary biopsy and overtreatment, patients with 0.1226 ng/mL2 or higher PSAD in the low-PSA group (2.5 to 4.0 ng/mL) are recommended for prostate biopsy. Furthermore, in PSAD cases with level lower than 0.1226 ng/mL2, PSA follow-up or additional tests such as MP MRI, free PSA, and PCA3 are suggested to determine prostate biopsy need. In particular, PSAD has the advantage of not requiring unnecessary medical costs because it does not require additional tests, other than transrectal ultrasonography and PSA.
The limitations of this study are its retrospective nature and unintended selection biases due to data from a single institution. The results of MRI were not assessed in this study. In addition, the absence of long-term oncological outcomes such as biochemical recurrence can be another limitation. However, we examined whether biopsy should be performed in 2.5–4.0 ng/mL PSA patients. As a result, a significant strategy of biopsy in low-PSA patients was presented. The present study confirmed that the PCa detection rate in the low-PSA group of 2.5 to less than 4.0 ng/mL was not lower than that of the previous studies of patients with PSA from 4.0 to 10.0 ng/mL. Therefore, further discussion of the traditional PSA cut-off is required. In addition, if PSAD is used, it may be helpful to establish a strategy for PCa detection in the low-PSA group.
REFERENCES
1. Verma A, St Onge J, Dhillon K, Chorneyko A. PSA density improves prediction of prostate cancer. Can J Urol 2014;21(3):7312-21.
PUBMED
2. Andriole GL, Crawford ED, Grubb RL 3rd, Buys SS, Chia D, Church TR, et al. Prostate cancer screening in the randomized Prostate, Lung, Colorectal, and Ovarian Cancer Screening Trial: mortality results after 13 years of follow-up. J Natl Cancer Inst 2012;104(2):125-32.
PUBMED | CROSSREF
3. Littrup PJ, Kane RA, Mettlin CJ, Murphy GP, Lee F, Toi A, et al. Cost-effective prostate cancer detection.
Reduction of low-yield biopsies. Cancer 1994;74(12):3146-58.
PUBMED | CROSSREF
4. Catalona WJ, Smith DS, Ornstein DK. Prostate cancer detection in men with serum PSA concentrations of 2.6 to 4.0 ng/mL and benign prostate examination. Enhancement of specificity with free PSA measurements. JAMA 1997;277(18):1452-5.
PUBMED | CROSSREF
5. Schröder FH, van der Cruijsen-Koeter I, de Koning HJ, Vis AN, Hoedemaeker RF, Kranse R. Prostate cancer detection at low prostate specific antigen. J Urol 2000;163(3):806-12.
PUBMED | CROSSREF
6. Kim HS, Jeon SS, Choi JD, Kim W, Han DH, Jeong BC, et al. Detection rates of nonpalpable prostate cancer in Korean men with prostate-specific antigen levels between 2.5 and 4.0 ng/mL. Urology 2010;76(4):919-22.
PUBMED | CROSSREF
7. Babaian RJ, Fritsche H, Ayala A, Bhadkamkar V, Johnston DA, Naccarato W, et al. Performance of a neural network in detecting prostate cancer in the prostate-specific antigen reflex range of 2.5 to 4.0 ng/mL.
Urology 2000;56(6):1000-6.
PUBMED | CROSSREF
8. Kobayashi T, Nishizawa K, Ogura K, Mitsumori K, Ide Y. Detection of prostate cancer in men with prostate-specific antigen levels of 2.0 to 4.0 ng/mL equivalent to that in men with 4.1 to 10.0 ng/mL in a Japanese population. Urology 2004;63(4):727-31.
PUBMED | CROSSREF
9. Epstein JI, Walsh PC, Carmichael M, Brendler CB. Pathologic and clinical findings to predict tumor extent of nonpalpable (stage T1c) prostate cancer. JAMA 1994;271(5):368-74.
PUBMED | CROSSREF
10. Catalona WJ, Richie JP, Ahmann FR, Hudson MA, Scardino PT, Flanigan RC, et al. Comparison of digital rectal examination and serum prostate specific antigen in the early detection of prostate cancer: results of a multicenter clinical trial of 6,630 men. J Urol 1994;151(5):1283-90.
PUBMED | CROSSREF
11. Catalona WJ, Smith DS, Ratliff TL, Dodds KM, Coplen DE, Yuan JJ, et al. Measurement of prostate- specific antigen in serum as a screening test for prostate cancer. N Engl J Med 1991;324(17):1156-61.
PUBMED | CROSSREF
12. Thompson IM, Ankerst DP, Chi C, Goodman PJ, Tangen CM, Lucia MS, et al. Assessing prostate cancer risk: results from the Prostate Cancer Prevention Trial. J Natl Cancer Inst 2006;98(8):529-34.
PUBMED | CROSSREF
13. Togo Y, Yamamoto S. Prevention of infectious complications after prostate biopsy procedure. Int J Urol 2017;24(7):486-92.
PUBMED | CROSSREF
14. Fowler FJ Jr, Barry MJ, Walker-Corkery B, Caubet JF, Bates DW, Lee JM, et al. The impact of a suspicious prostate biopsy on patients' psychological, socio-behavioral, and medical care outcomes. J Gen Intern Med 2006;21(7):715-21.
PUBMED | CROSSREF
15. Kearns JT, Lin DW. Improving the specificity of PSA screening with serum and urine markers. Curr Urol Rep 2018;19(10):80.
PUBMED | CROSSREF
16. Christensson A, Björk T, Nilsson O, Dahlén U, Matikainen MT, Cockett AT, et al. Serum prostate specific antigen complexed to alpha 1-antichymotrypsin as an indicator of prostate cancer. J Urol 1993;150(1):100-5.
PUBMED | CROSSREF
17. Catalona WJ, Partin AW, Sanda MG, Wei JT, Klee GG, Bangma CH, et al. A multicenter study of [-2]pro- prostate specific antigen combined with prostate specific antigen and free prostate specific antigen for prostate cancer detection in the 2.0 to 10.0 ng/ml prostate specific antigen range. J Urol 2011;185(5):1650-5.
PUBMED | CROSSREF
18. Vickers AJ, Cronin AM, Aus G, Pihl CG, Becker C, Pettersson K, et al. A panel of kallikrein markers can reduce unnecessary biopsy for prostate cancer: data from the European Randomized Study of Prostate Cancer Screening in Göteborg, Sweden. BMC Med 2008;6(1):19.
PUBMED | CROSSREF
19. Bussemakers MJ, van Bokhoven A, Verhaegh GW, Smit FP, Karthaus HF, Schalken JA, et al. DD3: a new prostate-specific gene, highly overexpressed in prostate cancer. Cancer Res 1999;59(23):5975-9.
PUBMED
20. Leyten GH, Hessels D, Smit FP, Jannink SA, de Jong H, Melchers WJ, et al. Identification of a candidate gene panel for the early diagnosis of prostate cancer. Clin Cancer Res 2015;21(13):3061-70.
PUBMED | CROSSREF
21. Donovan MJ, Noerholm M, Bentink S, Belzer S, Skog J, O'Neill V, et al. A molecular signature of PCA3 and ERG exosomal RNA from non-DRE urine is predictive of initial prostate biopsy result. Prostate Cancer Prostatic Dis 2015;18(4):370-5.
PUBMED | CROSSREF
22. Fütterer JJ. Multiparametric MRI in the Detection of Clinically Significant Prostate Cancer. Korean J Radiol 2017;18(4):597-606.
PUBMED | CROSSREF
23. Esen T, Kilic M, Seymen H, Acar O, Demirkol MO. Can Ga-68 PSMA PET/CT replace conventional imaging modalities for primary lymph node and bone staging of prostate cancer? Eur Urol Focus 2020;6(2):218-20.
PUBMED | CROSSREF
24. Kundu SD, Roehl KA, Yu X, Antenor JA, Suarez BK, Catalona WJ. Prostate specific antigen density correlates with features of prostate cancer aggressiveness. J Urol 2007;177(2):505-9.
PUBMED | CROSSREF
25. Liu J, Wang ZQ, Li M, Zhou MY, Yu YF, Zhan WW. Establishment of two new predictive models for prostate cancer to determine whether to require prostate biopsy when the PSA level is in the diagnostic gray zone (4–10 ng ml-1). Asian J Androl 2020;22(2):213-6.
PUBMED | CROSSREF