Vol. 30, No. 2, pp. 233-242, May, 2014 http://dx.doi.org/10.7747/JFS.2014.30.2.233
Environmental Science
Estimation of Above-Ground Biomass of a Tropical Forest in Northern Borneo Using High-resolution Satellite Image
Mui-How Phua1,*, Zia-Yiing Ling1, Wilson Wong1, Alexius Korom1, Berhaman Ahmad1, Normah A. Besar1, Satoshi Tsuyuki2, Keiko Ioki2, Keigo Hoshimoto2, Yasumasa Hirata3, Hideki Saito3 and Gen Takao3
1School of International Tropical Forestry, Universiti Malaysia Sabah, Jalan UMS, 88400 Kota Kinabalu, Sabah, Malaysia
2Graduate School of Agricultural and Life Sciences, The University of Tokyo, Tokyo 113-8657, Japan
3Forestry and Forest Products Research Institute (FFPRI), Tsukuba 305-8687, Japan
Abstract
Estimating above-ground biomass is important in establishing an applicable methodology of Measurement, Reporting and Verification (MRV) System for Reducing Emissions from Deforestation and Forest Degradation-Plus (REDD+). We developed an estimation model of diameter at breast height (DBH) from IKONOS-2 image that led to above-ground biomass estimation (AGB). The IKONOS image was preprocessed with dark object subtraction and topographic effect correction prior to watershed segmentation for tree crown delineation. Compared to the field observation, the overall segmentation accuracy was 64%. Crown detection percent had a strong negative correlation to tree density. In addition, satellite-based crown area had the highest correlation with the field measured DBH. We then developed the DBH allometric model that explained 74% of the data variance. In average, the estimated DBH was very similar to the measured DBH as well as for AGB. Overall, this method can potentially be applied to estimate AGB over a relatively large and remote tropical forest in Northern Borneo.
Key Words: tree crown delineation, biomass estimation, IKONOS-2
Received: October 16, 2013. Revised: November 22, 2013. Accepted: November 23, 2013.
Corresponding author: Mui-How Phua
School of International Tropical Forestry, Universiti Malaysia Sabah, Jalan UMS, 88400 Kota Kinabalu, Sabah, Malaysia Tel: 6088-320765, Fax: 6088-320876, E-mail: [email protected]
Introduction
Tropical forest is a complex ecosystem that is rich with carbon and biodiversity (Whitemore 1984). According to FAO (2005), 13 million hectares of tropical forests were destroyed annually between 1990 and 2005. Biomass dis- tribution in tropical forest is depends on species diversity, different disturbances and survival strategies. Biomass is distributed spatially within forest areas due to the complex- ity of multi-tiered canopies, big differences in tree diameter and height, and their generally large stature. Above-ground
forest biomass estimation in tropical forests has been an im- portant input to ‘reducing emissions from deforestation and forest degradation-plus’ (REDD+), which is one of the monetary mechanisms for mitigating global warming.
Accuracy of the estimation of AGB is important for report- ing carbon stocks and carbon changes to the Kyoto Protocol (Muukkonen and Heiskanen 2007). The biomass estima- tion methods must be verifiable, specific in time and space as well as covering large area at an acceptable cost.
An alternative approach to estimate above-ground bio- mass or carbon stock is by using remote sensing technology
rather than field survey method. Usage of remote sensing technology in biomass estimation can cover relatively large area at an acceptable cost. Recently, high-resolution satellite images have been used to examine forest canopy structure using tree crown detection and delineation method (Pouliot and King 2005; Wang et al. 2004; Kubo and Muramoto 2005). Significant relationship between ground measured biomass and satellite-based crown variables have been re- ported for temperate, boreal and plantation forests (Wulder et al. 2002; Leckie et al. 2005; Hirata et al. 2009). However, such analyses are biased towards forests with low species di- versity and relatively geometrically simple crown shapes (Palace et al. 2008). Studies that examine the use of high-resolution satellite image to estimate forest structural variables have been relatively rare in tropical forest. Asner et al. (2002) found that crown diameter and area based on manual interpretation of IKONOS image were largely over-estimated from field measured crown properties of tall forest in Brazil. Nevertheless, relation between crown width and diameter at breast height (DBH) has been developed at the Amazonian forest based on crown estimation from the IKONOS image (Palace et al. 2008).
High-resolution remote sensing approach detects crown variables of upper-canopy trees that contain most of the above-ground tree biomass (Broadbent et al. 2008). As demonstrated in the Amazonian studies, high-resolution satellite remote sensing can be cost-effective approach for developing countries in the tropics because it covers rela- tively large area and is repetitive at a certain time interval.
Nevertheless, the ability of high-resolution satellite image has not yet been tested in tropical production forest with different degradation levels.
This study examined the use of high-resolution remote sensing to estimate aboveground biomass of tropical forests in Northern Borneo. We evaluated the correlations between crown variables extracted from an IKONOS-2 image (satellite-based variables) with field measured variables. We then developed allometric models to estimate DBH, which led to above-ground biomass estimation.
Materials and Methods
Study area
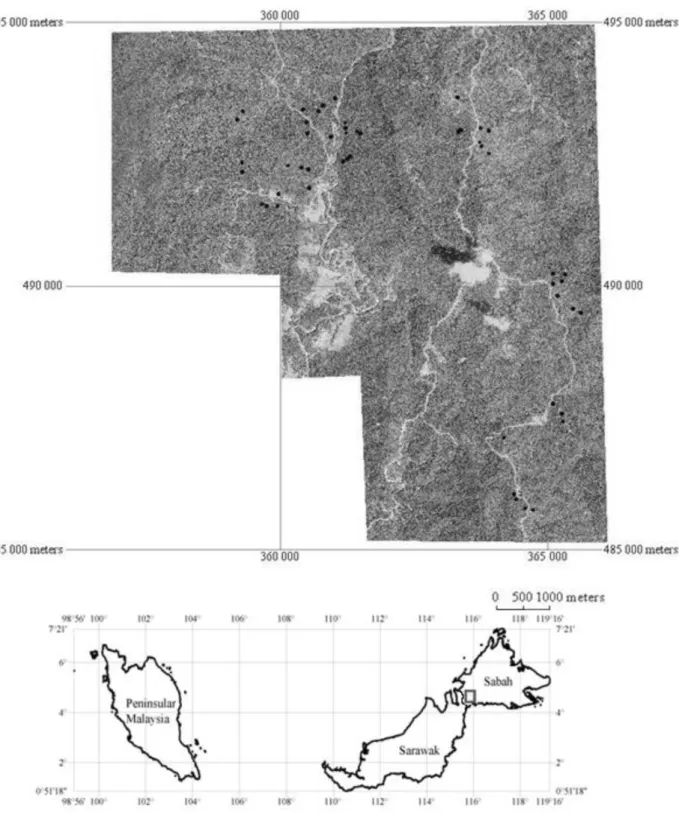
The study area is located in northern part of Borneo,
near the international border between Sabah, Malaysia and Kalimantan, Indonesia (Fig. 1). This area has hilly terrain with an altitude between 1,000-1,400 m above sea level. As such, the natural vegetation comprises hill dipterocarps and lower montane forest. Dipterocarps such as sShorea sp. has been found at high as 1,400 m at the Ulu Padas area.
However, most of the Dipterocarps have already been felled by the local people for timber (MTE). Based on inter- viewer with head of Long Mio village, most of the stateland had been logged in 1980s to early 1990s. About half of our study area is stateland, owned by Sabah state government.
Local villagers have customary right of using the land for their livelihood. The villagers usually practice slash-and- burn cultivation at the stateland.
The other half of our study area is located in a concession area of Sabah Forest Industries (SFI). SFI was established in 1983 as a government-owned company to produce pulp and paper. In 1993, SFI became a private enterprise that manages 288,623 ha of land. Of these, 183,346 ha are un- der zoning of integrated timber plantation that aims at pro- ducing materials for pulp and paper. Approximately 46,000 ha are planted with Acacia mangium and other Acaccia or Eucalyptus species as well as Acacia hybrids. The remaining 104,822 ha are managed under so-called natural forest management (NFM). These NFM areas are subject to implementation of reduced impact logging (RIL), which was recently imposed by Sabah Forestry Department.
According to the record of SFI, our study area comprises NFM area that was logged between 1997 and 2002.
Field data collection
The first field data collection was conducted in the study area in November 2011 when 5 plots with a total of 438 trees were measured. Plots (30x30 m) were established to face north direction. All trees with diameter at breast height (DBH) of 10 cm and above were measured for DBH, height, crown diameter and tree position. Two plots that consisted of very small trees, the measurements involved trees with DBH of 5 cm and above. Plot coordinates were determined by postprocessing of Differential GPS data. We dropped the crown measurement for the subsequent data collection based on a preliminary result that showed DBH as the most promising variable for AGB estimation.
Subsequent field data collection trips were conducted in
Fig. 1. The preprocessed IKONOS 2 image of the study area. Red box indicates the location of the image. Blue points are field inventory plots.
February 2012 (1,136 trees; 19 plots), July 2012 (876 trees;
10 plots) and October 2012 (1,259 trees; 16 plots). In total, 50 plots with 3,709 trees were established and measured.
About 54% (27 plots) were within NFM areas while the re- maining 23 plots were located in the stateland.
Forest degradation is classified into two categories,
which are primary and degraded forest. AGB threshold of 200 t/ha (Asner et al., 2002; Morel et al., 2012) was used to classify the plots into primary and degraded forests.
Individual tree AGB was then calculated using equations that are specific to degraded and primary forests as follows;
Wt = 0.0829 x DBH2.43··· (1) Ln(Wt) = 2.62 x ln(DBH) - 2.30 ··· (2)
where Wt is dry weight. Equation 1 for early successional forest is from Kenzo et al. (2009) while equation 2 is the modified equation of Yamakura et al. (1986) for primary forest in Kenzo et al. (2009).
Satellite image and processing
An IKONOS-2 image acquired on 28th February 2010 was used in this study. Ortho-rectification was conducted using the 30-meter resolution Digital Elevation Model of the Shuttle Radar Topography Mission (SRTM-DEM).
IKONOS-2 has four multi-spectral bands of 4-meter resolution. Its panchromatic band has a spatial resolution of 1 meter. The multi-spectral and panchromatic bands were converted to spectral radiance as conducted by Peterson (2001). The IKONOS spectral radiance () was calcu- lated as follows:
··· (3)
where, CalCoef and bandwidth are published calibration val- ues as in Peterson (2001).
Topographic effect correction
Different sun illuminations due to varying terrain’s slope angle and position result in different brightness values of the same land cover types. Topographic normalization was conducted on the IKONOS-2 image in order to reduce the topographic effect. In forest area, non-Lambertian method with Minnaert constant is preferred to the Lambertiam method (Phua and Saito 2003). The non-Lambertian mod- el is as follows (Smith et al. 1980);
··· (4)
where,
= normalized radiance on flat surface with incident angle of zero
= radiance on terrain surface e = slope angle
i = solar incident angle k = Minnaert coefficient
We used the SRTM-DEM to derive slope and aspect images. The Minnaert coefficient, k describes the surface’s bi-directional reflectance distribution function, where the scattering depends on surface roughness (Smith et al.
1980). The k varies between 0 and 1 where 1 representing perfectly diffuse reflector while small value means aniso- tropic scattering specific to the scene. Pixels of primary for- est were sampled to derive the k using linear regression analysis. A backward radiance correction model can then be developed based on the non-Lambertian assumption and Minnaert relationship (Smith et al. 1980). The Minnaert coefficient, k, can be employed in the correction model as follows,
··· (5)
Atmospheric correction
Different atmospheric conditions caused by meteoro- logical and sun angle variations affect spectral radiance on the ground. Atmospheric correction aims at removing the scattering, absorption and atmospheric distortion (Vermote et al. 1997). The scattering effect is mainly constituted of path radiance, which can be corrected using the dark object subtraction method. The dark object value for each band was determined using the histogram method. The left part of the histogram of each band was examined to determine the haze influence. The haze influence is indicated by the sharp increase in the number of pixels at nonzero radiance (Chavez 1988).
Tree crown delineation
The corrected IKONOS image was processed with prin- cipal component pan-sharpening to combine the four mul- tispectral bands of 4 m resolution with the 1-m pan- chromatic band. The pan-sharpened image was used to de- tect tree crowns using the watershed method. A non-vege-
tation mask (bareland, cloud and shadow) was generated for removing non-vegetation area prior to segmentation.
The mask was created by thresholding of normalized dif- ference vegetation index (NDVI) from the IKONOS im- age for cloud and bareland areas. The NDVI image was in- teractively examined to determine the threshold between vegetation and non-vegetation areas. The panchromatic band was analyzed for generating shadow mask (Asner and Warner 2003). Prior to the segmentation, reversal image of the pan-sharpened image was generated for delineating the tree crowns in ArcGIS 9 (ESRI).
The segmentation results were compared with the field data for calculating crown detection rate in percent for each plot. Since lower-canopy trees cannot be observed by the satellite sensor, tree crowns obtained from a high-resolution satellite data correspond to the ones on the ground accord- ing to the largest tree to smaller tree (Palace et al. 2008;
Hirata et al. 2009). Segmentation accuracy was assessed prior to statistical analyses.
Goodness measures of satellite-based crown delin- eation
Crown delineation accuracy can be assessed using the goodness measures of segmentation (Clinton et al. 2010).
The reference and segmented crown layers are defined as follows;
Let X = {xi: i=1...n} and Y = {yj:j=1...n} ··· (6)
where, X are mannually digitized reference crowns and Y are automatically delineated crowns based on the segmenta- tion algorithm. The intersection area of the automatically and manually delinated crowns is considered as matching area (Clinton et al. 2010). Both OverSegmentation and UnderSegmentations can range from zero to one, where OverSegmentation=0 or UnderSegmentaion=0 indicates a perfect segmentation. The quality of segmentation is de- termined by the point distance from the origins of the seg- ments, which is known as the closeness index, D (Clinton et al. 2010)
(7)
OverSegmentation = ∩
··· (8) UnderSegmentation = ∩
··· (9)
Lower values of D indicate better segmentation. The number of reference crowns was compared with the num- ber of segmented crowns. A total of 1104 crowns for 35 plots were mannually digitized to assess the delineation accuracy.
Statistical analyses for above-ground biomass esti- mation
Segmentation of the IKONOS-2 image generated two crown variables: crown perimeter (CP_I) and crown area (CA_I). Crown diameter (CD_I) was calculated from crown area by assuming a circular shape. Field data of trop- ical forests are generally scarce (Palace et al. 2008) and ex- pensive to collect (Phua and Saito 2003). Therefore, find- ing the best satellite-based variable that explains most of the variance in the measured biomass or variable that correlates with the measured biomass is desirable. Pearson’s correla- tion was used to examine the correlations between satel- lite-based and field measured variables. The satellite-based variable that had the strongest correlation with the meas- ured biomass or structural variable was analysed for build- ing an estimation model. The detected tree crowns were divided into 50% for model building and another 50% for model validation. Samples were selected with cluster ran- dom sampling. The estimated AGB was compared with the measured AGB from field data collection.
Results
Tree crown detection
From the watershed segmentation, we delineated 1,584 crowns of upper- canopy trees from the IKONOS-2 image.
Overall, about 49% of the total field-measured trees were detected in comparison to the field measurement. The close- ness index (D) of the segments to the ideal tree crown was 0.36, indicating that 64 % of the segmentation was accurate.
Fig. 2 illustrates the influence of tree density on crown detection percent. The detection percent decreases steeply with increasing tree density. The highest delineation per-
Fig. 2. Percentage of detectable trees versus tree density.
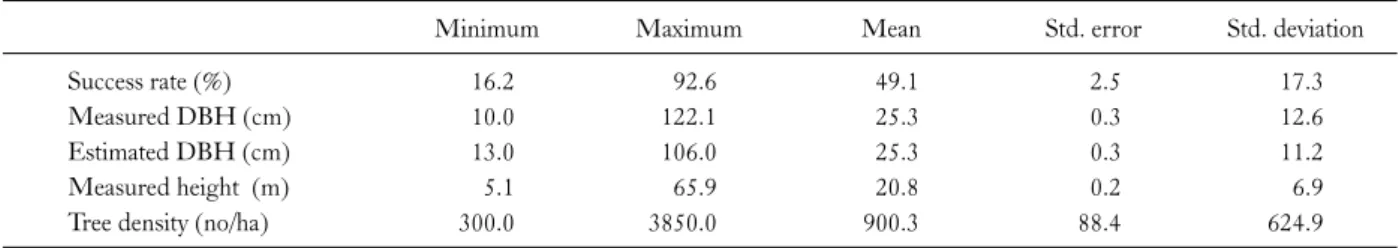
Table 1. Characteristics of delineated tree crowns based on estimation dataset
Minimum Maximum Mean Std. error Std. deviation
Success rate (%) Measured DBH (cm) Estimated DBH (cm) Measured height (m) Tree density (no/ha)
16.2 10.0 13.0 5.1 300.0
92.6 122.1 106.0 65.9 3850.0
49.1 25.3 25.3 20.8 900.3
2.5 0.3 0.3 0.2 88.4
17.3 12.6 11.2 6.9 624.9 Table 2. Correlation matrix among the satellite-based and measured variables
CA_I CP_I CD_I Ht_f DBH_f AGB_f_f CA_I
CP_I CD_I Ht_f DBH_f AGB_f
1 .942**
.977**
.560**
.821**
.615**
1 .960**
.544**
.774**
.535**
1 .573**
.801**
.535**
1 .737**
.548**
1
.0848** 1
CA_I, Satellite-based crown area; CP_I, Satellite-based crown pe- rimeter; CD_I, Satellite-based crown diameter; Ht_f, Measured height; DBH_f, Measured dbh; AGB_f, Measured AGB.
Fig. 3. Delineated tree crowns in primary forest (a) and degraded forest (b).
cent was 93% at 300 trees/ha, the detection percent drop- ped below 50% where the tree density was higher than 700 trees/ha. Fig. 3(a) and (b) show examples of delineated tree crowns of primary and degraded forests, respectively.
Primary forest with very low tree density had higher de- tection percent. In contrast, degraded forest with higher tree density had a relatively low detection percent.
Table 1 summarizes the characteristic of detected up- per-canopy trees. The success rate of tree crown delineation ranged between 16.2% and 92.6% with a mean of 49.1%.
DBH of the detected trees ranged between 13.0 cm and
106.0 cm with a mean of 25.3 cm, which is almost identical to the field-measured DBH with ranged between 10.0 cm to 122.1 cm with a mean of 25.3 cm. The crown variables of the detected trees were analyzed against the field measure variables for correlations.
Correlations among satellite-based and field meas- ured variables
The correlations among satellite-based crown variables extracted from the IKONOS-2 image and field measured variables are summarized in Table 2. Most of the field-measured variables were significantly correlated with the satellite-based crown variables. Only the correlations between the field measured tree height (Ht_f) and the sat- ellite-based crown variables were relatively low. The field-measured above-ground biomass (AGB_f) was highly correlated with DBH with R coefficients of 0.85. However, DBH has the highest correlation with CA_I (R=0.82), followed by CD_I (R=0.80) and CP_I (R=0.77). In con- trast, relatively low correlations (R coefficient ranges be- tween 0.54 and 0.57) were found between field-measured Ht_f and the satellite-based crown variables.
Fig. 4. Estimation model of DBH using CA_I.
Table 3. Regression statistics of the dbh estimation model (A) Regression statistics DBH_f (X) vs CA_I (Y)
R2 Adjusted R2 SE
0.739 0.738 6.6504
(B) Analysis of variance DBH_f (X) vs CA_I (Y) Regression Residual DF
Sum of squares F value Significance level
1 101326.422 2291.029 0.0
810 25824.246
(C) Variables in the equation DBH_f (X) vs CA_I (Y)
CA_I Constant
B SEof B t value
Significance level of t
0.381 0.008 47.865 0.0
9.537 0.403 23.652
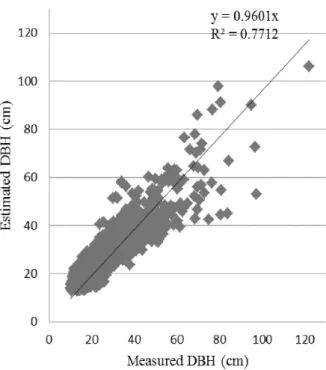
0.0 Fig. 5. Comparison between measured and predicted DBH.
DBH estimation model
Based on the correlation analyses, the best-performing variable, CA_I, was used as independent variable in a re- gression analysis to derive DBH estimation model. As shown in Fig. 4, DBH and CA_I had a strong positive re- lationship (R2=0.74). DBH was estimated based on the following regression model with CA_I (Table 3);
DBH=0.381 (CA_I) + 9.537 ··· (10)
For comparison, measured and estimated DBH were plotted in Fig. 5. The slope of regression lines through the origins was 0.9601. Root mean square error (RMSE) was found to be 30%. The mean of the measured DBH was al- most equal to the mean of the estimated DBH (Table 4).
Above-ground biomass estimation
Using the estimated DBH, the AGB was then calculated based on the allometry equations of Kenzo et al. (2009) for degraded forest and Yamakura et al. (1986) for primary forest. The summary of the AGB estimation are shown in Table 4.
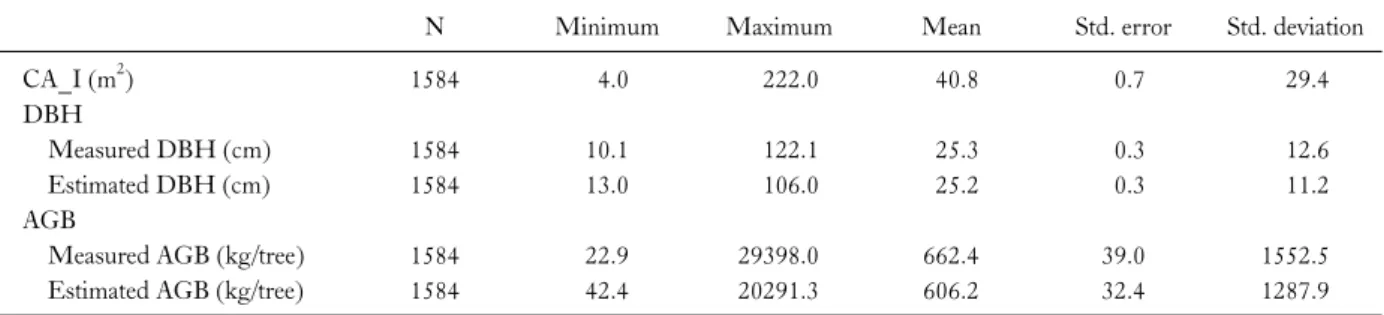
The AGB calculated from the estimated DBH was very similar to the measured AGB for. Estimated AGB ranged from 42.4 to 20,291.3 kg/tree, with a mean of 606.2 kg/tree, which was about 8% lower than the measured AGB. For comparison, the measured and estimated AGB were plotted (Fig. 6). The regression line was well-fitted between the measured and estimated AGB through the ori- gin with a slope of 0.74. Overall, the AGB were under- estimated because the slope of the regression line was less than one.
Table 4. Summary for the estimation using validation dataset
N Minimum Maximum Mean Std. error Std. deviation
CA_I (m2) DBH
Measured DBH (cm) Estimated DBH (cm) AGB
Measured AGB (kg/tree) Estimated AGB (kg/tree)
1584
1584 1584
1584 1584
4.0
10.1 13.0
22.9 42.4
222.0
122.1 106.0
29398.0 20291.3
40.8
25.3 25.2
662.4 606.2
0.7
0.3 0.3
39.0 32.4
29.4
12.6 11.2
1552.5 1287.9
Fig. 6. Comparison between measured and estimated AGB.
Discussion
There have been many studies that examine tree crown detection and delineation in temperate and plantation for- ests using high-resolution satellite images (Pouliot et al.
2002; Wang et al. 2004; Hirata et al. 2008; Jing et al.
2012). Success rates of tree crown delineation in plantation and temperate forests are comparatively higher (Pouliot and King 2005; Gebreslasie et al. 2011). Canopy condition as well as tree density strongly influence tree crown detection using high-resolution satellite image. Tree crown delin- eation error can be due to merging crowns, unique branch- ing and different illumination between tree crowns in trop- ical forest (Palace et al. 2008). This study found that the watershed method performed relatively well for the tropical
forest Northern Borneo. The average success rate of crown detection was nearly 50%. There was a strong negative rela- tionship between tree density and the success rate. The rate decreased steeply in the case of dense forest. The dense for- est consists of mainly young regenerating stands that have relatively uniform tree height and flat canopy surface. Such characteristics can lead to the underestimation of stand den- sity because a clump of trees is segmented into one big crown (Hirata et al. 2008). Liana that extends over multiple crowns may also lead to crown merging (Avalos and Mulkey 1999; Broadbent et al. 2008). Shadows in a high-resolution satellite image can also alter the image qual- ity and cause information loss (Haijian et al. 2008). How shadows affect tree crown detection and delineation in a dense tropical forest should warrant attentions for further research.
In temperate forests, DBH has been found having sig- nificant relationship with crown area (Bartelink 1996) and with crown diameter (Song et al. 2010). There has been very little research on the relationship between DBH and satellite-based crown variable in tropical forest that has more complex three-dimensional structure. Suppressed trees that are under the upper-canopy trees cannot be de- tected using high-resolution satellite image (Broadbent et al. 2008; Palace et al. 2008). In the Brazilian Amazon, a significant relationship between crown width and DBH has been established for a primary forest (Palace et al. 2008). In our study in northern Borneo, we found that crown area had the highest correlation with DBH. DBH increases with increasing crown diameter for the tropical forest in Northern Borneo.
Determining a suitable crown variable is crucial in AGB estimation. The estimated AGB ranged between 50 and 12,000 t/ha, with means of 546 t/ha. The small differences
between the estimated and measured AGBs provided a convincing argument that the results of the satellite-based estimation approach were consistent in overall. The scat- ter-plots between the estimated and measured values of DBH as well as AGB showed the consistency of the DBH estimation model. Our findings support the use of DBH as the main predictor for AGB estimation in the tropics (Brown 2002; Gibbs et al. 2007). However, more field data are needed for validating AGB estimation over extended area.
Furthermore, this approach is advantageous because it uses segment’s attributes, which are not affected by the problem of spectral value saturation that affects in- dex-based estimation models in medium resolution satellite data (Phua and Saito 2003; Langner et al. 2012). The ap- proach also supports possibility of generalized application in the forests of Sabah. Using high-resolution satellite im- ages from different dates, it is possible to employ this ap- proach for monitoring carbon stock changes.
Conclusion
Estimation of above-ground biomass is crucial in realis- ing REDD+. We examined the use of IKONOS-2 image for crown detection and AGB estimation for a tropical for- est in Northern Borneo. Our study revealed that about 43%
of trees in the tropical forest were detectable using high res- olution satellite image. Strong positive correlations were found between the satellite-based crown variables and field measured variables. The highest correlation was between the satellite-based crown area and the field measured DBH with R of 0.82. With the satellite-based crown area, we de- veloped a DBH estimation model that led to AGB estima- tion for the tropical forest. Overall, the estimated AGB only had a small difference as compared to the field measured AGB. This approach could be potentially useful in MRV for REDD+ implementation because high-resolution sat- ellite images are increasingly available and affordable in de- veloping countries.
Acknowledgements
This project was funded by Agriculture, Forestry and Fisheries Research Council (AFFRC), Japan involving
Universiti Malaysia Sabah (UMS), Forestry and Forest Products Research Institute (FFPRI) and The University of Tokyo, Japan. We are thankful to Sabah Forestry Department (SFD) for the permission, to Sabah Forest Industry (SFI) for the field support and to the government of United States of America for the SRTM-DEM data.
References
Asner GP, Palace M, Keller M, Pereira R Jr, Silva JNM, Zweede JC. 2002. Estimating canopy structure in an Amazon Forest from laser range finder and IKONOS satellite observations.
Biotrop 34: 483-492.
Asner GP, Warner AS. 2003. Canopy shadow in IKONOS satellite observations of tropical forests and savannas. Rem Sens of Environ 87: 521-533.
Avalos G, Mulkey SS. 1999. Seasonal changes in liana cover in the canopy of a neotropical dry forest. Biotrop 3: 186-191.
Bartelink HH. 1996. Allometric relationships on biomass and nee- dle area of Douglas-fir. For Ecol Manage 86: 193-203.
Broadbent EN, Asner GP, Peña-Claros M, Palace M, Soriano M.
2008. Spatial partitioning of biomass and diversity in a lowland Bolivian forest: Linking field and remote sensing measurements.
For Ecol Manage 255: 2602-2616.
Brown S. 2002. Measuring carbon in forests: current status and fu- ture challenges. Environ Pollution 116: 363-372.
Chavez PS Jr. 1988. An improved dark-object subtraction techni- que for atmospheric scattering correction of multispectral data.
Rem Sens Environ 24: 459-579.
Clinton N, Holt A, Scarborough J, Li Y, Peng G. 2010. Accuracy assessment measures for object-based image segmentation goodness. Photogram Eng Rem Sens 76: 289-299.
FAO. 2005. Global Forest Resources Assessment 2005. Food and Agriculture Organization, Rome, Italy.
Gebreslasiea MT, Ahmed FB, Aardt VJ, Blakeway F. 2011.
Individual tree detection based on variable and fixed window size local maxima filtering applied to IKONOS imagery for even-aged Eucalyptus plantation forests. Int J Rem Sens 32:
4141-4154.
Gibbs HK, Brown S, Niles JO, Foley JA. 2007. Monitoring and estimating tropical forest carbon stocks: making REDD a reality. Environ Res Lett 2: 1-13.
Haijian Ma Qiming Q, Xinyi S. 2008. Shadow segmentation and compensation in high resolution satellite images. Proc Geosci Rem Sens Symp II: 1036-1039.
Hirata Y, Fruya N, Suzuki M, Yamamoto H. 2008. Estimation of stand attributes in cryptomeria japonica and chamaecyparis obtusa stands from single tree detection using small-footprint airborne LiDAR data. J For Plann 13: 303-309.
Hirata Y, Tsubota Y, Sakai A. 2009. Allometric models of DBH and crown area derived from QuickBird panchromatic data in
Cryptomeria japonica and Chamaecyparis obtusa stands. Int J Rem Sens 30: 5071-5088.
Jing L, Hu B, Noland T, Li J. 2012. An individual tree crown de- lineation method based on multi-scale segmentation of imagery.
ISPRS J Photogram Rem Sens 70: 88-98.
Kenzo T, Ichie T, Hattori D, Itioka T, Handa C, Ohkubo T, Kendawang JJ, Nakamura M, Sakaguchi M, Takahashi N, Okamoto M, Tanaka-Oda A, Sakurai K, Ninomiya I. 2009.
Development of allometric relationships for accurate estimation of above- and below-ground biomass in tropical secondary for- ests in Sarawak, Malaysia. J Trop Ecol 25: 371-386.
Kubo M, Muramoto KI. 2005. Tree crown detection and classi- fication using forest imagery by IKONOS. Proc Geosci Rem Sens Symp 6: 4358-4361.
Langner A, Samejima H, Ong RC, Titin J, Kitayama K. 2012.
Integration of carbon conservation into sustainable forest man- agement using high resolution satellite imagery: A case study in Sabah, Malaysian Borneo. Int J Applied Earth Observ Geoinfor 18: 305-312.
Leckie DG, Gougeon FA, Tinis S, Nelson T, Burnett CN, Paradine D. 2005. Automated tree recognition in old growth conifer stands with high resolution digital imagery. Rem Sens Environ 94: 311-326.
Morel AC, Fisher JB, Malhi Y. 2012. Evaluating the potential to monitor aboveground biomass in forest and oil palm in Sabah, Malaysia, for 2000-2008 with Landsat ETM+ and ALOS-PALSAR. Int J Rem Sens 33: 3614-3639.
Muukkonen P, Heiskanen J. 2007. Biomass estimation over a large area based on Standwise forest inventory data and ASTER and MODIS satellite data: A possibility to verify carbon inventories.
Rem Sens Environ 107: 617-624.
Palace M, Keller M, Asner GP, Hagen S, Braswell B. 2007.
Amazon forest structure from IKONOS satellite data and the au- tomated characterization of forest canopy properties. Biotrop 40:
141-150.
Peterson B, Gerlach F, Hutchin K. 2001. IKONOS relative spec-
tral response and radiometric calibration coefficients. Document number SE-REF-016, Revision A, Space Imaging, Thornton, Colorado, USA.
Phu MH, Saito H. 2003. Estimation of biomass of a mountainous tropical forest using Landsat TM data. Can J Rem Sens 29:
429-440.
Pouliot D, King D. 2005. Approaches for optimal automated in- dividual tree crown detection in regenerating coniferous forests.
Can J Rem Sens 31: 255-267.
Pouliot DA, King DJ, Bell FW, Pitt DG. 2002. Automated tree crown detection and delineation in high-resolution digital cam- era imagery of coniferous forest regeneration. Rem Sens Environ 82: 322-334.
Smith JA, Lin TL, Ranson KL. 1980. The lambertian assumption and landsat data. Photogram Eng Rem Sens 46: 1183-1189.
Song C, Dickinson MB, Su L, Zhang S, Yaussey D. 2010.
Estimating average tree crown size using spatial information from IKONOS and QuickBird images: Across-sensor and across-site comparisons. Rem Sens Environ 114: 1099-1107.
Vermote EF, El Saleous N, Justice CO, Kaufman YJ, Privette JL, Remer L, Roger JC, Tanré D. 1997. Atmospheric correction of visible to middle-infrared EOS-MODIS data over land surfa- ces: Background, operational algorithm and validation. J Geophys Res 102: 17131-17141.
Wang LJ, Gong P Biging GS. 2004. Individual tree-crown delin- eation and treetop detection in high-spatial-resolution aerial imagery. Photogram Eng Rem Sens 70: 351-357.
Wulder MA, Niemann KO, Goodenough DG. 2002. Error reduc- tion methods for local maximum filtering of high spatial reso- lution imagery for locating trees. Can J Rem Sens 28: 621-628.
Whitemore TC. 1984. Tropical rain forests of the Far East.
Clarendon Press, Oxford, United Kingdom.
Yamakura T, Hagihara A, Sukardjo S, Ogawa H. 1986.
Aboveground biomass of tropical rain forest stands in Indonesian Borneo. Vegetatio 68: 71-82.