The association of PBX1 polymorphisms with overweight/obesity and metabolic alterations in the Korean population*
Ju Yeon Ban1†, Soon Ah Kang2†, Kyung Hee Jung3, Hak Jae Kim3, Yoon Kyung Uhm3, Su Kang Kim3, Sung-Vin Yim1,3, Bong-Keun Choe3, Seung-Jae Hong3, Yeon Hee Seong4, In Song Koh5 and Joo-Ho Chung3§
1Brain Korea 21 Project Center, Kyung Hee University, Hoegi-dong, Dongdaemun-gu, Seoul 130-701, Korea
2Department of Fermented Food Science, Seoul University of Venture & Information, Samsung-dong, Kangnam-gu, Seoul 135-090, Korea
3Kohwang Medical Research Institute, School of Medicine, Kyung Hee University, Hoegi-dong, Dongdaemun-gu, Seoul 130-701, Korea
4College of Veterinary Medicine, Chungbuk National University, Gaesin-dong, Heungdeok-gu, Cheongju-si, Chungbuk 361-763, Korea
5Department of Physiology, College of Medicine, Han Yang University, Haengdang 1-dong, Seongdong-gu, Seoul 133-791, Korea
Received September 1, 2008, Revised October 22, 2008, Accepted November 12, 2008
Abstract
Pre-B-cell leukemia transcription factor 1 (PBX1), which is located on chromosome 1q23, was recently reported to be associated with type 2 diabetes mellitus. We examined whether single nucleotide polymorphisms (SNPs) of the PBX1 gene are associated with overweight/obesity in a Korean population. We genotyped 66 SNPs in the PBX1 gene and investigated their association with clinical phenotypes found in 214 overweight/obese subjects and 160 control subjects using the Affymetrix Targeted Genotyping chip array. Seven SNPs (g.+75186C>T, g.+78350C>A, g.+80646C>T, g.+138004C>T, g.+185219G>A, g.+191272A>C, and g.+265317T>A) were associated with the risk of obesity in three models (codominant, dominant, and recessive) (P=0.007-0.05). Haplotype 1 (CAC) and 3 (TAC) of block 3 and haplotype 2 (GGAAT) of block 10 were also strongly associated with the risk of obesity. In the control group, subjects that had homozygote for the major allele for both g.+185219G>A and g.+191272A>C showed lower high density lipoprotein-cholesterol (HDL-C) level compared to those possessing the minor allele, suggesting that the association between the homozygote for the major allele for both g.+185219G>A and g.+191272A>C and HDL-C is attributable to the increased risk of obesity. This study suggests that the PBX1 gene is a possible risk factor in overweight/obese patients.
Key Words: High-density lipoprotein-cholesterol, overweight/obesity, Pre-B-cell leukemia transcription factor 1 (PBX1), single nucleotide polymorphism (SNP)
Introduction15)
Obesity is one of the most common disorders in clinical practice and closely associated with a number of pathological diseases, such as non-insulin-dependent diabetes, hypertension, and atherosclerosis (Gregoire et al., 1998). Although rare, obesity can be caused by mutations in a single gene. However, the greatest proportion of obesity involves the interaction variants in multiple genes with environmental factors, particularly diet (Loos & Bouchard, 2003; Loss & Rankinen, 2005). In addition, several lines of studies suggested a close association between insulin signaling and obesity. Kadowaki et al. (2003) have reported the molecular mechanisms of insulin resistance and
obesity, focusing on the function of adipocyte.
Pre-B-cell leukemia transcription factor (PBX1) is a member of a ubiquitous class of homeodomain proteins. The PBX1 gene, localized on chromosome 1q23, was originally identified by its involvement in a t (1;19) chromosomal translocation in acute pre-B-cell leukemias (Kamps, 1990; Nourse et al., 1990).
Subsequent study has shown that PBX1 is widely expressed and acts as a cofactor for a variety of HOX proteins (Sagerstrom, 2004). These homeodomain transcription factors in turn regulate developmental gene expression and early embryonic development and organogenesis, and maintain differentiated cell states (Sagerstrom, 2004).
The role of PBX1 has been well studied in the pancreas, where
* This study was supported by the Governance Program of Kyung Hee University for the Young Researcher in Medical Science and the Brain Korea 21 Project in 2006.
†Both authors contributed equally to this study.
§Corresponding Author: Joo-Ho Chung, Tel. 82-2-961-0303, Fax. 82-2-968-0560, Email. [email protected]
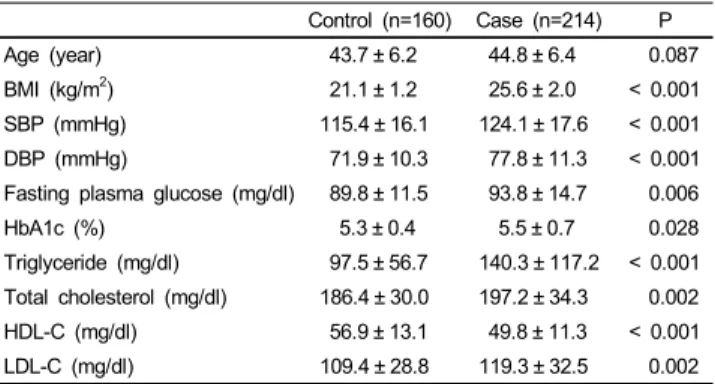
Table 1. Clinical characteristics of study subjects
Control (n=160) Case (n=214) P
Age (year) 43.7 ± 6.2 44.8 ± 6.4 0.087
BMI (kg/m2) 21.1 ± 1.2 25.6 ± 2.0 < 0.001
SBP (mmHg) 115.4 ± 16.1 124.1 ± 17.6 < 0.001
DBP (mmHg) 71.9 ± 10.3 77.8 ± 11.3 < 0.001
Fasting plasma glucose (mg/dl) 89.8 ± 11.5 93.8 ± 14.7 0.006
HbA1c (%) 5.3 ± 0.4 5.5 ± 0.7 0.028
Triglyceride (mg/dl) 97.5 ± 56.7 140.3 ± 117.2 < 0.001 Total cholesterol (mg/dl) 186.4 ± 30.0 197.2 ± 34.3 0.002 HDL-C (mg/dl) 56.9 ± 13.1 49.8 ± 11.3 < 0.001
LDL-C (mg/dl) 109.4 ± 28.8 119.3 ± 32.5 0.002
Data expressed as mean ± SD.
BMI, body mass index; SBP, systolic blood pressure; DBP, diastolic blood pressure;
HbA1c, hemoglobin A1c; HDL-C, high-density lipoprotein cholesterol; LDL-C, low-density lipoprotein cholesterol; n, number; P, P-value; case, overweight and obese subjects.
it complexes with and regulates the key β-cell homeobox protein, PDX1 (IPF1 in humans) (Wang et al., 2005). In mice, PDX1 activity was sufficient for the development of the major cell types, but PBX1:PDX1 complex was essential for the expansion of each cell type within the developing pancreas, and hence for normal pancreatic development (Dutta et al., 2001). Dutta et al.
(2001) also suggested that PBX1:PDX1 heterodimer contributes to ductal cell proliferation and subsequent islet regeneration. Kim et al.(2002) examined pancreatic Pbx1 expression, morphogenesis, cell differentiation, and function in mice deficient for Pbx1. Pbx1 -/- embryos had pancreatic hypoplasia and marked defects in exocrine and endocrine cell differentiation prior to death at embryonic day 15 or 16. Pbx1 +/- adults had pancreatic islet malformations, impaired glucose tolerance, and hypoinsulinemia.
Consequently, Kim et al.(2002) concluded that PBX1 is essential for normal pancreatic development and function and perturbation of PBX1 activity may also promote susceptibility to diabetes mellitus.
Despite potentially important roles in metabolic diseases, genetic association of PBX1 on obesity is not yet unknown in humans. Therefore, we examined whether PBX1 polymorphism contributes to the susceptibility to obesity or obesity-related metabolism traits in a Korean population.
Materials and methods
Study subjects
The body mass index (BMI) was calculated from height and weight using the formula: BMI=body weight/(height)2 in kg/m2. In the World Health Organization guidelines for Asians, individuals with a BMI≥23 kg/m2 are classified as overweight and those with a BMI≥25 kg/m2 are defined as obese (World Health Organization Expert Consultation, 2004). We recruited a case group (n=214) that comprised overweight and obese subjects (BMI≥23 kg/m2, 123 men and 91 women) and control subjects (n=160) with normal weight (BMI: 18.0-22.9 kg/m2, 66 men and 94 women) at Kyung Hee University Medical Center and Keimyung University Dongsan Medical Center. All of the subjects were ethnic Koreans. Blood samples were drawn for biochemical measurements, i.e., fasting plasma glucose, hemoglobin A1c (HbA1c), triglyceride (TG), total cholesterol, high-density lipoprotein cholesterol (HDL-C), and low-density lipoprotein cholesterol (LDL-C). The clinical characteristics of the subjects were summarized (Table 1). DNA was isolated from peripheral blood leukocytes using the G-DEX™ IIb Genomic DNA Extraction Kit (iNtRON Biotechnology, Seongnam, Korea). All of the subjects gave written informed consent before entering the study. This study was approved by the Institutional Review Board of Kyung Hee University Medical Center.
Determination of genotype
Initially, we selected 66 single nucleotide polymorphisms (SNPs) within the PBX1 gene using the following criteria: (1) consisting only of SNPs in introns (approximately 300bp from the exon to consider alternative splicing); (2) tagging SNPs selected using the tagging option of the program Tagger (http://www.broad.mit.edu/mpg/tagger/); (3) known heterozygosity and minor allele frequency (MAF) > 0.05; and (4) reported validation (http://www.hapmap.org). The genotyping was performed using the Affymetrix Targeted Genotyping Chip array (Affymetrix, CA, USA), according to the manufacturer’s protocol. This chip uses molecular inversion probe technology with gene chip universal microarrays to provide a method that is capable of analyzing thousands of variants in a single reaction. In brief, DNA was digested and then subjected to PCR using primers specific to the adaptor sequence. PCR products were purified and the fragmented DNA was then end-labeled with biotin using terminal deoxynucleotidyl transferase. Labeled DNA was then hybridized onto the Mapping Array. The hybridized array was washed, stained, and scanned according to the manufacturer's instructions. The image was analyzed using GCOS software (Affymetrix).
Statistical analysis
For the case-control association study, Hardy-Weinberg equilibrium (HWE) for all SNPs was assessed using SNPstats.(Solé et al., 2006) A linkage disequilibrium (LD) block of polymorphisms was tested using Haploview (version 3.32) (MA, USA).(Barrett et al., 2005) Multiple logistic regression models were calculated for the odds ratio (OR), 95% confidence interval (CI) and corresponding P values, controlling for age and gender as covariables. We used SNPstats, HapAnalyzer version 1.0 (Seoul, Korea) (Park et al., 2008) and SNPanalyzer (ISTECH Inc., Goyang, Korea). The power of the sample size was calculated using a genetic power calculator (http://pngu.mgh.harvard.edu/~
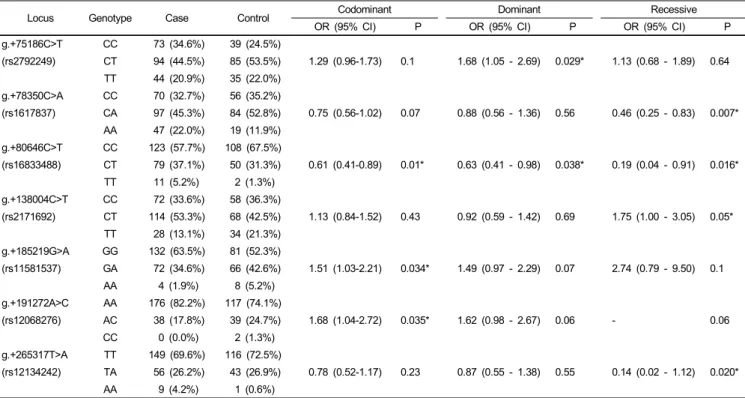
Table 2. Association between polymorphisms in PBX1 and the risk of obesity
Locus Genotype Case Control Codominant Dominant Recessive
OR (95% CI) P OR (95% CI) P OR (95% CI) P
g.+75186C>T CC 73 (34.6%) 39 (24.5%)
(rs2792249) CT 94 (44.5%) 85 (53.5%) 1.29 (0.96-1.73) 0.1 1.68 (1.05 - 2.69) 0.029* 1.13 (0.68 - 1.89) 0.64 TT 44 (20.9%) 35 (22.0%)
g.+78350C>A CC 70 (32.7%) 56 (35.2%)
(rs1617837) CA 97 (45.3%) 84 (52.8%) 0.75 (0.56-1.02) 0.07 0.88 (0.56 - 1.36) 0.56 0.46 (0.25 - 0.83) 0.007*
AA 47 (22.0%) 19 (11.9%) g.+80646C>T CC 123 (57.7%) 108 (67.5%)
(rs16833488) CT 79 (37.1%) 50 (31.3%) 0.61 (0.41-0.89) 0.01* 0.63 (0.41 - 0.98) 0.038* 0.19 (0.04 - 0.91) 0.016*
TT 11 (5.2%) 2 (1.3%)
g.+138004C>T CC 72 (33.6%) 58 (36.3%)
(rs2171692) CT 114 (53.3%) 68 (42.5%) 1.13 (0.84-1.52) 0.43 0.92 (0.59 - 1.42) 0.69 1.75 (1.00 - 3.05) 0.05*
TT 28 (13.1%) 34 (21.3%) g.+185219G>A GG 132 (63.5%) 81 (52.3%)
(rs11581537) GA 72 (34.6%) 66 (42.6%) 1.51 (1.03-2.21) 0.034* 1.49 (0.97 - 2.29) 0.07 2.74 (0.79 - 9.50) 0.1
AA 4 (1.9%) 8 (5.2%)
g.+191272A>C AA 176 (82.2%) 117 (74.1%)
(rs12068276) AC 38 (17.8%) 39 (24.7%) 1.68 (1.04-2.72) 0.035* 1.62 (0.98 - 2.67) 0.06 - 0.06
CC 0 (0.0%) 2 (1.3%)
g.+265317T>A TT 149 (69.6%) 116 (72.5%)
(rs12134242) TA 56 (26.2%) 43 (26.9%) 0.78 (0.52-1.17) 0.23 0.87 (0.55 - 1.38) 0.55 0.14 (0.02 - 1.12) 0.020*
AA 9 (4.2%) 1 (0.6%)
Genotype distributions are shown as number (%). Odds ratio (OR), 95% confidence interval (CI), and P-values were from logistic regression analyses with the codominant, dominant, and recessive models controlling age and gender as covariates. SNP, single nucleotide polymorphism; case, overweight and obese subjects; P, P-value
purcell/gpc) (Purcell et al., 2003). To reduce experimental error, the effective sample size was adjusted (calculated sample size×100/95). We calculated sample powers for the SNPs to confirm the effects. To account for multiple testing, the Bonferroni method was used(Bland & Altman, 1995), giving a significance level of α/κ=0.00076 for each test.
Clinical characteristics were compared between control and case subjects, using Student’s unpaired t-test for continuous variables with normal distribution including systolic blood pressure (SBP), diastolic blood pressure (DBP), fasting plasma glucose, HbA1c, TG, total cholesterol, HDL-C, and LDL-C. In addition, the statistical significance of association between the genetic variants and clinical characteristics in both the control and case groups was assessed using one-way analysis of variance (ANOVA) with subsequent Tukey’s tests. For all of the statistical tests, the level of significance was set at 0.05.
Results
All of the measured clinical characteristics differed significantly between the case and control groups (Table 1). We analyzed the association between each genotype and susceptibility to obesity using logistic regression analysis, after adjusting for age and gender. The genotype distributions of all SNPs selected were in Hardy-Weinberg equilibrium (P>0.05). Of these, seven SNPs (g.+75186C>T, g.+78350C>A, g.+80646C>T, g.+138004C>T.
g.+185219G>A, g.+191272A>C, and g.+265317T>A) were significantly associated with the risk of obesity (P<0.05; Table 2).
The minor allele of g.+75186C>T, g.+138004C>T, g.+185219G>A, and g.+191272A>C had a protective effect in the dominant (P
=0.029, OR=1.68, 95% CI=1.05-2.69), recessive (P=0.05, OR=1.75, 95% CI=1.00-3.05), codominant (P=0.034, OR=1.51, 95% CI=1.03-2.21), codominant (P=0.035, OR=1.68, 95 % CI=1.04-2.72) models, respectively. Conversely, the minor allele of g.+78350C>A and g.+265317T>A showed susceptibility to the risk of obesity when a recessive model was applied (P=0.007, OR=0.46, 95% CI=0.25-0.83, and P=0.02, OR=0.14, 95%
CI=0.02-1.12, respectively). In addition, g.+80646C>T was statistically associated with obesity in all models. However, this association disappeared after correcting for multiple testing by the Bonferroni test.
Fifteen LD blocks in PBX1 were constructed using the Gabriel method.(Gabriel et al., 2002) Of these blocks, six LD blocks containing seven significant SNPs were used for further haplotype association analysis. Haplotypes 1 (CAC) and 3 (TAC) of block 3, which consisted of g.+80646C>T, g.+87440A>G, and g.+91850C>T, showed a significant association with obesity in the dominant (P=0.007, OR=0.45, 95% CI=0.26-0.81) and codominant (P=0.027, OR=1.54, 95% CI=1.05-2.25) models, respectively (Table 3). Haplotype 2 (GGAAT) of block 10, which comprised of g.+185286G>A, g.+185602G>A, g.+191125A>G, g.+191272A>C, and g.+194899G>T, was also significantly associated with the risk of obesity in the codominant (P=0.029,
Table 3. Association between haplotypes of PBX1 and the risk of obesity Block
No. Haplotype Case Control Codominant Dominant Recessive
H/H H/- -/- H/H H/- -/- OR (95% CI) P OR (95% CI) P OR (95% CI) P
2 1 (AT) 45 (21.0%) 93 (43.5%) 76 (35.5%) 34 (21.3%) 83 (51.9%) 43 (26.9%) 0.84 (0.63-1.12) 0.24 0.67 (0.43-1.04) 0.08 0.99 (0.60-1.63) 0.96 2 (GC) 46 (21.5%) 98 (45.8%) 70 (32.7%) 23 (14.4%) 91 (56.9%) 46 (28.8%) 1.07 (0.79-1.44) 0.66 0.83 (0.53-1.30) 0.41 1.63 (0.94-2.82) 0.08 3 (AC) 5 (2.3%) 43 (20.1%) 166 (77.6%) 1 (0.6%) 26 (16.3%) 133 (83.1%) 1.45 (0.90-2.34) 0.12 1.42 (0.84-2.40) 0.19 3.80 (0.44-32.88) 0.22
3 1 (CAC) 71 (33.2%) 94 (43.9%) 49 (22.9%) 53 (33.1%) 88 (55.0%) 19 (11.9%) 0.80 (0.59-1.07) 0.14 0.45 (0.26-0.81) 0.007* 1.00 (0.65-1.55) 0.99 2 (CGT) 11 (5.1%) 68 (31.8%) 135 (63.1%) 5 (3.1%) 58 (36.3%) 97 (60.6%) 0.99 (0.69-1.41) 0.94 0.90 (0.59-1.37) 0.63 1.68 (0.57-4.93) 0.35 3 (TAC) 11 (5.1%) 78 (36.4%) 125 (58.4%) 2 (1.3%) 50 (31.3%) 108 (67.5%) 1.54 (1.05-2.25) 0.027* 1.48 (0.96-2.27) 0.07 4.28 (0.94-19.59) 0.06
6 1 (CAC) 63 (29.4%) 115 (53.7%) 36 (16.8%) 51 (31.9%) 70 (43.8%) 39 (24.4%) 1.11 (0.83-1.48) 0.49 1.59 (0.96-2.65) 0.07 0.89 (0.57-1.39) 0.61 2 (TAA) 11 (5.1%) 73 (34.1%) 130 (60.7%) 15 (9.4%) 48 (30.0%) 97 (60.6%) 0.89 (0.64-1.24) 0.50 0.99 (0.65-1.51) 0.98 0.52 (0.23 - 1.17) 0.12 3 (TGA) 5 (2.3%) 65 (30.4%) 144 (67.3%) 6 (3.8%) 46 (28.8%) 108 (67.5%) 0.96 (0.66-1.40) 0.83 1.01 (0.65-1.56) 0.97 0.61 (0.18-2.05) 0.43
9 1 (GG) 70 (32.7%) 105 (49.1%) 39 (18 2%) 46 (28.8%) 83 (51.9%) 31 (19.4%) 1.11 (0.83-1.49) 0.48 1.08 (0.64-1.82) 0.78 1.20 (0.77-1.88) 0.41 2 (AA) 10 (4.7%) 72 (33.6%) 132 (61.7%) 8 (5.0%) 68 (42.5%) 84 (52.5%) 0.76 (0.54-1.08) 0.12 0.69 (0.45-1.04) 0.08 0.93 (0.36-2.42) 0.88 3 (AG) 10 (4.7%) 71 (33.2%) 133 (62.1%) 5 (3.1%) 49 (30.6%) 106 (66.3%) 1.19 (0.83-1.72) 0.34 1.20 (0.78-1.84) 0.41 1.52 (0.51-4.54) 0.45
10 1 (GGAAG) 60 (28.0%) 114 (53.3%) 40 (18.7%) 44 (27.5%) 87 (54.4%) 29 (18.1%) 1.00 (0.74-1.35) 1.0 0.96 (0.57-1.63) 0.89 1.03 (0.65-1.62) 0.91 2 (GGAAT) 6 (2.8%) 68 (31.8%) 140 (65.4%) 2 (1.3%) 37 (23.1%) 121 (75.6%) 1.59 (1.05-2.42) 0.029* 1.64 (1.04-2.59) 0.034* 2.28 (0.45-11.44) 0.32 3 (AAGAT) 2 (0.9%) 46 (21.5%) 166 (77.6%) 1 (0.6%) 43 (26.9%) 116 (72.5%) 0.79 (0.51-1.25) 0.32 0.76 (0.48-1.22) 0.26 1.50 (0.13-16.69) 0.74 4 (AGACT) 0 (0.0%) 38 (17.8%) 176 (82.2%) 2 (1.3%) 37 (23.1%) 121 (75.6%) 0.64 (0.40-1.05) 0.08 0.67 (0.41-1.11) 0.12 0.00 (0.00-) 1.00
14 1 (GCTGT) 40 (18.7%) 107 (50.0%) 67 (31.3%) 31 (19.4%) 79 (49.4%) 50 (31.3%) 0.98 (0.73-1.32) 0.92 1.00 (0.64-1.55) 0.99 0.96 (0.57-1.61) 0.87 2 (AATTT) 20 (9.3%) 87 (40.7%) 107 (50.0%) 7 (4.4%) 72 (45.0%) 81 (50.6%) 1.16 (0.83-1.61) 0.39 1.03 (0.68-1.54) 0.90 2.25 (0.93-5.47) 0.07 3 (GACTA) 9 (4.2%) 56 (26.2%) 149 (69.6%) 1 (0.6%) 40 (25.0%) 119 (74.4%) 1.38 (0.92-2.07) 0.12 1.27 (0.80-2.00) 0.31 6.98 (0.88-55.67) 0.07 4 (GATGT) 0 (0.0%) 24 (11.2%) 190 (88.8%) 0 (0.0%) 28 (17.5%) 132 (82.5%) 0.60 (0.33-1.07) 0.08 0.60 (0.33-1.07) 0.08 - - Haplotype distributions are shown as number (%). Odds ratio (OR), 95% confidence interval (CI), and P-values were from logistic regression analyses with the codominant, dominant, and recessive models controlling age and gender as covariates. No, number; case, overweight and obese subjects; P, P-value
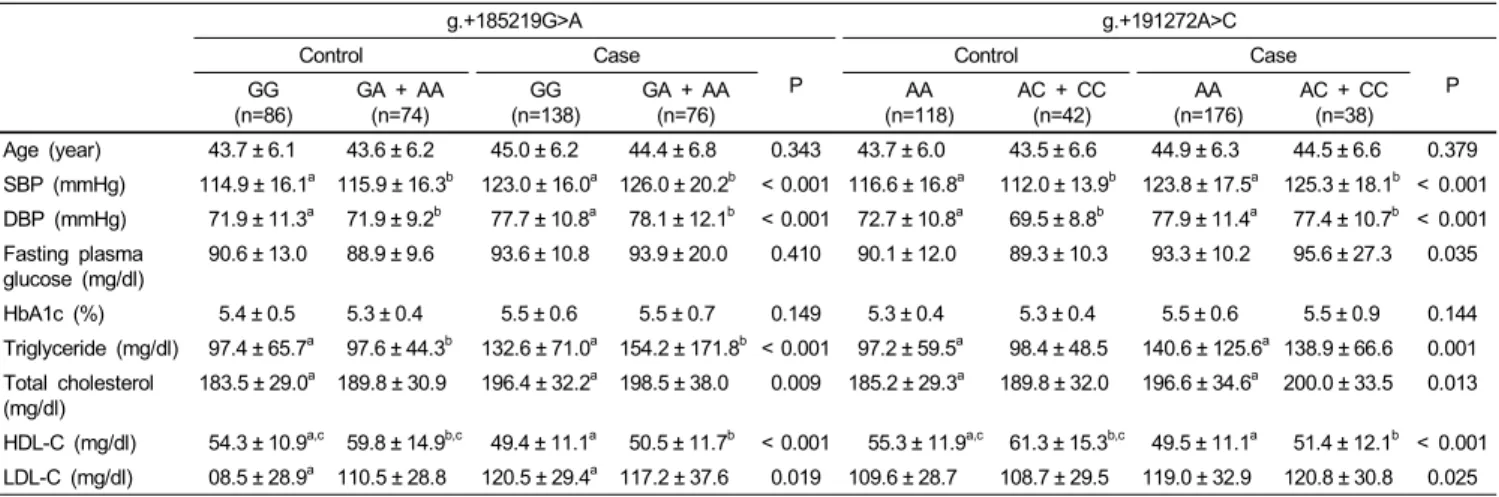
Table 4. Comparison of clinical characteristics according to the polymorphisms of PBX1 among the case and control group
g.+185219G>A g.+191272A>C
Control Case
P
Control Case
GG P
(n=86)
GA + AA
(n=74) GG
(n=138)
GA + AA
(n=76) AA
(n=118)
AC + CC (n=42)
AA (n=176)
AC + CC (n=38)
Age (year) 43.7 ± 6.1 43.6 ± 6.2 45.0 ± 6.2 44.4 ± 6.8 0.343 43.7 ± 6.0 43.5 ± 6.6 44.9 ± 6.3 44.5 ± 6.6 0.379 SBP (mmHg) 114.9 ± 16.1a 115.9 ± 16.3b 123.0 ± 16.0a 126.0 ± 20.2b < 0.001 116.6 ± 16.8a 112.0 ± 13.9b 123.8 ± 17.5a 125.3 ± 18.1b < 0.001 DBP (mmHg) 71.9 ± 11.3a 71.9 ± 9.2b 77.7 ± 10.8a 78.1 ± 12.1b < 0.001 72.7 ± 10.8a 69.5 ± 8.8b 77.9 ± 11.4a 77.4 ± 10.7b < 0.001 Fasting plasma
glucose (mg/dl)
90.6 ± 13.0 88.9 ± 9.6 93.6 ± 10.8 93.9 ± 20.0 0.410 90.1 ± 12.0 89.3 ± 10.3 93.3 ± 10.2 95.6 ± 27.3 0.035
HbA1c (%) 5.4 ± 0.5 5.3 ± 0.4 5.5 ± 0.6 5.5 ± 0.7 0.149 5.3 ± 0.4 5.3 ± 0.4 5.5 ± 0.6 5.5 ± 0.9 0.144 Triglyceride (mg/dl) 97.4 ± 65.7a 97.6 ± 44.3b 132.6 ± 71.0a 154.2 ± 171.8b < 0.001 97.2 ± 59.5a 98.4 ± 48.5 140.6 ± 125.6a 138.9 ± 66.6 0.001 Total cholesterol
(mg/dl)
183.5 ± 29.0a 189.8 ± 30.9 196.4 ± 32.2a 198.5 ± 38.0 0.009 185.2 ± 29.3a 189.8 ± 32.0 196.6 ± 34.6a 200.0 ± 33.5 0.013
HDL-C (mg/dl) 54.3 ± 10.9a,c 59.8 ± 14.9b,c 49.4 ± 11.1a 50.5 ± 11.7b < 0.001 55.3 ± 11.9a,c 61.3 ± 15.3b,c 49.5 ± 11.1a 51.4 ± 12.1b < 0.001 LDL-C (mg/dl) 08.5 ± 28.9a 110.5 ± 28.8 120.5 ± 29.4a 117.2 ± 37.6 0.019 109.6 ± 28.7 108.7 ± 29.5 119.0 ± 32.9 120.8 ± 30.8 0.025 Data expressed as mean ± SD.
P valves represent the significance of difference among the groups using one-way analysis of variance.
Mean values followed by same superscripts within column are significantly different at P<0.05 by Tukey’s test.
SBP, systolic blood pressure; DBP, diastolic blood pressure; HbA1c, hemoglobin A1c; HDL-C, high-density lipoprotein cholesterol; LDL-C, low-density lipoprotein cholesterol;
n, number; P, P-value; case, overweight and obese subjects
OR=1.59, 95% CI=1.05-2.42) and recessive (P=0.034, OR=1.64, 95% CI=1.04-2.59) models. However, when Bonferroni’s correction for the multiple comparisons was strictly applied, no haplotype also remained significant in terms of the association with obesity.
For the association analysis of obesity-related phenotypes, we
assessed whether the obesity-related phenotypes differed between the two groups (case and control) according to the PBX1 polymorphisms. There were significant differences in SBP, DBP, TG, total cholesterol, HDL-C, and LDL-C, except fasting plasma glucose and HbA1c, between the control and case group for the g.+185219G>A and g.+191272A>C (Table 4). In the control
group, subjects that carried the minor allele had higher HDL-cholesterol level compared to the homozygote for the major allele for both g.+185219G>A and g.+191272A>C (59.8 ± 14.9 vs 54.3 ± 10.9 and 61.3 ± 15.3 vs 55.3 ± 11.9, respectively, P<0.001). As shown in Table 1, HDL-cholesterol level was significantly lower in the case group compared to the control group (49.8 ± 11.3 vs 56.9 ± 13.1, P<0.001). Therefore, these results suggest that the association between the homozygote for the major allele for both g.+185219G>A and g.+191272A>C and HDL-C was attributable to an increased risk of obesity.
Discussion
Obesity is a common complex disease that involves multiple genetic variants interacting with environmental and behavioral factors, and is associated with an increased risk of developing insulin resistance and type 2 diabetes. PBX1 gene, comprised of nine exons spanning over 285 kb, maps to a region of chromosome 1 that shows well-replicated linkage to type 2 diabetes in multiple ethnic groups. Several studies support an association between PBX1 polymorphisms and type 2 diabetes mellitus(Elbein et al., 1999; McCarthy, 2003; Ng et al., 2004;
Thameem et al., 2001; Xiang et al., 2004). In this study, we evaluated the gene as a possible candidate gene for obesity based on the close relationship between obesity and type 2 diabetes.
Our results suggest that some SNPs in the PBX1 gene contribute to obesity and metabolic alterations in a Korean population. In a case-control analysis, of the 66 SNPs examined in PBX1, seven SNPs (g.+75186C>T, g.+78350C>A, g.+80646C>T, g.+138004C
>T, g.+185219G>A, g.+191272A>C, and g.+265317T>A) were significantly associated with the risk of obesity. Moreover, haplotypes 1 (CAC) and 3 (TAC) of block 3, consisted of g.+80646C>T, g.+87440A>G, and g.+91850C>T, and haplotype 2 (GGAAT) of block 10, comprised of g.+185286G>A, g.+
185602G>A, g.+191125A>G, g.+191272A>C, and g.+194899G
>T, of the PBX1 gene had a significant association with the risk of obesity. To our best knowledge, this is the first demonstration that PBX1 polymorphisms are associated with susceptibility to obesity.
Interestingly, a strong association was also found between some SNPs and the HDL-C level in the control group. Control subjects that possessed minor allele g.+185219G>A and g.+191272A>C had higher HDL-C levels. Therefore, the minor allele g.+185219G>A and g.+191272A>C may decrease the risk of obesity. Recently, although there were many reports about individual gene polymorphisms on HDL-C levels(Chien et al., 2008; Kitjaroentham et al., 2007), to our knowledge, this is the first report on the association between PBX1 polymorphisms and HDL-C levels.
We uncovered several intriguing associations between the PBX1 polymorphisms and obesity and related alterations.
Nevertheless, our study has several limitations. First, many gene
variants contribute to obesity and related alterations and those in PBX1 may have modest effects, requiring large sample sizes to detect associations (Hirschhorn & Daly, 2005). Our sample size was small, and it is possible that the associations that we observed between PBX1 SNPs and obesity could represent false positives. In our study, the power of the sample size was calculated using a genetic power calculator. Our sample provides the power more than 80% to detect more than 1.7-fold increased risk assuming an α-level of 0.05. Thus, our case-control study was sufficiently powerful to determine a positive association.
Second, all SNPs selected in PBX1 are located in introns and do not cause an amino acid change. According to the dsSNP database (http://www.ncbi.nlm.nih.gov/SNP/) and the HapMap database (http://www.hapmap.org/), five SNPs in exons of PBX1 gene were reported, but there are unknowns about heterozygosity of them. For this reason, we excluded SNPs present in exons in our study. We suggest that significant polymorphisms in introns may be a marker rather than a direct contributor to the genetic functions. The effects of other genetic variations linked to these polymorphisms may have functional significance.
However, we cannot exclude a possibility that these intronic polymorphisms have a role on its genetic function via the change of alternative splicing (Ast, 2004).
In conclusion, our findings suggest that polymorphisms in PBX1 gene might be one of the genetic factors for the risk of obesity, especially in association with alteration of HDL-C level, in a Korean population. Further studies are needed to explore the specific association between g.+185219G>A and g.+
191272A> and HDL-C.
Literature cited
Ast G (2004). How did alternative splicing evolve? Nat Rev Genet 5:773-782.
Barrett JC, Fry B, Maller J & Daly MJ (2005). Haploview: analysis and visualization of LD and haplotype maps. Bioinformatics 21:263-265.
Bland JM & Altman DG (1995). Multiple significance tests: the Bonferroni method. BMJ 310:170.
Chien KL, Chen MF, Hsu HC, Su TC, Chang WT, Lee CM & Lee YT (2008). Genetic association study of APOA1/C3/A4/A5 gene cluster and haplotypes on triglyceride and HDL cholesterol in a community-based population. Clin Chim Acta 388:78-83.
Dutta S, Gannon M, Peers B, Wright C, Bonner-Weir S & Montminy M (2001). PDX:PBX complexes are required for normal proliferation of pancreatic cells during development. Proc Natl Acad Sci USA 98:1065-1070.
Elbein SC, HoVman MD, Teng K, Leppert MF & Hasstedt SJ (1999).
A genome-wide search for type 2 diabetes susceptibility genes in Utah Caucasians. Diabetes 48:1175-1182.
Gabriel SB, Schaffner SF, Nguyen H, Moore JM, Roy J, Blumenstiel B, Higgins J, DeFelice M, Lochner A, Faggart M, Liu-Cordero SN, Rotimi C, Adeyemo A, Cooper R, Ward R, Lander ES, Daly MJ & Altshuler D (2002). The structure of haplotype blocks in the human genome. Science 296:2225-2229.
Gregoire FM, Smas CM & Sul HS (1998). Understanding adipocyte differentiation. Physiol Rev 78:783-809.
Hirschhorn JN & Daly MJ (2005). Genome-wide association studies for common disease and complex traits. Nat Rev Genet 6:95-108.
Kadowaki T, Hara K, Yamauchi T, Terauchi Y, Tobe K & Nagai R (2003). Molecular mechanism of insulin resistance and obesity.
Exp Biol Med (Maywood) 228:1111-1117.
Kamps MP, Murre C, Sun X & Baltimore D (1990). A new homeobox gene contributes the DNA binding domain of the t (1;19) translocation protein in pre-B ALL. Cell 60:547-555.
Kitjaroentham A, Hananantachai H, Tungtrongchitr A, Pooudong S
& Tungtrongchitr R (2007). R219K polymorphism of ATP binding cassette transporter A1 related with low HDL in overweight/obese Thai males. Arch Med Res 388:34-38.
Kim SK, Selleri L, Lee JS, Zhang AY, Gu X, Jacobs Y & Cleary ML (2002). Pbx1 inactivation disrupts pancreas development and in Ipf1-deWcient mice promotes diabetes mellitus. Nat Genet 30:430-435.
Loos RJ & Bouchard C (2003). Obesity-is it a genetic disorder? J Intern Med 254:401-425.
Loos RJ & Rankinen T (2005). Gene-diet interactions on body weight changes. J Am Diet Assoc 105:S29-S30.
McCarthy MI (2003). Growing evidence for diabetes susceptibility genes from genome scan data. Curr Diab Rep 3:159-167.
Ng MC, So WY, Cox NJ, Lam VK, Cockram CS, Critchley JA, Bell GI & Chan JC (2004). Genome-wide scan for type 2 diabetes loci in Hong Kong Chinese and confirmation of a susceptibility locus on chromosome 1q21-q25. Diabetes 53:1609-1613.
Nourse J, Mellentin JD, Galili N, Wilkinson J, Stanbridge E, Smith SD & Cleary ML (1990). Chromosomal translocation t (1;19)
results in synthesis of a homeobox fusion mRNA that codes for a potential chimeric transcription factor. Cell 60:535-545.
Park JM, Lee EJ, Ramakrishna S, Cha DH & Baek KH (2008).
Association study for single nucleotide polymorphisms in the CYP17A1 gene and polycystic ovary syndrome. Int J Mol Med 22:249-254.
Purcell S, Cherny SS & Sham PC (2003). Genetic Power Calculator:
design of linkage and association genetic mapping studies of complex traits. Bioinformatics 19:149-150.
Sagerstrom CG (2004). PbX marks the spot. Dev Cell 6:737-738.
Solé X, Guinó E, Valls J, Iniesta R & Moreno V (2006). SNPStats:
a web tool for the analysis of association studies. Bioinformatics 22:1928-1929.
Thameem F, Wolford JK, Bogardus C & Prochazka M (2001).
Analysis of PBX1 as a candidate gene for type 2 diabetes mellitus in Pima Indians. Biochim Biophys Acta 1518:215-220.
Wang H, Chu W, Wang X, Zhang Z & Elbein SC (2005). Evaluation of sequence variants in the pre-B cell leukemia transcription factor 1 gene: a positional and functional candidate for type 2 diabetes and impaired insulin secretion. Mol Genet Metab 86:384-391.
World Health Organization Expert Consultation (2004). Appropriate body-mass index for Asian populations and its implications for policy and intervention strategies. Lancet 363:157-163.
Xiang K, Wang Y, Zheng T, Jia W, Li J, Chen L, Shen K, Wu S, Lin X, Zhang G, Wang C, Wang S, Lu H, Fang Q, Shi Y, Zhang R, Xu J & Weng Q (2004). Genome-wide search for type 2 diabetes/
impaired glucose homeostasis susceptibility genes in the Chinese:
significant linkage to chromosome 6q21-q23 and chromosome 1q21-q24. Diabetes 53:228-234.