INTRODUCTION
Recurrent cardiac ischemic events are equally attributed
Characteristics Detected on Computed Tomography
Angiography Predict Coronary Artery Plaque Progression in Non-Culprit Lesions
Yahang Tan, MD
1, 2, Jia Zhou, MD
1, 3, Ying Zhou, MD
1, 4, Xiaobo Yang, MD
1, 2, Junjie Yang, MD
1, Yundai Chen, MD
11Department of Cardiology, Chinese PLA General Hospital, Beijing 100853, China; 2The School of Medicine, Nankai University, Tianjin 300071, China; 3Department of Cardiology, Tianjin Chest Hospital, Tianjin 300000, China; 4Department of Cardiology, Beijing Shijitan Hospital, Capital Medical University, Beijing 100038, China
Objective: This study sought to determine whether variables detected on coronary computed tomography angiography
(CCTA) would predict plaque progression in non-culprit lesions (NCL).
Materials and Methods: In this single-center trial, we analyzed 103 consecutive patients who were undergoing CCTA and
percutaneous coronary intervention (PCI) for culprit lesions. Follow-up CCTA was scheduled 12 months after the PCI, and all patients were followed for 3 years after their second CCTA examination. High-risk plaque features and epicardial adipose tissue (EAT) volume were assessed by CCTA. Each NCL stenosis grade was compared visually between two CCTA scans to detect plaque progression, and patients were stratified into two groups based on this. Logistic regression analysis was used to evaluate the factors that were independently associated with plaque progression in NCLs. Time-to-event curves were compared using the log-rank statistic.
Results: Overall, 34 of 103 patients exhibited NCL plaque progression (33%). Logistic regression analyses showed that the NCL
progression was associated with a history of ST-elevated myocardial infarction (odds ratio [OR] = 5.855, 95% confidence interval [CI] = 1.391–24.635, p = 0.016), follow-up low-density lipoprotein cholesterol level (OR = 6.832, 95% CI = 2.103–
22.200, p = 0.001), baseline low-attenuation plaque (OR = 7.311, 95% CI = 1.242–43.028, p = 0.028) and EAT (OR = 1.015, 95% CI = 1.000–1.029, p = 0.044). Following the second CCTA examination, major adverse cardiac events (MACEs) were observed in 12 patients, and NCL plaque progression was significantly associated with future MACEs (log rank p = 0.006).
Conclusion: Noninvasive assessment of NCLs by CCTA has potential prognostic value.
Keywords: Non-culprit lesion; Plaque progression; Low attenuation plaque; Coronary artery; Epicardial adipose tissue; Coronary computed tomography angiography
Received June 25, 2016; accepted after revision October 3, 2016.
Corresponding author: Yundai Chen, MD, Department of Cardiology, Chinese PLA General Hospital, Beijing 100853, China.
• Tel: (8610) 55499009 • Fax: (8610) 55499009
• E-mail: [email protected]
This is an Open Access article distributed under the terms of the Creative Commons Attribution Non-Commercial License (http://creativecommons.org/licenses/by-nc/4.0) which permits unrestricted non-commercial use, distribution, and reproduction in any medium, provided the original work is properly cited.
Korean J Radiol 2017;18(3):487-497
to culprit and non-culprit lesions (NCLs) in patients with acute coronary syndrome (ACS) (1). Among NCL patients, the lesions that are deemed to be responsible for these events are frequently characterized as mild (2); however, subsequent post-mortem studies on patients who died from major adverse cardiovascular events (MACEs) indicate that stenosis remains the strongest predictor of future events.
Recent analyses may suggest an explanation for these discrepancies, with early studies failing to account for comorbidities, such as severe plaque progression, based on serial angiography and intravascular ultrasound (IVUS) (3).
As an important noninvasive imaging modality, coronary
pISSN 1229-6929 · eISSN 2005-8330
computed tomography angiography (CCTA) not only exhibits high diagnostic accuracy for significant stenosis but also accurately assesses coronary plaque morphology in combination with epicardial adipose tissue (EAT) volume (4, 5). Beyond these functions, CCTA is currently applied to assess serial changes in plaques (6), with high-risk plaques and EAT volumes significantly associated with acute cardiovascular events (7, 8). However, despite these extensive studies, the association between high-risk plaque features and EAT volume in cases of NCL plaque stenosis progression has not been evaluated, due in part to the lack of sufficient evidence regarding baseline features associated with progressive plaques. We intended to investigate the relationship between variables detected on CCTA and NCL plaque progression.
MATERIALS AND METHODS
Study Population
This study enrolled patients who had been successively treated by percutaneous coronary intervention (PCI) within 2 weeks after CCTA between August 1, 2011, and February 26, 2013, at the Chinese People’s Liberation Army (PLA) General Hospital, Beijing, China. Upon enrollment, patients were scheduled for second CCTA examinations 12 months after the PCI and 3-year follow-up examinations after the second CCTA. During each CCTA examination, all relevant clinical and laboratory outcomes associated with cardiac risk factors were collected. Laboratory data including total cholesterol (TC), low-density lipoprotein cholesterol (LDL-C), high-density lipoprotein cholesterol, and triglyceride levels were obtained. Blood samples were collected within 1 week of CCTA, either before or after. We recorded all medical therapies prescribed after the first CCTA examination including aspirin, clopidogrel, statins, angiotensin-
Fig. 1. Flow chart illustrating study population. CABG = coronary artery bypass grafting surgery, CAD = coronary artery disease, CCTA = coronary computed tomography angiography, MACE = major adverse cardiovascular event, PCI = percutaneous coronary intervention
Consecutive patients who underwent CCTA for evaluation of CAD (n = 3012)
Patients with PCI for culprit lesion based on first CCTA result in our centre (n = 437)
Patients with follow-up CCTA at about 12 months after PCI (n = 167)
103 eligible patients and follw-up for three years
1. Poor and significantly reduced image quality (n = 219)
2. History of CABG (n = 67)
3. Inadequate clinical and laboratory data (n = 467)
4. Severe calcification (n = 257)
5. Patients without multi-vessels diseases (n = 1565)
1. Poor and significantly reduced image quality (n = 19)
2. Inadequate clinical and laboratory data (n = 14)
3. Severe calcification (n = 28) 4. Occurrence of MACE between first and
second CCTA (n = 3) 1. Patients without non-culprit lesion
after PCI (n = 249)
2. Failure to finish PCI for culprit lesion (n = 21)
converting enzyme inhibitors or angiotensin II receptor blockers, and β-blockers.
The study was carried out in accordance with the code of Ethics of the World Medical Association (Declaration of Helsinki); the patients provided written informed consent prior to their inclusion in the study. The relevant protocols were approved by the Ethic Committees of the Chinese PLA General Hospital. Pharmaceutical and lifestyle changes were managed after the PCI according to AHA/ACC guidelines (9).
The exclusion criteria were as follows: 1) history of coronary artery bypass grafting surgery; 2) inadequate clinical and laboratory data; 3) poor or significantly reduced image quality based on the Likert scale at either baseline or follow-up CCTA (10); 4) severe calcification deemed non- evaluable lumen-diameter stenosis at either baseline or follow-up CCTA; 5) no NCLs after PCI; 6) failure to finish the PCI for the culprit lesion at our center; or 7) occurrence of MACEs between the first and second CCTA. Finally, a total of 103 patients were enrolled in this study (Fig. 1) between August 2011 and February 2013.
Definitions
A NCL was defined as a de novo stenotic lesion that was not responsible for the ischemic symptoms or positive functional ischemic test outcomes (11). For the purpose of this study, previously untreated patients with stenosis > 30%
of coronary vessel diameter were defined as NCLs (1).
Hypertension was defined as having a history of blood pressure ≥ 140/90 mm Hg or using antihypertensive therapy. Dyslipidemia was defined as a TC level ≥ 220 mg/
dL, LDL-C ≥ 140 mg/dL, or current treatment with lipid- lowering medication. Diabetes mellitus was defined as a fasting plasma glucose level ≥ 126 mg/dL or the use of antidiabetic therapy. Smoking was defined as a self-reported history of current smoking.
CCTA Imaging Protocols
All examinations were performed on a dual-source CT scanner (Definition Flash; Siemens Healthcare, Forchheim, Germany); baseline and follow-up CCTA images were acquired using the same scanner for every patient. The data were acquired using a 2 x 64 x 0.6 mm detector collimation and gantry rotation of 280 ms. Different tube voltages were allocated to different patients based on body mass index (BMI). A tube voltage of 120 kVp was used when BMI ≥ 25 kg/m
2, whereas those with a BMI < 25 kg/m
2were examined using a tube voltage of 100 kVp. All patients received
sublingual nitroglycerin (Nitroglycerin Aerosol; Jewim Pharmaceutical Co., Ltd., Taian, China) 3 minutes before their scans, and 60–80 mL contrast agent (based on body weight) was administered by intravenous injection (12).
Based on heart rates, different scanning protocols such as prospectively ECG–triggered high-pitch spiral double scans, step-on sequences, or retrospective spiral scans were allocated to different patients as appropriate. The CCTA image data were transferred to a workstation for multi-modality post-processing (MMWP 2011A, Siemens Healthcare).
CCTA Imaging Analysis
Coronary computed tomography angiography images were analyzed by two experienced cardiologists who were blinded to the patients’ clinical information and outcomes, and all NCLs with a diameter ≥ 2 mm were examined. We excluded from this assessment segments that had been previously treated with a stent because mechanical interventions have been shown to affect plaque assessment. NCLs were examined in every patient: if multiple NCLs were present, the vessel with the largest decrease in diameter between two CCTA scans was used as the lesion to analyze for that patient. We categorized the severity of NCL stenosis into four grades by visual estimation: 1–49% for mild stenosis, 50–70% for moderate stenosis, and either > 70% or > 99%
for severe stenosis or occlusion (13). We defined plaque progression in the NCLs as an increase in the stenosis grade at the follow-up CCTA examination (14). We first identified the site that exhibited the largest increase in stenosis, and from there we marked an area 5 mm proximal and 5 mm distal, for a total vessel length of 10 mm; we then analyzed high-risk plaque characteristics such as low attenuation plaque (LAP), positive remodeling (PR), and spotty calcification (SC). We defined the remodeling index as the cross-sectional area with maximal stenosis divided by the reference lesion’s cross-section area, and we used a threshold of ≥ 1.1 to define PR (15, 16). We defined LAP as
< 30 Hounsfield units (HU) within focal areas of interest in
the plaque SC, which we defined as small calcified plaques
with a diameter < 3 mm (5, 17). We measured plaque
volume automatically based on attenuation (quantitative
coronary analysis, syngo Circulation; Siemens Healthcare)
and defined medium attenuation plaque as 30–150 HU. We
defined calcified plaque as 350–1000 HU and defined lumen
attenuation as 150–350 HU. We also analyzed each index
lesion for total plaque volume.
We measured the EAT volume at baseline using volume analysis software (syngo Volume, Siemens Healthcare). From the bifurcation of the pulmonary artery to the diaphragm, we used all of the axial slices surrounding the heart for the analyses. Separately, we manually extracted 7 to 10 equidistant axial planes in parallel, and in each plane, the software automatically generated the region of interest by manually tracing with 8 to 12 control points. A threshold attenuation value of -195 to -45 HU units was then applied to isolate EAT. Finally, the software automatically calculated the EAT volume. Two experienced cardiologists performed all measurements who had been blinded to the patients’
clinical information.
Clinical Endpoints and Definitions
The pre-specified primary endpoint was the occurrence of
a MACE, including myocardial infarction (MI) and unstable angina pectoris, after the second CCTA examination required immediate revascularization. MI was diagnosed based on the typical chest pain, elevated myocardial enzyme levels, and typical changes on electrocardiogram. We defined unstable angina pectoris based on the Braunwald Unstable Angina Classification. Patients’ follow-up was conducted in 4-month intervals after the completion of the second CCTA examination. A telephone interviewer contacted each patient to inquire about MACEs.
Statistical Analyses
The JMP software package (version 9.2; SAS Institute Inc., Cary, NC, USA) and SPSS 22.0 (IBM Corporation, Armonk, NY, USA) was used for all statistics analyses.
Continuous variables were compared using Student’s t
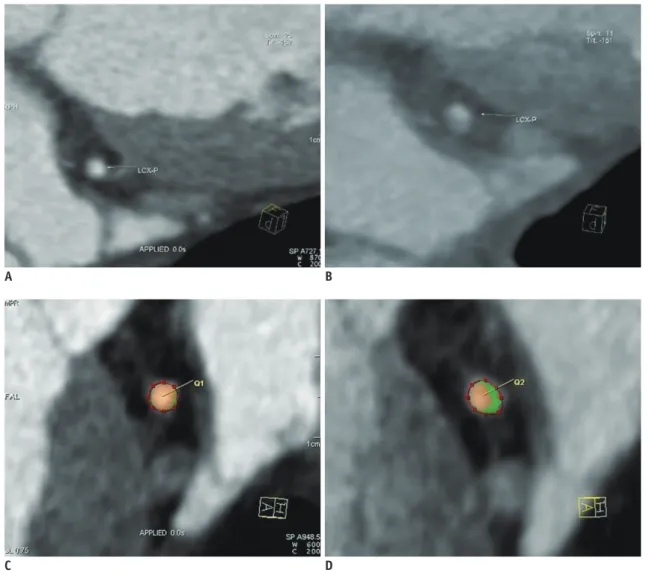
Fig. 2. Assessment of plaque progression by CCTA.
A, C. NCL in baseline MPR cross-section and luminal stenosis measurements. B, D. Same lesion at follow-up CCTA. CCTA = coronary computed tomography angiography, MPR = multiplanar reconstruction, NCL = non-culprit lesion
A B
C D
tests or the Mann-Whitney U test as appropriate and are expressed as mean ± standard deviation; the categorical variables, compared with chi-square tests, are expressed as percentages. The significant variables (p < 0.05) were included in the logistic regression analysis to identify factors that were independently associated with NCL plaque progression. The Kaplan-Meier estimation with a log- rank test was used to analyze the influence of NCL plaque progression detected by the second CCTA examination on event-free survival. All p values were two-sided, and a p <
0.05 was considered statistically significant.
RESULTS
Of the 103 patients, the median age was 60 years, 78.6% were male, and 20.39% had diabetes mellitus. NCL progression was observed in 34 (33%) of 103 patients (Fig.
2). Among the patients who showed NCL progression, 12 progressed from mild to moderate stenosis, 8 from mild to severe stenosis, and 14 from moderate to severe stenosis.
The average intra-reader variability for the two cardiologists was < 3 mL, reflecting a high degree of reliability among the EAT volume measurements.
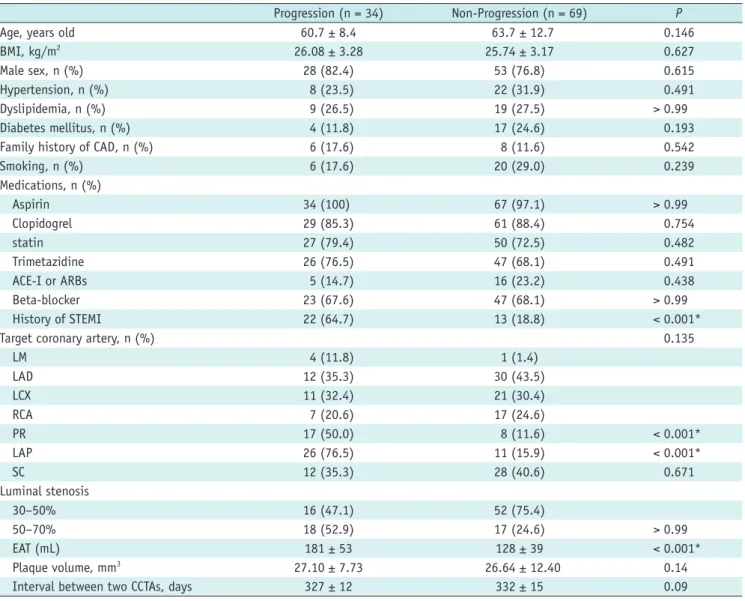
Table 1. Baseline Demographics and Plaque Characteristics
Progression (n = 34) Non-Progression (n = 69) P
Age, years old 60.7 ± 8.4 63.7 ± 12.7 0.146
BMI, kg/m2 26.08 ± 3.28 25.74 ± 3.17 0.627
Male sex, n (%) 28 (82.4) 53 (76.8) 0.615
Hypertension, n (%) 8 (23.5) 22 (31.9) 0.491
Dyslipidemia, n (%) 9 (26.5) 19 (27.5) > 0.99
Diabetes mellitus, n (%) 4 (11.8) 17 (24.6) 0.193
Family history of CAD, n (%) 6 (17.6) 8 (11.6) 0.542
Smoking, n (%) 6 (17.6) 20 (29.0) 0.239
Medications, n (%)
Aspirin 34 (100) 67 (97.1) > 0.99
Clopidogrel 29 (85.3) 61 (88.4) 0.754
statin 27 (79.4) 50 (72.5) 0.482
Trimetazidine 26 (76.5) 47 (68.1) 0.491
ACE-I or ARBs 5 (14.7) 16 (23.2) 0.438
Beta-blocker 23 (67.6) 47 (68.1) > 0.99
History of STEMI 22 (64.7) 13 (18.8) < 0.001*
Target coronary artery, n (%) 0.135
LM 4 (11.8) 1 (1.4)
LAD 12 (35.3) 30 (43.5)
LCX 11 (32.4) 21 (30.4)
RCA 7 (20.6) 17 (24.6)
PR 17 (50.0) 8 (11.6) < 0.001*
LAP 26 (76.5) 11 (15.9) < 0.001*
SC 12 (35.3) 28 (40.6) 0.671
Luminal stenosis
30–50% 16 (47.1) 52 (75.4)
50–70% 18 (52.9) 17 (24.6) > 0.99
EAT (mL) 181 ± 53 128 ± 39 < 0.001*
Plaque volume, mm3 27.10 ± 7.73 26.64 ± 12.40 0.14
Interval between two CCTAs, days 327 ± 12 332 ± 15 0.09
Data are expressed as mean ± SD, percentages as appropriate. *p < 0.05. ACEI = angiotensin-converting enzyme inhibitors, ARBs =
angiotensin II receptor blockers, BMI = body mass index, CAD = coronary artery disease, CCTA = coronary computed tomography angiography, EAT = epicardial adipose tissue, LAD = left anterior descending, LAP = low-attenuation plaque, LCX = left circumflex artery, LM = left main, NCL = non-culprit lesion, PR = positive remodeling, RCA = right coronary artery, SC = spotty calcification, STEMI = ST-elevation myocardial infarction
Baseline Demographics and Plaque Characteristics The baseline clinical characteristics of patients with and without NCL progression are presented in Table 1. Patients with NCL progression were more likely to exhibit a history of previous ST-elevation myocardial infarction (STEMI) (64.7%
vs. 18.8 %, p < 0.001), PR (50.0% vs. 11.6%, p < 0.001), LAP (76.5% vs. 15.9%, p < 0.001), and a high EAT volume (181 ± 53 vs. 128 ± 39, p < 0.001). No other differences attained statistical significance.
The Lipid Profile and NCL Progression
Baseline TC levels were significantly higher in the progression NCL group compared with the non-progression group at both baseline and follow-up CCTA (3.91 ± 0.95 mmol/L vs. 3.54 ± 0.66 mmol/L, p = 0.039). LDL-C levels
were significantly greater in patients with NCL progression compared with those with no progression at the time of follow-up (2.51 ± 0.88 mmol/L vs. 1.77 ± 0.51 mmol/L, p <
0.001) (Table 2).
Assessing the Stents in the Culprit Lesions on the Follow-Up CCTA
There was no significant in-stent restenosis of the treated culprit lesions in either group. Neointimal hyperplasia was observed in patients both with and without LDL progression at the time of follow-up (5.9% vs. 11.6%, p = 0.491).
Factors Association with NCL Progression Identified by Logistic Regression Analysis
Logistic analyses that incorporated history of STEMI,
Table 2. Lipid Profile and Progression of Non-Culprit Lesion
Progression (n = 34) Non-Progression (n = 69) P
TC (mmol/L)
Baseline CCTA 3.91 ± 0.95 3.54 ± 0.66 0.039*
Follow-up CCTA 3.77 ± 0.71 3.64 ± 0.89 0.467
TG (mmol/L)
Baseline CCTA 1.37 ± 0.74 1.42 ± 0.83 0.747
Follow-up CCTA 1.21 ± 0.56 1.34 ± 0.75 0.340
LDL-C (mmol/L)
Baseline CCTA 2.27 ± 0.74 2.13 ± 0.73 0.356
Follow-up CCTA 2.51 ± 0.88 1.77 ± 0.51 < 0.001*
HDL-C (mmol/L)
Baseline CCTA 1.05 ± 0.35 1.12 ± 0.39 0.354
Follow-up CCTA 1.05 ± 0.35 1.12 ± 0.35 0.266
Data are expressed as mean ± SD. *p < 0.05. CCTA = coronary computed tomography angiography, HDL-C = high-density lipoprotein cholesterol, LDL-C = low-density lipoprotein cholesterol, TC = total cholesterol, TG = triglyceride
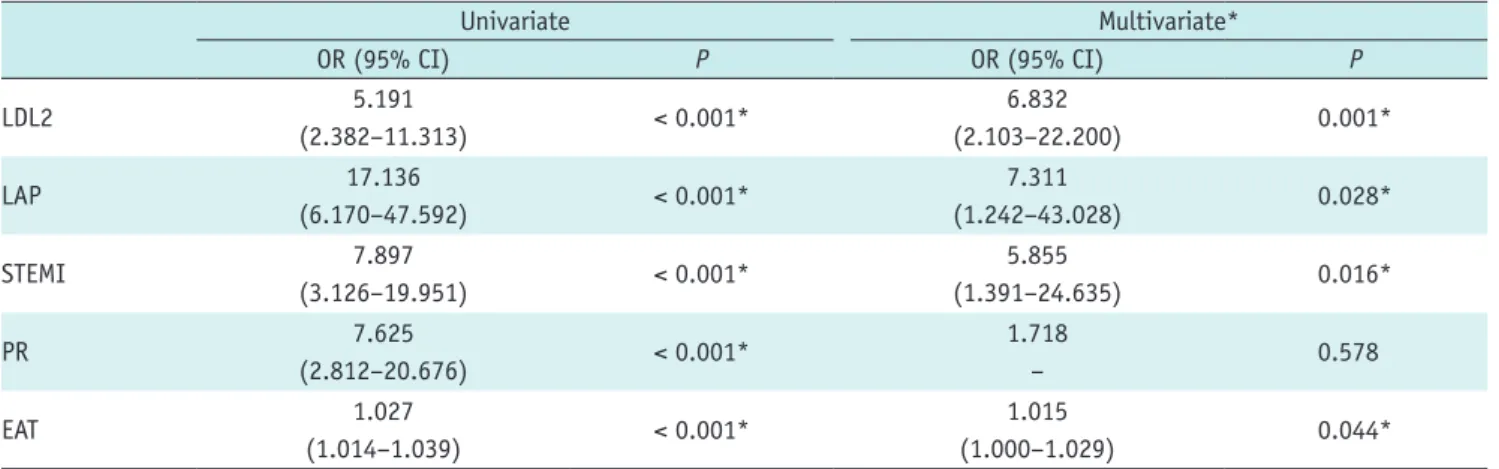
Table 3. Factors Associated with Non-Culprit Lesion Progression Identified by Logistic Regression Analysis
Univariate Multivariate*
OR (95% CI) P OR (95% CI) P
LDL2 5.191
(2.382–11.313) < 0.001* 6.832
(2.103–22.200) 0.001*
LAP 17.136
(6.170–47.592) < 0.001* 7.311
(1.242–43.028) 0.028*
STEMI 7.897
(3.126–19.951) < 0.001* 5.855
(1.391–24.635) 0.016*
PR 7.625
(2.812–20.676) < 0.001* 1.718
– 0.578
EAT 1.027
(1.014–1.039) < 0.001* 1.015
(1.000–1.029) 0.044*
CI and adjusted OR was obtained after controlling for age, sex, BMI, hypertension, hyperlipidemia, diabetes mellitus, family history of CAD, history of medications by logistic regression analysis. *p < 0.05. BMI = body mass index, CI = confidence interval, EAT = epicardial adipose tissue, LAP = low attenuation plaque, LDL2 = follow-up low-density lipoprotein cholesterol, OR = odds ratio, PR = positive remodeling, STEMI = ST-elevation myocardial infarction
LAP, PR, EAT, and LDL-C as independent variables were used to identify factors associated with NCL progression. This analysis showed that a history of STEMI (odds ratio [OR]
= 5.855, 95% confidence interval [CI] = 1.391–24.635, p
= 0.016) or LAP (OR = 7.311, 95% CI = 1.242–43.028, p = 0.028), follow-up LDL levels (OR = 6.832, 95% CI = 2.103–
22.200, p = 0.001), and history of EAT (OR = 1.015, 95%
CI = 1.000–1.029, p = 0.044) were significant independent risk factors for NCL progression (Table 3); the area under the receiver operating characteristic curve was 0.794 for EAT volume alone (95% CI = 0.702–0.885, p < 0.001) (Fig. 3).
Clinical Outcomes
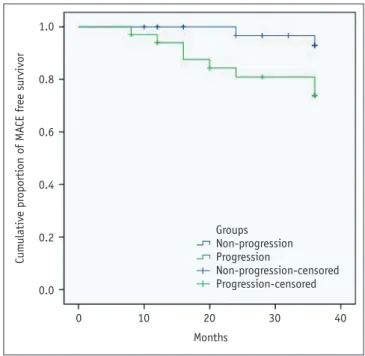
During the 3-year post-CCTA follow-up period, MACEs occurred in 12 patients. In the progression group, unstable angina pectoris requiring immediate revascularization occurred in 6 patients and MI occurred in 2. In the non- progression group, unstable angina pectoris requiring immediate revascularization occurred in 1 patient and MI in an additional 3. In the Kaplan-Meier curve analysis, the progression group had an increased rate of NCLs related to MACEs, driven mainly by a higher revascularization rate and unstable or progressive angina symptoms during follow-up, as compared with the non-progression group (p = 0.006) (Fig. 4).
DISCUSSION
In the present analysis, we evaluated the associations between features detected on CCTA and NCL plaque progression, and we found that baseline LAP and EAT volume, follow-up LDL-C levels, and a history of STEMI were all independently associated with this progression.
Our results suggest that CCTA-based assessment of
imaging characteristics can predict NCL plaque progression independent of traditional risk factors, and NCL plaque progression was significantly associated with future MACEs.
To our knowledge, this is the first description of the use of CCTA-based features to evaluate NCL plaque progression over time. This finding highlights the potential value of CCTA in identifying high-risk NCL and predicting disease outcomes.
LDL-C Levels and NCL Plaque Progression
Atherosclerotic progression in NCLs has been observed in patients who failed to achieve optimum LDL-C levels (14). Extensive studies highlight the pivotal role of hyperlipidemia in the pathogenesis of atherosclerosis (18).
Lowering LDL-C levels using statins has been demonstrated to slow plaque progression due to absolute reductions in LDL-C levels; in our study, these levels were higher at follow-up than at baseline in patients with NCL plaque
Fig. 3. Area under receiver operating characteristic curve was 0.794 for EAT volume alone (95% CI = 0.702–0.885, p <
0.0001). CI = confidence interval, EAT = epicardial adipose tissue 100
80
60
40
20
0
Sensitivity
0 20 40 60 80 100 100-specificity
Fig. 4. Kaplan-Meier curves for MACE-free survivor during 3-year post-CCTA follow-up period. CCTA = coronary computed tomography angiography, MACE = major adverse cardiovascular event
1.0
0.8
0.6
0.4
0.2
0.0
Cumulative proportion of MACE free survivor
0 10 20 30 40
Months Groups Non-progression Progression
Non-progression-censored Progression-censored
progression. Patients’ noncompliance and statin intolerance were the two main underliers of this finding. However, these observations were not investigated further.
In our study, NCL plaque progression was observed in patients with optimal follow-up LDL-C levels, largely consistent with prior studies. Despite substantial reductions in LDL-C levels, NCL progression continued in many
patients, particularly those with preexisting rather than de
novo NCLs, indicating that other factors likely contribute toNCL plaque progression (19).
History of STEMI and NCL Plaque Progression Our understanding of the association between NCL progression and STEMI is based primarily on two studies in which overall coronary instability was observed in acute myocardial infarction (AMI) (20, 21). A direct comparison of NCL progression in patients with AMI and stable angina found that AMI was a significant risk factor for systematic progression involving multiple coronary artery plaques (22). Subsequent studies showed that AMI accelerated atherosclerosis in a mouse model, identifying that STEMI was an independent determinant of NCL progression (11).
In the data presented here, we found that patients with a history of STEMI had a higher prevalence of NCL progression detected by CCTA, consistent with previous findings.
Characteristics Detected on CCTA and NCL Plaque Progression
Low-attenuation plaque, a high-risk plaque feature, was more frequently seen in patients with ACS (4). Non- obstructive plaque with vulnerable features identified by CCTA was associated with future ACS events (23). In addition, CCTA-verified high-risk plaque was an independent short-term and mid-term predictor of ACS (24). Among patients with visible plaques, those with calcification in the majority of these plaques exhibited a markedly lower risk of coronary heart disease compared with those with no calcification existed in the majority of plaques (25).
Taken together, these publications strongly suggest that plaque consisting of low attenuation parts is associated with poor prognosis. However, a significant limitation of all these studies was that they predicted future cardiovascular events based on plaque features measured from a single time point. While the prognosis value of CCTA is important for routine patient care, the ability to evaluate NCL plaque progression before a cardiovascular event is essential because stenosis remains the strongest predictor of ACS.
In the present study, we examined the likelihood of future MACEs in the context of NCL plaque progression initiated by high-risk plaque characteristics; high-risk plaques were observed in both NCLs and culprit lesions. The Providing Regional Observations to Study Predictors of Events in the Coronary Tree (PROSPECT) study demonstrated that clinical and angiographic information have poor predictive value in discriminating patients with untreated high-risk plaques and emphasized a need for more comprehensive plaque features detected by CCTA for more accurate risk stratification (26). In our study, we identified CCTA- verified LAP at baseline as an independent predictor of NCL stenosis progression. This process can be progressive, episodic with repeated silent plaque ruptures and healing, or characterized by worsening luminal stenosis with plaque rupture developing in lesions with large necrotic cores (27). LAP is a consistent high-risk plaque feature of lipid- rich plaques that contain large necrotic cores as assessed by virtual histology-IVUS (28). In a histogram analysis, lipid-rich plaques exhibited a higher percentage of areas with low CT attenuation values compared with plaques of predominantly fibrous components (29). The evidence presented here of increased LAP in patients with worsening NCLs was consistent with the results of the PROSPECT study, in which non-culprit plaque progression was induced by the cycle of necrotic core formation, rupture, and healing (27).
However, our study extended beyond what can be inferred from PROSPECT because our patients underwent a second CCTA, which enabled comparisons between baseline and follow-up plaque stenosis. Such an analysis is consistent with a recent study that suggested that patients with high- risk plaque can benefit from serial CCTAs (24). Based on these analyses, it may be prudent to focus on NCL plaque progression in patients with CCTA-verified LAP at baseline.
Evidence of an association between EAT and NCL plaque
progression is strongly supported by recent clinical
investigations that identified a high EAT volume as a
predictor of MACEs independent of conventional risk factors
(8), and other studies strongly supported the role of EAT
in atherosclerosis inception and progression (30). Despite
these associations, little is known regarding the role of
EAT in patients with NCL plaque stenosis progression after
successful PCI. Our results demonstrated the association
between EAT volume and NCL plaque progression in the
patients who received serial CCTA examinations after
successful PCI as determined by the CCTA exams, consistent
with previous clinical investigations as well as observations
in porcine modes of disease (30). Atherosclerosis was found to progress both proximally and distally relative to the site of EAT resection but not in segments that underlay EAT-resected areas. Beyond the link between epicardial fat volume and traditional risk factors, a number of trials have also shown a link between high epicardial fat volume and progression of coronary atherosclerosis, with no such correlation seen in patients with low epicardial fat volumes (31). Along these lines, EAT has been identified as an independent predictor of ACS and is thought to affect the development of atherosclerosis (32).
Recent studies showed that EAT volume is an independent predictor of in-stent restenosis (33), but due to the short interval between the two CCTAs in our study, we did not find significant restenosis for the culprit lesions; only a few culprit lesions with neointimal hyperplasia in the stent were observed.
CCTA and NCL Progression
Recent updates to the clinical practice guideline for managing NCL in STEMI patients address a variety of advances in NCL therapy. However, an optimal method for evaluating NCLs is still needed due in part to insufficient data regarding the optimal timing of non-culprit vessel PCI.
Previous studies have demonstrated the ability of CCTA to identify plaque progression over time (14), and multicenter trials such as the PROSPECT study have also emphasized the need for more comprehensive testing of NCL plaque morphology using noninvasive imaging for more accurate risk stratification. The data presented here strongly suggest that follow-up CCTA assessment of NCLs improved the non- invasive diagnosis of NCL progression and identified high- risk NCLs for further examination.
Potential Clinical Implications
Identifying high-risk NCLs that are prone to plaque progression may be useful for predicting MACEs. Although IVUS remains the gold standard for assessing plaque progression, it is limited by its invasive nature and is not suitable for routine clinical testing. Furthermore, both clinical and angiographic characteristics have failed to identify high-risk NCLs as predicting future adverse events.
Identifying a non-invasive method for predicting disease outcomes may present a more attractive alternative to comprehensive three-vessel imaging assessment, which could help identify high-risk lesions and improve risk assessment and disease management in at-risk patients.
Study Limitations
The small, single-center nature of this study is its most significant limitation, but the potential for selection bias is also an important consideration given the small number of patients who underwent serial CCTA examinations. Large- scale multicenter prospective studies are therefore necessary to confirm the results of this study to establish better models of NCL risk stratification. Secondly, compared with the PROSPECT trial, more definitive plaque information such as presence of a thin-cap fibroatheroma, plaque burden, or minimal lumen area could not be analyzed by CCTA, although correlations between high-risk plaque features detected on CCTA and vulnerable plaques detected by IVUS and optical coherence tomography have been reported;
the referral bias made it difficult to perform adequate comparisons with the PROSPECT trial. Third, most MACE outcomes were largely by driven by revascularization, which is considered a “soft endpoint.” We were unable to obtain follow-up angiography data for all patients after the second CCTA examination, and thus other factors that affect disease outcomes, such as treated culprit lesions, could not be eliminated. Finally, the methodology of quantitative plaque volume analysis by Siemens software was not well-validated against IVUS or other high-resolution imaging modalities, but we did not assess plaque progression with this software volume; the software did provide some supplementary information about plaque volume.
Conclusion
This study showed that serial CCTA evaluation allows for assessing interval changes in NCL and identifying clear associations between NCL plaque progression and baseline features detected on CCTA. This CCTA study provides new data that reveal clear associations among baseline LAP, EAT volume, and NCL plaque progression, even after adjustment for conventional risk factors. Additional studies will be necessary to establish a new model of NCL risk stratification.
REFERENCES
1. Stone GW, Maehara A, Lansky AJ, de Bruyne B, Cristea E, Mintz GS, et al. A prospective natural-history study of coronary atherosclerosis. N Engl J Med 2011;364:226-235 2. Glaser R, Selzer F, Faxon DP, Laskey WK, Cohen HA, Slater
J, et al. Clinical progression of incidental, asymptomatic lesions discovered during culprit vessel coronary intervention.
Circulation 2005;111:143-149
3. Narula J, Kovacic JC. Putting TCFA in clinical perspective. J Am Coll Cardiol 2014;64:681-683
4. Motoyama S, Kondo T, Sarai M, Sugiura A, Harigaya H, Sato T, et al. Multislice computed tomographic characteristics of coronary lesions in acute coronary syndromes. J Am Coll Cardiol 2007;50:319-326
5. Motoyama S, Sarai M, Harigaya H, Anno H, Inoue K, Hara T, et al. Computed tomographic angiography characteristics of atherosclerotic plaques subsequently resulting in acute coronary syndrome. J Am Coll Cardiol 2009;54:49-57 6. Inoue K, Motoyama S, Sarai M, Sato T, Harigaya H, Hara T, et
al. Serial coronary CT angiography-verified changes in plaque characteristics as an end point: evaluation of effect of statin intervention. JACC Cardiovasc Imaging 2010;3:691-698 7. Motoyama S, Sarai M, Narula J, Ozaki Y. Coronary CT
angiography and high-risk plaque morphology. Cardiovasc Interv Ther 2013;28:1-8
8. Hajsadeghi F, Nabavi V, Bhandari A, Choi A, Vincent H, Flores F, et al. Increased epicardial adipose tissue is associated with coronary artery disease and major adverse cardiovascular events. Atherosclerosis 2014;237:486-489
9. Gibbons RJ, Abrams J, Chatterjee K, Daley J, Deedwania PC, Douglas JS, et al. ACC/AHA 2002 guideline update for the management of patients with chronic stable angina--summary article: a report of the American College of Cardiology/
American Heart Association Task Force on practice guidelines (Committee on the Management of Patients with Chronic Stable Angina). J Am Coll Cardiol 2003;41:159-168 10. Lee AM, Beaudoin J, Engel LC, Sidhu MS, Abbara S, Brady
TJ, et al. Assessment of image quality and radiation dose of prospectively ECG-triggered adaptive dual-source coronary computed tomography angiography (cCTA) with arrhythmia rejection algorithm in systole versus diastole: a retrospective cohort study. Int J Cardiovasc Imaging 2013;29:1361-1370 11. Han Y, Jing J, Tu S, Tian F, Xue H, Chen W, et al. ST elevation
acute myocardial infarction accelerates non-culprit coronary lesion atherosclerosis. Int J Cardiovasc Imaging 2014;30:253- 261
12. Xia Y, Junjie Y, Ying Z, Bai H, Qi W, Qinhua J, et al. Accuracy of 128-slice dual-source CT using high-pitch spiral mode for the assessment of coronary stents: first in vivo experience.
Eur J Radiol 2013;82:617-622
13. Puchner SB, Liu T, Mayrhofer T, Truong QA, Lee H, Fleg JL, et al. High-risk plaque detected on coronary CT angiography predicts acute coronary syndromes independent of significant stenosis in acute chest pain: results from the ROMICAT-II trial. J Am Coll Cardiol 2014;64:684-692
14. Ito H, Motoyama S, Sarai M, Kawai H, Harigaya H, Kan S, et al. Characteristics of plaque progression detected by serial coronary computed tomography angiography. Heart Vessels 2014;29:743-749
15. Hoffmann U, Moselewski F, Nieman K, Jang IK, Ferencik M, Rahman AM, et al. Noninvasive assessment of plaque morphology and composition in culprit and stable lesions in acute coronary syndrome and stable lesions in stable angina
by multidetector computed tomography. J Am Coll Cardiol 2006;47:1655-1662
16. Gauss S, Achenbach S, Pflederer T, Schuhbäck A, Daniel WG, Marwan M. Assessment of coronary artery remodelling by dual-source CT: a head-to-head comparison with intravascular ultrasound. Heart 2011;97:991-997
17. Kashiwagi M, Tanaka A, Kitabata H, Tsujioka H, Kataiwa H, Komukai K, et al. Feasibility of noninvasive assessment of thin-cap fibroatheroma by multidetector computed tomography. JACC Cardiovasc Imaging 2009;2:1412-1419 18. Ueda H, Harimoto K, Tomoyama S, Tamaru H, Miyawaki M,
Mitsusada N, et al. Relation of cardiovascular risk factors and angina status to obstructive coronary artery disease according to categorical coronary artery calcium score. Heart Vessels 2012;27:128-134
19. Bayturan O, Kapadia S, Nicholls SJ, Tuzcu EM, Shao M, Uno K, et al. Clinical predictors of plaque progression despite very low levels of low-density lipoprotein cholesterol. J Am Coll Cardiol 2010;55:2736-2742
20. Rioufol G, Finet G, Ginon I, André-Fouët X, Rossi R, Vialle E, et al. Multiple atherosclerotic plaque rupture in acute coronary syndrome: a three-vessel intravascular ultrasound study. Circulation 2002;106:804-808
21. Asakura M, Ueda Y, Yamaguchi O, Adachi T, Hirayama A, Hori M, et al. Extensive development of vulnerable plaques as a pan- coronary process in patients with myocardial infarction: an angioscopic study. J Am Coll Cardiol 2001;37:1284-1288 22. Guazzi MD, Bussotti M, Grancini L, De Cesare N, Guazzi M, Pera
IL, et al. Evidence of multifocal activity of coronary disease in patients with acute myocardial infarction. Circulation 1997;96:1145-1151
23. Otsuka K, Fukuda S, Tanaka A, Nakanishi K, Taguchi H, Yoshiyama M, et al. Prognosis of vulnerable plaque on computed tomographic coronary angiography with normal myocardial perfusion image. Eur Heart J Cardiovasc Imaging 2014;15:332-340
24. Motoyama S, Ito H, Sarai M, Kondo T, Kawai H, Nagahara Y, et al. Plaque characterization by coronary computed tomography angiography and the likelihood of acute coronary events in mid-term follow-up. J Am Coll Cardiol 2015;66:337-346 25. Criqui MH, Denenberg JO, Ix JH, McClelland RL, Wassel CL,
Rifkin DE, et al. Calcium density of coronary artery plaque and risk of incident cardiovascular events. JAMA 2014;311:271-278 26. Bourantas CV, Garcia-Garcia HM, Farooq V, Maehara A, Xu K,
Généreux P, et al. Clinical and angiographic characteristics of patients likely to have vulnerable plaques: analysis from the PROSPECT study. JACC Cardiovasc Imaging 2013;6:1263-1272 27. Yun KH, Mintz GS, Farhat N, Marso SP, Taglieri N, Verheye
S, et al. Relation between angiographic lesion severity, vulnerable plaque morphology and future adverse cardiac events (from the Providing Regional Observations to Study Predictors of Events in the Coronary Tree study). Am J Cardiol 2012;110:471-477
28. Voros S, Rinehart S, Qian Z, Vazquez G, Anderson H, Murrieta L, et al. Prospective validation of standardized, 3-dimensional,
quantitative coronary computed tomographic plaque measurements using radiofrequency backscatter intravascular ultrasound as reference standard in intermediate coronary arterial lesions: results from the ATLANTA (assessment of tissue characteristics, lesion morphology, and hemodynamics by angiography with fractional flow reserve, intravascular ultrasound and virtual histology, and noninvasive computed tomography in atherosclerotic plaques) I study. JACC Cardiovasc Interv 2011;4:198-208
29. Marwan M, Taher MA, El Meniawy K, Awadallah H, Pflederer T, Schuhbäck A, et al. In vivo CT detection of lipid-rich coronary artery atherosclerotic plaques using quantitative histogram analysis: a head to head comparison with IVUS.
Atherosclerosis 2011;215:110-115
30. Raggi P. Epicardial adipose tissue and progression of coronary artery calcium: cause and effect or simple association? JACC
Cardiovasc Imaging 2014;7:917-919
31. Gauss S, Klinghammer L, Steinhoff A, Raaz-Schrauder D, Marwan M, Achenbach S, et al. Association of systemic inflammation with epicardial fat and coronary artery calcification. Inflamm Res 2015;64:313-319
32. Mahabadi AA, Lehmann N, Kälsch H, Robens T, Bauer M, Dykun I, et al. Association of epicardial adipose tissue with progression of coronary artery calcification is more pronounced in the early phase of atherosclerosis: results from the Heinz Nixdorf recall study. JACC Cardiovasc Imaging 2014;7:909-916
33. Park JS, Choi BJ, Choi SY, Yoon MH, Hwang GS, Tahk SJ, et al. Echocardiographically measured epicardial fat predicts restenosis after coronary stenting. Scand Cardiovasc J 2013;47:297-302