Diffusion-weighted magnetic resonance imaging (DW-MRI) is a novel imaging technique that reflects microscopic water diffusion using a pair of strong
diffusion gradients. It was developed to map the apparent diffusion coefficient (ADC) (1). Parallel to the development of DW-MRI, there have been advances in Dynamic contrast-enhanced MRI (DCE- MRI). Using the MRI signal and pharmacokinetic models, parameters such as the volume transfer constant of the contrast agent (Ktrans) and the extravas- cular extracellular volume fraction (ve) can be obtained. This allows a qualitative and quantitative evaluation of the angiogenic characteristics of tumors (2-4).
There have been many studies regarding the useful- ness of ADC Values, Ktransor vein differentiating benign from malignant lesions in various organs (5- 10). The ADC value correlates inversely with tissue cellularity. Ktransand vecan characterize tissue vascula- INTRODUCTION
�Received; September 20, 2013�Revised; March 7, 2014
�Accepted; March 11, 2014
Corresponding author : Young Cheol Yoon, M.D.
Department of Radiology, Samsung Medical Center, 50 Ilwon-dong, Gangnam-gu, Seoul 135-710, Korea.
Tel. 82-2-3410-0511, Fax. 82-2-3410-0084 E-mail : [email protected]
This is an Open Access article distributed under the terms of the Creative Commons Attribution Non-Commercial License (http://creativecommons.org/licenses/by- nc/3.0/) which permits unrestricted non-commercial use, distribution, and reproduction in any medium, provided the original work is properly cited.
Diffusion-weighted and Dynamic Contrast-enhanced MRI of Metastatic Bone Tumors: Correlation of the Apparent Diffusion Coefficient, K
transand v e values
Ji Hyun Koo, Young Cheol Yoon, Jae Hoon Kim
Department of Radiology, Samsung Medical Center, Sungkyunkwan University, College of Medicine, Seoul, Korea
Purpose : To investigate whether quantitative parameters derived from Diffusion-weighted magnetic resonance imaging (DW-MRI) correlate with those of Dynamic contrast-enhanced MRI (DCE-MRI).
Materials and Methods: Thirteen patients with pathologically or clinically proven bony metastasis who had undergone MRI prior to treatment were included. The voxel size was 1.367×1.367×5 mm. A dominant tumor was selected and the apparent diffusion coefficient (ADC) value and DCE-MRI parameters were obtained by matching voxels. DCE-MRI data were analyzed yielding estimates of Ktrans(volume transfer constant) and ve. (extravascular extracellular volume fraction).
Statistical analysis of ADC, Ktrans, and vevalue was conducted using Pearson correlation analyses.
Results: Fifteen lesions in pelvic bones were evaluated. Of these, 11 showed a statistically significant correlation (P<0.05) between ADC and Ktrans. The ADC and Ktranswere inversely related in 7 lesions and positively related in 4 lesions. This did not depend on the primary cancer or site of metastasis. The ADC and veof 9 lesions correlated significantly. Of these, 4 lesions were inversely related and 5 lesions were positively related.
Conclusion: Unlike our theoretic hypothesis, there was no consistent correlation between ADC values and Ktransor between ADC values and vein metastatic bone tumors.
Index words : Metastatic bone tumors∙Diffusion-weighted imaging (DWI)∙DCE-MRI∙ADC∙Ktrans∙ve Original Article
ture and are sensitive to differences in blood volume and vascular permeability that can be related to tumor angiogenesis (4, 11). While theoretically useful, there are no standard values that differentiate between lesions, resulting in significant overlap of malignant and benign lesions.
These parameters appear to be heavily influenced by extravascular extracellular space volume. The values may be related superficially. If there were no signifi- cant correlation, this lack of relationship would support the usefulness of a multi-parametric approach to diagnosis using MRI. The objective of this study was to investigate whether the quantitative parameters derived from DWI and DCE-MRI correlate in clinical situations.
Patients
This retrospective study was conducted with an institutional review board-approved waiver of informed consent and was in compliance with HIPAA.
From July 2011 to February 2012, 65 patients with a preliminary diagnosis of bone metastasis who were evaluated with pelvic bone or hip MRI were included in the study. Among them, those with a new diagnosis of a metastatic lesion without a history of chemother- apy or radiation were selected. Forty-one patients were excluded because of the previous treatment history, and 11 patients were excluded because of the MRI artifacts. Finally, 13 patients (6 females and 7 males) aged between 42 and 79 years (mean age, 58 years) with pathologically or clinically proven metasta- sis in the pelvic bones were included in our study.
There were 6 lung cancer patients, 5 breast cancer patients, 1 prostate cancer patient, and 1 renal cell carcinoma patient. Among them, 15 metastatic lesions were evaluated. Two lesions were confirmed as metastatic lesions by biopsy. The others were consid- ered metastatic lesions because they showed progres- sion in size and number during the 6-month follow-up period.
MR imaging technique
All patients underwent either pelvic bone or hip MRI prior to initiating chemotherapy or radiation
therapy. MRI was performed with a 3.0 T scanner (Intera Achieva 3.0 T, Philips Medical System, Best, the Netherlands) using a phased-array body coil.
Conventional MR sequences including T1-weighted (T1W) and T2-weighted (T2W) axial and sagittal images, T1W coronal images, and fat saturated T2W sagittal images were completed before DCE-MRI.
DW-MRI was acquired with a single-shot spin-echo echo-planar imaging sequence in three orthogonal diffusion encoding directions, with three b values (0,400, and 1400 s/mm2), an FOV of 350×350 and an acquisition matrix of 128 × 180. SENSE parallel imaging (acceleration factor=2) and spectral presatura- tion with inversion recovery fat saturation were implemented to reduce image artifact. Subjects were allowed to breathe freely with no gating applied. The DWIs consisted of 20 transverse slices with a slice thickness of 5 mm (no slice gap) and TR/TE of 5000/62 ms for a total scan time of 2 minutes and 15 seconds.
DCE-MRI was obtained using a 3D fast-field echo sequence in the axial plane (TR/TE 1.9/0.9 ms, slice thickness 5 mm, no inter-slice gap, FOV = 350×350, acquisition matrix 128 × 180). With the same FOV and acquisition matrix as those used in DW-MRI, a matched voxel-by-voxel analysis was enabled. Before the injection of contrast material, four pre-contrast T1- FFE sequences (flip angle of 5�, 7.5�, 10�, 12.5�) were completed. Similar geometry was used in order to calculate baseline T1 maps for the axial 3D fast field echo sequence. Following enhancement, images were obtained immediately after a bolus injection of gadolinium DTPA (Gadoteric acid, Guerbet, Roissy CdG, France) at a rate of 3 mL/s with a dose of 0.1 mmol/kg, followed by a flush of 15 mL of normal saline. The DCE-MRI consisted of 100 dynamic images with a temporal resolution of 3 seconds completed over a period of 5 minutes.
Image analysis
ADC maps were automatically generated with the commercial diffusion-analysis software (Extended MR work space, version 2.6.3.1. Philips Healthcare) from DWI. Three b values (0, 400, and 1400 s/mm2) were used, and high b value of 1400 s/mm2was chosen because a b value of around 1400 s/mm2was reported to be optimal for imaging bone marrow according to MATERIALS AND METHODS
the previous report (5).
To quantify the DCE-MRI data, all dynamic data were transferred to a personal computer workstation from the MRI operating console and analyzed using previously validated in-house software (12) written using MATLAB version 7.6 (MathWorks, Natick, MA, USA). The MR signal intensity was converted into an equivalent concentration of contrast agent using the variable flip angle method (13). Pharmacokinetic parameters (Ktransand ve) were estimated using Tofts model (2):
Ct(t) = Ktrans Cp(t) � exp (-Ktrans t / ve)
where Ct(t) is the time dependence of the contrast agent (CA) concentration and Cp(t) is the concentra- tion of CA in blood plasma, or the so called arterial input function (AIF). Arterial input functions were manually defined from an appropriate section that included the superficial femoral artery by applying this model. Data from each DCE-MRI study were fitted with equation (2) voxel-by-voxel to yield estimates of
Ktransand vefor each voxel. The voxel size was 1.367×
1.367×5 mm for each MRI.
The regions of interest (ROIs) were manually drawn for each tumor by an experienced radiologist using MRIcro software (www.mricro.com). A slice with the largest area of enhancement was selected from the
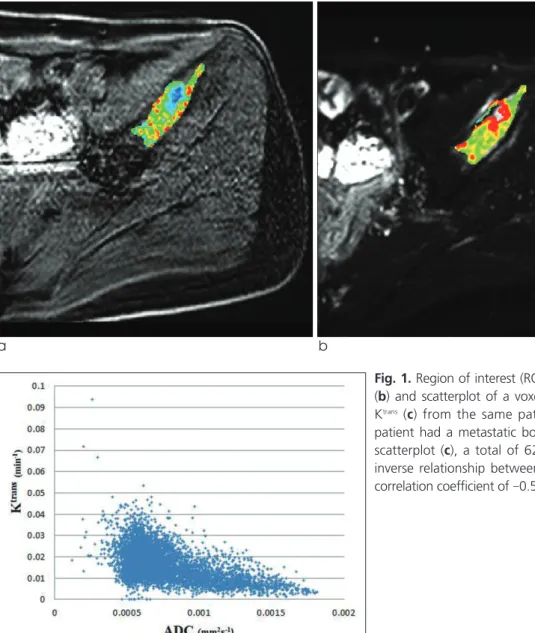
a b
c
Fig. 1. Region of interest (ROI) drawn in Ktransmap (a), ADC map (b) and scatterplot of a voxel-by-voxel comparison of ADC and
Ktrans (c) from the same patient. A 42-year-old breast cancer
patient had a metastatic bone lesion in right iliac bone. In the scatterplot (c), a total of 6217 voxels were evaluated with an inverse relationship between the 2 parameters with a Pearson correlation coefficient of -0.525 and p value of < 0.0001.
mid-phase image set (50 dynamic, at 3 minute) to prevent exclusion of delayed enhancing lesions. The margin of the enhancing area was drawn freehand.
The lesion was then copied and pasted onto the ADC map to allow a matched, voxel-by-voxel evaluation using the same ROI. There are examples of ROI drawn in the ADC map and DCE-MRI images (Figure 1, 2, and 3).
Statistical Analysis
To calculate an overall correlation coefficient, the data from each patient were extracted voxel-by-voxel.
For each parameter, the median value of the voxel- based analysis was calculated to yield one value for the entire lesion area for median value comparison.
Scatterplots of Ktransand vewith ADC were generated for both a voxel-by-voxel analysis and a comparison of
median values. Statistical analysis was performed using the PASW statistical software (version 18.0;
SPSS, Inc., Chicago, IL, USA). Scatterplots of ADC and Ktrans were generated for the voxel-by voxel analysis. Correlation and linear regression analysis of the ADC and Ktransmaps and ADC and vemaps were performed. We computed the Pearson correlation coefficient. P<0.05 was considered significant.
Voxel-by-Voxel Analysis
Fifteen metastatic lesions were detected in the 13 patients. All of the data from each patient was used to compute the overall correlation coefficient. The relationship between these parameters is summarized
RESULTS
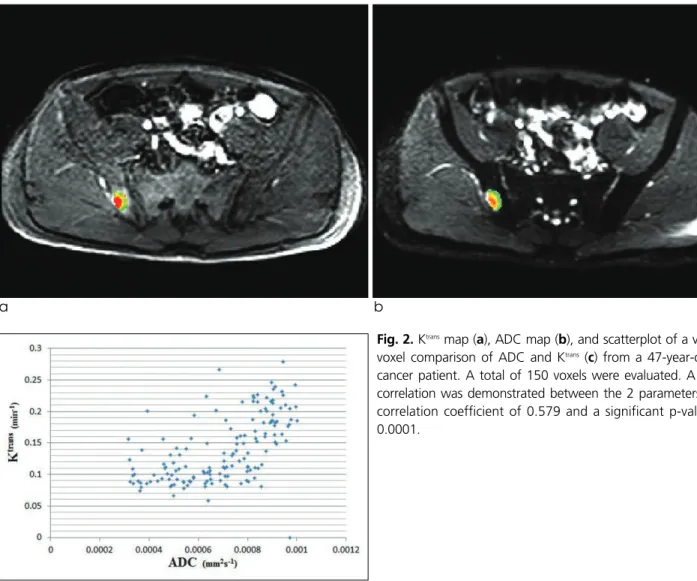
a b
c
Fig. 2. Ktransmap (a), ADC map (b), and scatterplot of a voxel-by- voxel comparison of ADC and Ktrans (c) from a 47-year-old lung cancer patient. A total of 150 voxels were evaluated. A positive correlation was demonstrated between the 2 parameters with a correlation coefficient of 0.579 and a significant p-value of <
0.0001.
in Table 1. The Pearson correlation coefficients for ADC and Ktransranged from -0.534 to 0.579. Eleven lesions had statistically significant Pearson correlation coefficients. Among them, 7 lesions were inversely correlated while 4 lesions showed a positive correla- tion. The Pearson correlation values for ADC and ve
ranged from -0.315 to 0.678. Nine of these lesions reached statistical significance with 4 lesions inversely related and 5 lesions positively related.
Comparison of Median Values
Group analysis was performed after averaging the
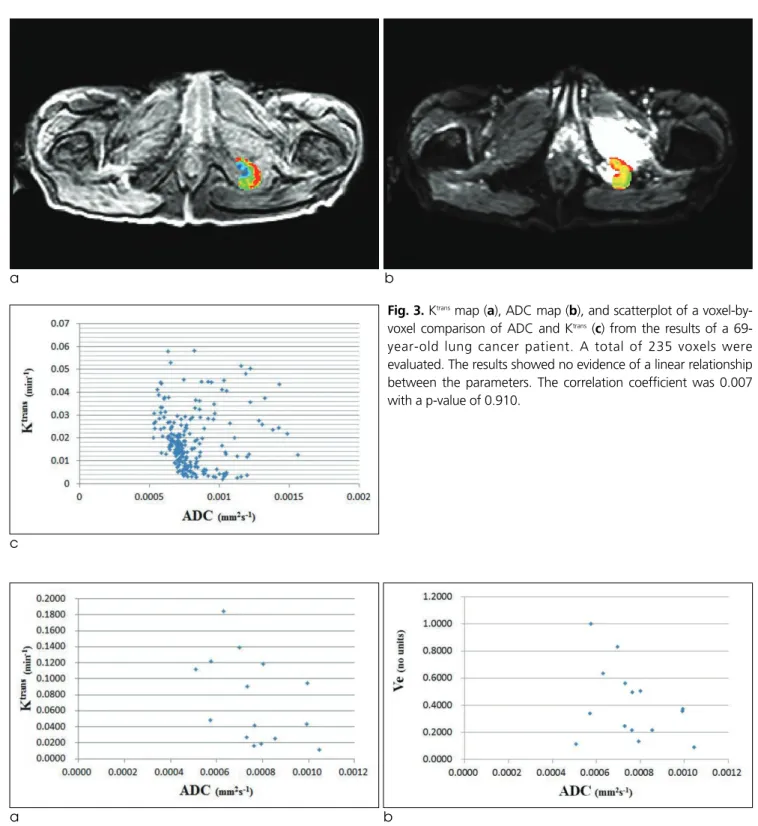
a b
c
Fig. 3. Ktransmap (a), ADC map (b), and scatterplot of a voxel-by- voxel comparison of ADC and Ktrans(c) from the results of a 69- year-old lung cancer patient. A total of 235 voxels were evaluated. The results showed no evidence of a linear relationship between the parameters. The correlation coefficient was 0.007 with a p-value of 0.910.
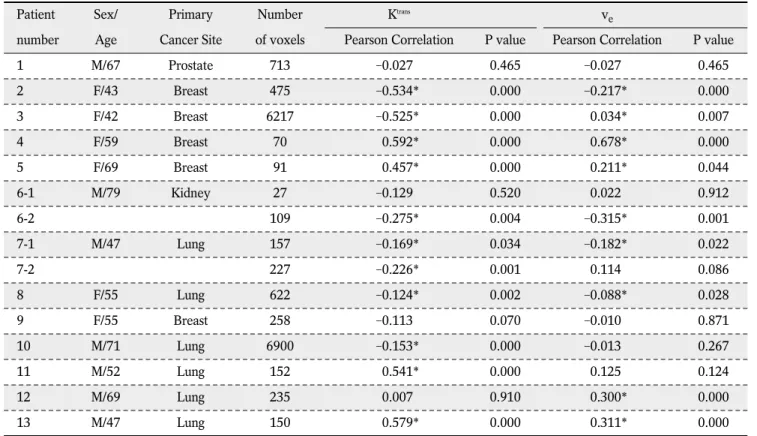
a b
Fig. 4. (a) Scatterplot of a comparison of median ADC and Ktransvalues. (b) Scatterplot of a comparison of median ADC and vevalues.
individual voxels to yield one ADC, one Ktrans, and one vevalue per patient. However, it did not yield a strong correlation either. Figure 4 demonstrates the scatter- plot of median values of ADC versus Ktransand ve, where the Pearson correlation value was -0.464 for
Ktrans (p = 0.081) and -0.355 for ve(p = 0.194).
A lesion with a high Ktransis likely an area of rapid proliferation and increased cell density, which would lead to a decreased ADC value. The ADC value is affected by the distribution of water between the intracellular space and the EES (14-17). The measure- ment of vefrom DCE-MRI is thought to reflect EES volume. Since these Ktrans, ve, and ADC parameters are influenced by the volume of the EES, therefore, one could assume that they also correlate to each other.
This study combines the analysis of DCE-MRI data with ADC mapping in bony metastasis. However, contrary to what was expected, we were unable to
identify a clear relationship between the ADC returned by the analysis of DW-MRI and the Ktrans and vefrom DCE-MRI either by analyzing on a voxel-by- voxel basis or by comparison of median values.
MRI techniques have been developed that can noninvasively obtain an ADC value via DW-MRI. The ADC value describes the rate of diffusion in cellular tissues, which largely depends on the number and separation of barriers that a diffusing water molecule encounters in a specified time interval (18). This method is widely accepted in the clinical evaluation of tumors where the ADC value is often inversely correlated with tumor cell density (1).
The results of this study suggest that our current conceptual understanding of the above parameters is incomplete and simplistic. Furthermore, it suggests that multi-parametric MRI is necessary for an accurate evaluation of bony metastases. If one parameter is subordinate to the other parameter, current MRI protocols should be modified to reflect this hierarchy.
There are several possible explanations for our results. One potential issue is the way in which the DISCUSSION
Table 1. Correlation of Ktransand vewith ADC at 3.0T
Patient Sex/ Primary Number Ktrans ve
number Age Cancer Site of voxels Pearson Correlation P value Pearson Correlation P value
1 M/67 Prostate 713 -0.027 0.465 -0.027 0.465
2 F/43 Breast 475 -0.534* 0.000 -0.217* 0.000
3 F/42 Breast 6217 -0.525* 0.000 -0.034* 0.007
4 F/59 Breast 70 -0.592* 0.000 -0.678* 0.000
5 F/69 Breast 91 -0.457* 0.000 -0.211* 0.044
6-1 M/79 Kidney 27 -0.129 0.520 -0.022 0.912
6-2 109 -0.275* 0.004 -0.315* 0.001
7-1 M/47 Lung 157 -0.169* 0.034 -0.182* 0.022
7-2 227 -0.226* 0.001 -0.114 0.086
8 F/55 Lung 622 -0.124* 0.002 -0.088* 0.028
9 F/55 Breast 258 -0.113 0.070 -0.010 0.871
10 M/71 Lung 6900 -0.153* 0.000 -0.013 0.267
11 M/52 Lung 152 -0.541* 0.000 -0.125 0.124
12 M/69 Lung 235 -0.007 0.910 -0.300* 0.000
13 M/47 Lung 150 -0.579* 0.000 -0.311* 0.000
* Correlation is significant with the p value <0.05.
ADC was measured. Many factors can influence measurements derived from DWI, such as the ADC.
The magnitude, duration, and temporal separation of the matched gradients have an effect on the magnitude of the resulting signal intensity drop on ADC that occurs due to de-phasing and re-phasing gradients.
Therefore, not only will the volume of the EES affect the calculated ADC values, but also the complexity and composition of the EES. The ADC values can also be affected by intrinsic tissue properties such as capillary bed perfusion, intracellular diffusion coeffi- cients, membrane permeability, and exchange times (14, 19). ADC is further susceptible to patient factors including patient motion, incomplete fat suppression, artifacts from biopsy markers and susceptibility- induced distortions (20).
DCE-MRI analysis is typically based on compart- mental models whose requisite assumptions may not be always valid. For example, in some regions, the delivery of contrast agents may not rely entirely on vascular perfusion. Instead, some of the contrast agents may diffuse into the voxel or into the adjacent regions, a possibility not accounted for by compart- mental models. Vecan be measured when contrast medium leaks from the vessels into the EES, but it is not possible to estimate vewhen the tissue is not perfused or when no extravascular contrast leakage occurs. In other words, there may be a large number of voxels within each tumor with an unmeasurably low veand a wide range of possible ADC values (14, 21).
There have been several studies comparing ADC and DCE-MRI parameters, but the results are variable.
Arlinghaus et al. (20) and Mills et al. (14) reported that there was no statistically significant correlation between ADC and veon either a voxel-by-voxel or ROI basis. On the other hand, Chu et al. (22) reported that Ktransvalues were inversely correlated with ADC values (r = -0.536, P<0.001) and Yankeelov et al. (17) reported that ADC and vewere negatively correlated (r = -0.60, P<0.02). These diverse study results suggest that a conventional interpretation of the parameters or their relationship is not sufficient to explain these experimental findings.
There are several further intrinsic limitations to the present study. First, it is a retrospective study with a small sample size that could have been influenced by
selection and verification biases. The small number of patients with adequate imaging and clinical data prevented us from reaching clinical significance. This limitation was unavoidable as patients with bony metastases are usually in terminal stages of their illness, making it difficult to obtain pathological or clinical confirmation of the diagnosis. In an attempt to minimize the limitations of our study, those who had MRI with artifacts were excluded. DW-MRI and DCE- MRI were not obtained simultaneously. Thus, there may have been a certain degree of motion artifact from the studies having been performed at different times. While these were unavoidable difficulties inherent to the study, they again compromised the number of potential subjects. Another limitation was that the patients included in this study had a variety of primary malignancies. Each metastatic lesion might express different characteristics based on the type of primary tumor, affecting the results of DWI or DCE- MRI. Further studies to assess these pathologic differ- ences are warranted. Lastly, only malignant lesions were included in the study, so the study does not explore the role of ADC values, Ktransor vein differen- tiating malignancy from the benign lesions.
In conclusion, although ADC, Ktrans, and veare believed to be affected by the distribution of water between the intracellular space and the extracellular space, the correlation between the parameters is not clear. The results of this study suggest that further investigation into the potential of multi-parametric MRI to provide information on water distribution and geometry in the tumor environment is warranted.
References
1. Anderson AW, Xie J, Pizzonia J, Bronen RA, Spencer DD, Gore JC. Effects of cell volume fraction changes on apparent diffusion in human cells. Magn Reson Imaging 2000;18:689-695 2. Tofts PS, Brix G, Buckley DL, et al. Estimating kinetic parame-
ters from dynamic contrast-enhanced T(1)-weighted MRI of a diffusable tracer: standardized quantities and symbols. J Magn Reson Imaging 1999;10:223-232
3. Zhang N, Zhang L, Qiu B, Meng L, Wang X, Hou BL.
Correlation of volume transfer coefficient K(trans) with histopathologic grades of gliomas. J Magn Reson Imaging 2012;36:355-363
4. Yankeelov TE, Gore JC. Dynamic Contrast Enhanced Magnetic Resonance Imaging in Oncology: Theory, Data Acquisition, Analysis, and Examples. Curr Med Imaging Rev 2009;3:91-107 5. Messiou C, Collins DJ, Morgan VA, Desouza NM. Optimising
diffusion weighted MRI for imaging metastatic and myeloma bone disease and assessing reproducibility. Eur Radiol 2011;21:1713-1718
6. Huang W, Tudorica LA, Li X, et al. Discrimination of benign and malignant breast lesions by using shutter-speed dynamic contrast-enhanced MR imaging. Radiology 2011;261:394-403 7. Thoeny HC, Forstner R, De Keyzer F. Genitourinary applica-
tions of diffusion-weighted MR imaging in the pelvis. Radiology 2012;263:326-342
8. Ginat DT, Mangla R, Yeaney G, Johnson M, Ekholm S.
Diffusion-weighted imaging for differentiating benign from malignant skull lesions and correlation with cell density. AJR Am J Roentgenol 2012;198:W597-601
9. Onur MR, Cicekci M, Kayali A, Poyraz AK, Kocakoc E. The role of ADC measurement in differential diagnosis of focal hepatic lesions. Eur J Radiol 2012;81:e171-176
10. Vermoolen MA, Kwee TC, Nievelstein RA. Apparent diffusion coefficient measurements in the differentiation between benign and malignant lesions: a systematic review. Insights Imaging 2012;3:395-409
11. Langer DL, van der Kwast TH, Evans AJ, et al. Prostate tissue composition and MR measurements: investigating the relation- ships between ADC, T2, K(trans), v(e), and corresponding histologic features. Radiology 2010;255:485-494
12. Kim YS, Lim HK, Kim JH, et al. Dynamic contrast-enhanced magnetic resonance imaging predicts immediate therapeutic response of magnetic resonance-guided high-intensity focused ultrasound ablation of symptomatic uterine fibroids. Invest Radiol 2011;46:639-647
13. Fram EK, Herfkens RJ, Johnson GA, et al. Rapid calculation of T1 using variable flip angle gradient refocused imaging. Magn Reson Imaging 1987;5:201-208
14. Mills SJ, Soh C, Rose CJ, et al. Candidate biomarkers of extravascular extracellular space: a direct comparison of apparent diffusion coefficient and dynamic contrast-enhanced
MR imaging--derived measurement of the volume of the extravascular extracellular space in glioblastoma multiforme.
AJNR Am J Neuroradiol 2010;31:549-553
15. Yang C, Stadler WM, Karczmar GS, Milosevic M, Yeung I, Haider MA. Comparison of quantitative parameters in cervix cancer measured by dynamic contrast-enhanced MRI and CT.
Magn Reson Med 2010;63:1601-1609
16. Oto A, Yang C, Kayhan A, et al. Diffusion-weighted and dynamic contrast-enhanced MRI of prostate cancer: correlation of quantitative MR parameters with Gleason score and tumor angiogenesis. AJR Am J Roentgenol 2011;197:1382-1390 17. Yankeelov TE, Lepage M, Chakravarthy A, et al. Integration of
quantitative DCE-MRI and ADC mapping to monitor treatment response in human breast cancer: initial results. Magn Reson Imaging 2007;25:1-13
18. Gore JC, Xu J, Colvin DC, Yankeelov TE, Parsons EC, Does MD. Characterization of tissue structure at varying length scales using temporal diffusion spectroscopy. NMR Biomed 2010;23:745-756
19. Padhani AR, Husband JE. Dynamic contrast-enhanced MRI studies in oncology with an emphasis on quantification, valida- tion and human studies. Clin Radiol 2001;56:607-620
20. Arlinghaus LR, Li X, Rahman AR, et al. On the relationship between the apparent diffusion coefficient and extravascular extracellular volume fraction in human breast cancer. Magn Reson Imaging 2011;29:630-638
21. Zhu XP, Li KL, Kamaly-Asl ID, et al. Quantification of endothe- lial permeability, leakage space, and blood volume in brain tumors using combined T1 and T2* contrast-enhanced dynamic MR imaging. J Magn Reson Imaging 2000;11:575-585
22. Chu JP, Mak HK, Yau KK, et al. Pilot study on evaluation of any correlation between MR perfusion (Ktrans) and diffusion (apparent diffusion coefficient) parameters in brain tumors at 3 Tesla. Cancer Imaging 2012;12:1-6
통신저자 : 윤영철, (135-710) 서울시 강남구 일원동 50번지, 삼성서울병원 영상의학과
Tel. (02) 3410-0511 Fax. (02) 3410-0084 E-mail: [email protected]
골전이암의 확산강조영상과 역동적 조영증강 자기공명영상:
겉보기 확산계수, Ktrans와 ve값들의 상관관계
성균관대학교 의과대학 삼성서울병원 영상의학과 구지현∙윤영철∙김재훈
목적: 확산강조영상 (DW-MRI)과 역동적 조영증강 자기공명영상 (DCE-MRI)에서 도출한 정량적 매개변수들이 서 로 연관되어 있는지 알아보고자 하였다.
대상과 방법: 치료시작 전 DWI와 DCE-MRI를 시행한 조직학적으로 혹은 임상적으로 진단된 골전이암을 가진 13명 의 환자를 대상으로 하였다. 주 병변의 겉보기 확산계수 (ADC) 그리고 관류지수 중 Ktrans와 Ve 값을 측정하여 Pearson 연관분석을 사용하여 통계적으로 분석하였다.
결과: 15개의 병변 중 11개는 ADC와 Ktrans값 간에 유의한 상관관계를 보였다. 이 중 7개의 병변은 음의 연관성을, 그리고 4개는 양의 연관성을 보였다. 9개의 병변은 ADC와 Ve값 간에 유의한 상관관계를 보였다. 이 중 4개는 음의 연관성을, 그리고 5개는 양의 연관성을 보였다.
결론: 골전이암의 ADC 값과 Ktrans값, 혹은 ADC 값과 Ve값은 일정한 연관성이 없었다.
대한자기공명의과학회지 18:25-33(2014)