Differentiation between Glioblastoma
and Solitary Metastasis: Morphologic
Assessment by Conventional Brain
MR Imaging and Diffusion-Weighted
Imaging
This is an Open Access article distributed under the terms of the Creative Commons Attribution Non-Commercial License (http://creativecommons.org/licenses/ by-nc/4.0/) which permits unrestricted non-commercial use, distribution, and reproduction in any medium, provided the original work is properly cited. Received: December 8, 2019 Revised: January 3, 2021 Accepted: January 4, 2021 Correspondence to: Eun Ja Lee, M.D. Department of Radiology, Dongguk University Ilsan Hospital, 814, Siksa-dong, Ilsandong-gu, Goyang-si, Gyeonggi-do 10326, Korea. Tel. +82-31-961-7836 Fax. +82-31-961-8281 E-mail: [email protected]
Copyright © 2021 Korean Society of Magnetic Resonance in Medicine (KSMRM)
Original Article
Purpose: Differentiating between glioblastoma and solitary metastasis is very important for the planning of further workup and treatment. We assessed the ability of various morphological parameters using conventional MRI and diffusion-based techniques to distinguish between glioblastomas and solitary metastases in tumoral and peritumoral regions.
Materials and Methods: We included 38 patients with solitary brain tumors (21 glioblastomas, 17 solitary metastases). To find out if there were differences in the morphologic parameters of enhancing tumors, we analyzed their shape, margins, and enhancement patterns on postcontrast T1-weighted images. During analyses of peritumoral regions, we assessed the extent of peritumoral non-enhancing lesion on T2- and postcontrast T1-weighted images. We also aimed to detect peritumoral neoplastic cell infiltration by visual assessment of T2-weighted and diffusion-based images, including DWI, ADC maps, and exponential DWI, and evaluated which sequence depicted peritumoral neoplastic cell infiltration most clearly.
Results: The shapes, margins, and enhancement patterns of tumors all significantly differentiated glioblastomas from metastases. Glioblastomas had an irregular shape, ill-defined margins, and a heterogeneous enhancement pattern; on the other hand, metastases had an ovoid or round shape, well-defined margins, and homogeneous enhancement. Metastases had significantly more extensive peritumoral T2 high signal intensity than glioblastomas had. In visual assessment of peritumoral neoplastic cell infiltration using T2-weighted and diffusion-based images, all sequences differed significantly between the two groups. Exponential DWI had the highest sensitivity for the diagnosis of both glioblastoma (100%) and metastasis (70.6%). A combination of exponential DWI and ADC maps was optimal for the depiction of peritumoral neoplastic cell infiltration in glioblastoma.
Conclusion: In the differentiation of glioblastoma from solitary metastatic lesions, visual morphologic assessment of tumoral and peritumoral regions using conventional MRI and diffusion-based techniques can also offer diagnostic information.
Keywords: Glioblastoma; Intracranial metastasis; MR imaging; Diffusion weighted imaging
Bo Young Jung1, Eun Ja Lee1, Jong Myon Bae2, Young Jae Choi1,
Eun Kyoung Lee1, Dae Bong Kim1
1Department of Radiology, Dongguk University Ilsan Hospital, Goyang-si, Korea
INTRODUCTION
Glioblastomas and metastases represent the most-common malignant brain tumors in adults (1). When intracranial tumors are encountered, a history of primary malignancy or the presence of multifocal lesions may assist in the diagnosis of metastasis, but differentiation is often difficult when patients present with a solitary enhancing mass of unknown primary malignancy.
Because the clinical management of these two types of tumor is radically different, it is important to differentiate them. Patients with glioblastomas do not typically require systemic work-up, because tumor invasion outside of the central nervous system is very rare. However, any patient with suspected brain metastasis and no previous history of primary cancer should undergo systemic staging to detect its origin, and any evidence of distant metastasis, before treatment. Standard treatment of glioblastoma consists of maximal surgical resection, radiotherapy, and concomitant and adjuvant chemotherapy. In patients with metastasis, more conservative management (usually a nonsurgical approach) should be considered (2-5).
Conventional magnetic resonance imaging (MRI) is of limited value for the differentiation of glioblastoma from metastasis, because of these tumors’ similar imaging appearances (6-8). Therefore, numerous studies have used advanced MRI techniques, such as MR spectroscopy (MRS), perfusion-weighted imaging (PWI), diffusion tensor imaging (DTI), and measurement of the absolute apparent diffusion coefficient (ADC) in an attempt to differentiate them (2, 3, 9-12). The key to differentiating the two neoplasms lies in the peritumoral region. In glioblastomas, peritumoral non-enhancing T2 high signal intensity is the result of both neoplastic cell infiltration and vasogenic edema, whereas in metastases it results from pure vasogenic edema (12-15). The continued development of advanced MRI techniques has allowed for some success in the differentiation of peritumoral neoplastic cell infiltration from pure vasogenic edema, in the peritumoral region using quantitative methods. However, most investigators have found no significant differences in intratumoral areas using these new techniques (2, 3, 9-12, 16). Furthermore, advanced MRI is not available in all centers and requires more time and expense; this can put great pressure on patients. Quantitative evaluation is not easy, even using advanced MRI techniques, and differential diagnosis remains a challenge with a reported accuracy of < 65% (8, 17). For these reasons, we attempted to assess the diagnostic utility
of MRI sequences that are easier to implement, such as conventional MRI, diffusion-weighted imaging (DWI), ADC maps, and exponential DWI for the differentiation of these tumors. Previous study has indicated that exponential DWI, which represents the negative exponential of ADC maps and depicts diffusion effects more accurately by removing the T2 shine-through effect, is useful for distinguishing tumors (11); therefore, we included this sequence in this study, in which we individually evaluated whether morphological parameters of enhancing tumors can distinguish between glioblastomas and solitary metastases and assessed T2-weighted and diffusion-based images for visual analysis of peritumoral neoplastic cell infiltration in the peritumoral region. We also identified the sequence that depicts peritumoral neoplastic cell infiltration most clearly. To the best of our knowledge, no previous study has considered all these factors.
MATERIALS AND METHODS
This retrospective study was approved by our Institutional Review Board.
Patients
We retrospectively reviewed the MRI examinations of 38 patients with a diagnosis of glioblastoma or solitary metastasis between February 2006 and May 2014. The patients ranged in age from 41 to 87 years (mean age, 62 ± 8.6 years); there were 20 males and 18 females. All patients had a previously untreated solitary enhancing brain tumor and peritumoral non-enhancing lesion and had undergone conventional brain MRI and DWI before surgical intervention. Patients with infratentorial lesion were excluded, as were those with a previous history of surgery or whose peritumoral T2 high-signal lesion was not large enough to evaluate on T2-weighted imaging. Patients with obvious movement artifacts were also excluded. In total, 10 patients were excluded.
Of the 38 patients, WHO grade IV glioblastoma was diagnosed in 21 cases and solitary metastasis in 17. Metastatic brain tumors included lung carcinoma (n = 8), anorectal carcinoma (n = 2), breast carcinoma (n = 1), thyroid carcinoma (n = 1), hepatic cellular carcinoma (n = 1), gall bladder cancer (n = 1), and carcinoma of unknown origin (n = 3). Diagnosis of glioblastoma was made by means of pathology in all patients; diagnosis of solitary metastasis was confirmed pathologically in 13 patients and
was made clinically in the remaining four patients based on their history, MRI findings, and response to palliative chemotherapy and/or radiation therapy.
MRI Techniques
All MRI examinations were done using a 1.5 T MRI scanner (Avanto, Siemens Healthcare, Erlangen, Germany) with a standard head coil. Standard T1- and T2-weighted images, fluid attenuated inversion recovery (FLAIR) images, contrast-enhanced T1 weighted images and DWI were obtained for all patients. The following pulse sequences were acquired.
• For precontrast and contrast-enhanced axial T1-weighted images: repetition time (TR)/echo time (TE)/ inversion time (TI), 1700/14/745 ms; slice thickness, 5 mm; intersection gap, 2 mm; matrix size, 320 × 210; field of view (FOV), 19.3 × 22.0 cm; number of excitation (NEX), 3.
• For axial T2-weighted images: TR/TE, 4480/89 ms; slice thickness, 5 mm; intersection gap, 2 mm; matrix size, 448 × 294; FOV, 19.3 × 22.0 cm, NEX, 2.
• For axial FLAIR images: TR/TE/TI, 4780/93/1745 ms; slice thickness, 5 mm; intersection gap, 2 mm; matrix size, 320 × 196; FOV, 19.3 × 22.0 cm; NEX, 2.
Recently, three-dimensional T1 black-blood fast spin-echo imaging has been found effective for selective suppression of blood vessels and better detection of brain metastases (18), but no patient in our study has obtained this imaging. DWI was done by using a single-shot spin-echo echo-planar imaging sequence with the following parameters (TR/ TE, 6000/63-99 ms; slice thickness, 3 mm; intersection gap, 0.3 mm; matrix size, 140 × 140; FOV, 22.0 × 22.0 cm; NEX, 1). DWI was done in three orthogonal directions using a maximum b-value of 1000 s/mm2. A baseline image with a
b-value of 0 s/mm2 was also obtained.
A cerebrospinal fluid suppression pulse was implemented to avoid diffusion falsely elevated by cerebrospinal fluid partial-volume averaging. On a pixel-by-pixel basis, ADC maps and exponential DWI were calculated from isotropic DWI using the following formula:
SIeDWI = SIDWI(b=1000) / SIDWI(b=0) = e-ADC × b
(SIeDWI, signal intensity of exponential DWI; SIDWI(b=1000),
signal intensity of DWI with a b-value of 1000 s/mm2 ;
SIDWI(b=0), signal intensity of DWI with a b-value of 0 s/mm2).
In all patients, contrast agent (Gadovist; Bayer Schering, Berlin, Germany) was administered at the standard dose of
0.1 mmol/kg of body weight.
Of the patients, 33 underwent T2* gradient-echo (GRE) images. For the MRI examinations of 29 patients (14 glioblastomas, 15 metastases), T2* gradient-echo (GRE) images were evaluated to assess the presence of intratumoral hemorrhage. The remaining 4 patients were excluded because of severe motion artifacts.
Image Analysis
All MRIs were analyzed in consensus by a staff neuroradiologist (with 20 years of clinical experience) and a fourth-year radiology resident; the two observers were blinded to patient information including age, sex, clinical history, and histopathology.
In a first step, we evaluated the morphologic parameters of enhancing tumors. All enhancing tumors on post-contrast T1-weighted images were analyzed in accordance with the following morphologic criteria: shape (irregular / round or ovoid), margin (ill-defined / well-defined), and enhancement pattern (heterogeneous / homogeneous). Ill-defined margin was defined as having spiculated and jagged edge with sharp demarcation, or a poorly defined margin in which the tumor cannot be differentiated from the normal brain parenchyma; well-defined margin was defined as having a clearly distinguishable smooth edge. We also recorded the presence of intratumoral hemorrhage on T2* gradient echo images.
In the next step, we evaluated the peritumoral regions to differentiate glioblastomas from metastases. Prior to analysis, we defined 'peritumoral non-enhancing lesion' as a hyperintense region on T2-weighted images without enhancement on post-contrast T1-weighted images, commonly referred to as a non-enhancing abnormal area surrounding the enhancing tumor core.
We assessed the extent of peritumoral non-enhancing lesions using T2-weighted and postcontrast T1-weighted imaging. We measured the ratio between the maximum diameter of the peritumoral non-enhancing lesion on T2-weighted images and the maximum diameter of the enhancing mass on post-contrast T1-weighted images.
For visual analysis of peritumoral neoplastic cell infiltration, we assessed T2-weighted and diffusion-based images, such as DWI, ADC maps, and exponential DWI, with reference to the same section on post-contrast T1-weighted images; each image was analyzed separately. We hypothesized that peritumoral neoplastic cell infiltration would have abnormal signal intensity, as in the contrast-enhancing region. To evaluate the presence of peritumoral
neoplastic cell infiltration, we carefully selected non-enhancing peritumoral areas based on T2-weighted and post-contrast T1-weighted images. We employed the following criteria to denote 'peritumoral neoplastic cell infiltration' in each sequence: (1) the region is attached to the enhancing tumor with encompassment > 180°, to avoid contamination from the signal intensity of the normal cortex; and (2) the region exhibits the same degree of signal intensity as does the primary tumor. We visually assessed the presence or absence of peritumoral neoplastic cell infiltration.
Statistical Analysis
We did statistical analyses using the SPSS software package (ver. 20.0; SPSS, Inc., Chicago, IL, USA). To find out whether there were significant differences between glioblastoma and metastasis, we analyzed the morphologic parameters of the enhancing tumor and peritumoral regions using the chi-squared test. We also evaluated which sequence was best for depicting peritumoral neoplastic cell infiltration. Furthermore, we used receiver operating characteristic (ROC) analysis to assess the extent of the peritumoral non-enhancing lesion and to find the cutoff value with the optimum combination of sensitivity and specificity for distinguishing glioblastoma from metastasis; P < 0.05 was taken to indicate statistical significance.
RESULTS
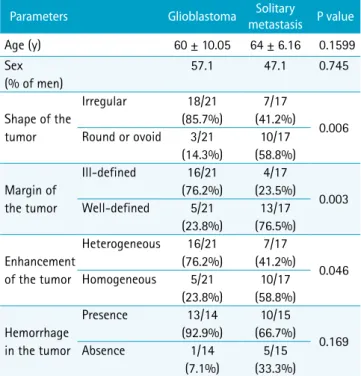
Table 1 describes the predictive values of the morphologic criteria of enhancing tumors. The shape (P = 0.006), margin (P = 0.003), and enhancement pattern (P = 0.046) of tumors significantly differentiated glioblastoma from metastasis; the largest difference between the two groups was for tumor margin. Glioblastomas were significantly associated with an irregular shape, ill-defined margins, and a heterogeneous enhancement pattern (Fig. 1a). An ovoid or round shape, well-defined margins, and homogeneous enhancement pattern were significantly related to metastases (Fig. 1b). There were no significant group differences in patient age (P = 0.160), sex (P = 0.745), or presence of hemorrhage (P = 0.169).
During assessment of the extent of peritumoral non-enhancing lesion, we observed that metastases had significantly more extensive edema than glioblastomas had (Fig. 2). According to ROC curve analysis, a cutoff value of 2.21 for the ratio of the maximum diameter of
the peritumoral non-enhancing lesion to the maximum diameter of the enhancing mass exhibited the optimum combination of sensitivity (76.2%, 95% confidence interval [CI]: 52.8, 91.8) and specificity (70.6%, 95% CI: 44.0, 89.7, P = 0.008).
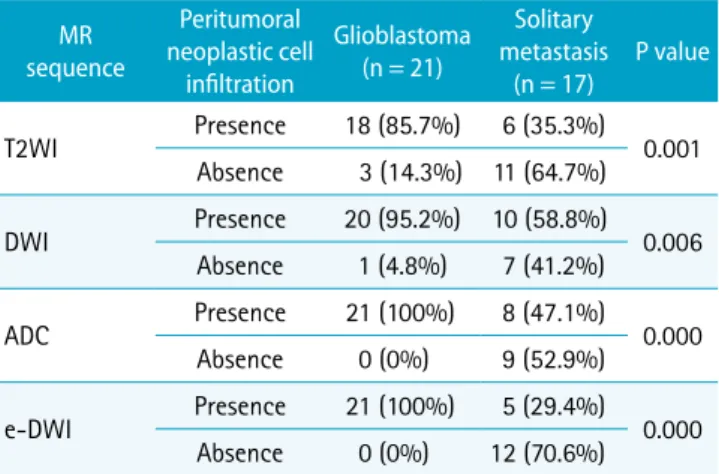
During visual assessment of peritumoral neoplastic cell infiltration using T2-weighted and diffusion-based images (Fig. 2), all sequences differed significantly between the two groups (T2-weighted imaging, P = 0.001; DWI, P = 0.006; ADC map, P = 0.000; exponential DWI, P = 0.000; Table 2). Glioblastomas exhibited significant peritumoral neoplastic cell infiltration on all sequences (Fig. 3a and Fig. 4); on the other hand, peritumoral neoplastic cell infiltration in metastases was significantly absent (Fig. 3b and Fig. 5). However, metastatic brain lesions showed many false-positive results (35% in T2WI, 59% in DWI, 47% in ADC, 29% in exponential DWI) in detecting peritumoral neoplastic cell infiltration (Fig. 6). Exponential DWI showed the highest sensitivity in both the glioblastoma (100%) and metastasis (70.6%) groups; DWI was the least-sensitive sequence. The combination of exponential DWI and ADC maps was optimum for the depiction of peritumoral neoplastic cell infiltration in glioblastomas, with a sensitivity of 100% (Table 3).
Table 1. Patient Characteristics and Morphologic Parameters of the Enhancing Tumor
Parameters Glioblastoma metastasisSolitary P value
Age (y) 60 ± 10.05 64 ± 6.16 0.1599 Sex (% of men) 57.1 47.1 0.745 Shape of the tumor Irregular 18/21 (85.7%) 7/17 (41.2%) 0.006 Round or ovoid 3/21 (14.3%) 10/17 (58.8%) Margin of the tumor Ill-defined 16/21 (76.2%) 4/17 (23.5%) 0.003 Well-defined 5/21 (23.8%) 13/17 (76.5%) Enhancement of the tumor Heterogeneous 16/21 (76.2%) 7/17 (41.2%) 0.046 Homogeneous 5/21 (23.8%) 10/17 (58.8%) Hemorrhage in the tumor Presence 13/14 (92.9%) 10/15 (66.7%) 0.169 Absence 1/14 (7.1%) 5/15 (33.3%)
DISCUSSION
Our results indicate that visual assessment of enhancing tumors and peritumoral non-enhancing lesions can help to differentiate glioblastoma from metastasis. The key to doing that lies in the peritumoral non-enhancing lesion beyond the enhancing margin of the mass. Peritumoral
Fig. 1. Different morphologic patterns in enhancing tumors of glioblastoma and metastasis. Post-contrast T1-weighted image (a) in a 61-year-old female with glioblastoma exhibits an irregular, ill-defined, heterogeneously enhancing mass in the left frontal lobe with peritumoral non-enhancing lesion, representing a typical enhancement pattern of glioblasma. Post-contrast T1-weighted image (b) in a 68-year-old male with solitary metastasis from lung cancer exhibits a round, well-defined, homogeneously enhancing mass in the right superior frontal gyrus with more extensive peritumoral non-enhancing lesion, representing typical enhancement pattern of metastasis.
a b
Fig. 2. Empiric receiver operating characteristic (ROC) curve to assess the extent of the peritumoral non-enhancing lesion, used to distinguish glioblastoma from metastasis. The area under the ROC curve was 0.706 (95% CI: 0.54, 0.84). At a cutoff ratio value of 2.21, the sensitivity (76.2%) and specificity (70.6%) combination was optimal.
Table 2. MR Sequence in Assessment of the Peritumoral Neoplastic Cell Infiltration
MR sequence Peritumoral neoplastic cell infiltration Glioblastoma (n = 21) Solitary metastasis (n = 17) P value T2WI Presence 18 (85.7%) 6 (35.3%) 0.001 Absence 3 (14.3%) 11 (64.7%) DWI Presence 20 (95.2%) 10 (58.8%) 0.006 Absence 1 (4.8%) 7 (41.2%) ADC Presence 21 (100%) 8 (47.1%) 0.000 Absence 0 (0%) 9 (52.9%) e-DWI Presence 21 (100%) 5 (29.4%) 0.000 Absence 0 (0%) 12 (70.6%)
ADC = apparent diffusion coefficient; DWI = diffusion-weighted imaging; e-DWI = exponential diffusion-weighted imaging; T2WI = T2-weighted imaging
non-enhancing lesion is generally considered vasogenic. The term 'vasogenic edema' has been used to describe regions of T2 high signal abnormality surrounding the enhancing tumor. On histopathological examination, vasogenic edema appears as a disruption of the blood-brain barrier, tumor-induced increases in interstitial water, and altered capillary permeability. In glioblastomas, which exhibit an aggressive and infiltrative pattern of growth, peritumoral areas demonstrate not only altered interstitial water, but also scattered neoplastic cell infiltration. Indeed, neoplastic cells
have been found in the non-enhancing-T2 hyperintense regions that surround glioblastoma histopathologically. Infiltrating neoplastic cells are situated behind the blood-brain barrier and typically invade along white-matter tracts (13). Therefore, a peritumoral non-enhancing lesion of glioblastoma consists of 'vasogenic' plus 'neoplastic cell infiltrative' edema. However, in metastases, peritumoral areas contain no infiltrating neoplastic cells, because of their expansile growth pattern that causes displacement of surrounding brain tissues rather than invasion; increased
Fig. 3. MRI imaging templates for peritumoral neoplastic cell infiltration. (a) Positive peritumoral neoplastic cell infiltration on all imaging sequences of T2WI, DWI, ADC map, and exponential DWI (eDWI), representing a typical pattern of glioblastoma. Peritumoral non-enhancing lesion shows heterogeneous signal intensity with a gradient of measured values on each imaging sequence. (b) Negative peritumoral neoplastic cell infiltration on all imaging sequences of T2WI, DWI, ADC, and exponential DWI (eDWI), representing typical pattern of metastasis. Peritumoral non-enhancing lesion shows nearly homogeneous signal intensity with nearly homogeneous values on each imaging sequence.
a
permeability occurs only when white-matter fibers become relatively loose around the tumor membrane (3, 6, 8, 12, 19, 20).
We believe that the different growth patterns that characterize glioblastoma and metastasis may influence tumor morphology. We found that glioblastomas exhibited an irregular shape, ill-defined margins, and heterogeneous enhancement, whereas metastases were ovoid or round, with well-defined margins and homogeneous enhancement. The intratumoral heterogeneity of glioblastomas reflects
the site of hemorrhage, presence of necrosis, and different degrees of hypercellularity. Glioblastoma typically exhibits thick, irregular, ring-like or heterogeneous enhancement with central hypo-intense necrosis (21, 22). Several pathologists have suggested that, in all infiltrative glioblastomas, there is no clear margin microscopically (23). In contrast, metastatic tumors have a macroscopically ovoid or round shape, well-defined margins, and exhibit homogeneous enhancement. Microscopically, brain metastases are also typically sharply demarcated and are
Fig. 4. Glioblastoma in an 81-year-old female. Post-contrast T1- (a) and T2-weighted images (b) show that a heterogeneously enhancing mass has an irregular margin and ill-defined border in the right temporal lobe with peritumoral non-enhancing edema. The peritumoral region exhibits different signal intensities. On T2-weighted images, ADC maps (c) and exponential DWI (d), intermediate signal intensity lesions (arrows) are thought to indicate neoplastic cell infiltrative edema. Relatively pure vasogenic edema (arrowheads) exhibits high signal intensity on T2-weighted image and ADC maps, and low signal intensity on exponential DWI. DWI shows that the differentiation of tumor infiltrative edema and pure vasogenic edema are relatively indistinct on DWI (e).
a b c
surrounded by gliotic brain parenchyma, which is a very helpful feature in the differentiation of primary diffuse gliomas. However, they may infiltrate into the surrounding tissue in the later stages. Thus, metastatic lesions are often less circumscribed with surrounding reactive gliosis and perivascular extension (24, 25).
Our results showed that ovoid homogeneous enhancing glioblastomas may mimic metastatic tumors, and ill-defined irregular heterogeneous metastatic tumors may mimic glioblastoma in tumor appearance.
We hypothesized that peritumoral neoplastic cell infiltration in glioblastoma would exhibit abnormal signal intensity, like that of the contrast-enhancing region. We visually assessed the presence or absence of peritumoral
Fig. 5. Solitary metastasis from lung cancer in a 68-year-old female. Post-contrast T1-weighted (a) and T2-weighted images (b) show that a heterogeneously enhancing mass has irregular margin and ill-defined border in the right occipital lobe with extensive peritumoral T2 high signal intensity. Peritumoral regions exhibit relatively homogeneous high signal intensity on T2-weighted image and ADC map (c), and low signal intensity on exponential DWI (d) with no significant evidence of tumor infiltrative edema. It is notable that the tumor and peritumoral lesion are poorly delineated on DWI (e).
a b c
d e
Table 3. Combination of MR Sequences for the Assessment of Peritumoral Neoplastic Cell Infiltration
Combination of MR sequences Positive peritumoral infiltration in glioblastoma Negative peritumoral infiltration in solitary metastasis e-DWI+ADC 21 (100%) 9 (52.9%) e-DWI+T2WI 18 (85.7%) 9 (52.9%) e-DWI+ADC+T2WI 18 (85.7%) 7 (41.2%) e-DWI+ADC+DWI 20 (95.2%) 5 (29.4%) e-DWI+T2WI+DWI 17 (81%) 5 (29.4%) e-DWI+ADC+T2WI+DWI 17 (81%) 3 (17.6%)
ADC = apparent diffusion coefficient; DWI = diffusion-weighted imaging; e-DWI = exponential diffusion-weighted imaging; T2WI = T2-weighted imaging
neoplastic cell infiltration on T2 weighted and diffusion-based images. There was a significant difference in all sequences between the two groups. Glioblastomas exhibited significant peritumoral neoplastic cell infiltration on all sequences, compared to metastasis. Exponential DWI exhibited the highest sensitivity, for both the presence of peritumoral neoplastic cell infiltration in glioblastomas (100%) and its absence in metastases (70.6%). DWI exhibited the least sensitivity. The signal intensity of DWI is influenced by both the intrinsic T2 properties of the tissue and water diffusibility. 'T2 shine-through effects' refer to high signal intensities on DWIs that result not from restricted diffusion, but rather from T2 hyperintensity (26). In the present study, one glioblastoma patient showed negative peritumoral neoplastic cell infiltration, and 10 metastases patients exhibited positive peritumoral neoplastic cell infiltration on DWI. We believe that the lower sensitivity of DWI, in terms of detecting peritumoral neoplastic cell infiltration, might have resulted from T2
Fig. 6. A false-positive case for peritumoral neoplastic cell infiltration in the solitary metastasis from lung cancer. Post-contrast T1-weighted image (a) shows a rim enhancing mass with extensive peritumoral non-enhancing lesion. We interpretated peritumoral non-enhancing lesion as positive peritumoral neoplastic cell infiltration on T2-weighted image (b), DWI (c) and ADC map (d). However, exponential DWI (e) was interpretated as negative peritumoral neoplastic cell infiltration.
a b c
d e
shine-through effects. The signal intensity of exponential DWI, which is generated on a workstation using simple image algebra, is derived by dividing the maximal B value DWI image by the B0 image and exhibits reverse signal intensity on ADC maps. Therefore, exponential DWI more accurately depicts diffusion effects than does DWI, with no T2 shine-through effects (26, 27). Exponential DWI allowed for increased lesion delineation during visual assessment of peritumoral neoplastic cell infiltration and could distinguish lesions better than ADC maps could, despite being merely a reverse image of these maps. The combination of exponential DWI and ADC maps was useful for depicting peritumoral neoplastic cell infiltration in glioblastomas, with a sensitivity of 100%.
Metastatic brain lesions in our study showed many false-positive results (35% in T2WI, 59% in DWI, 47% in ADC, 29% in eDWI) in detecting peritumoral neoplastic cell infiltration. We believe that the following may have affected this result: contamination of the normal cortex
when assessing peritumoral neoplastic cell infiltration in peritumoral non-enhancing lesions; lower imaging resolution by the relatively low signal-to-noise ratio of 1.5T MRI; the aforementioned T2-shine-through effect in DWI; reactive gliosis and infiltration into the surrounding tissue in the later-staged metastatic lesions.
During assessment of the extent of peritumoral non-enhancing lesion, we observed that metastases had significantly more extensive edema than glioblastomas had. Metastases are surrounded by massive amounts of edema, often extending to regions far from the site of a small metastatic focus. Pure vasogenic edema of metastases represents an underlying disturbance in vascular permeability, in which plasma proteins and other macromolecules pass freely into the perivascular space and consequently into the interstitial extracellular space. The extent of a peritumoral non-enhancing lesion is unrelated to the size of the enhancing tumor or, necessarily, to the clinical status of the patient (28). Maurer et al. (17) suggested that measuring the extent of peritumoral non-enhancing lesion has diagnostic potential for differentiating metastasis from glioblastoma.
Numerous studies that have used advanced MRI techniques, such as MRS, PWI, DTI, and ADC maps, have provided valuable information about the differentiation of glioblastoma from metastasis in peritumoral regions (3, 9-12). On MRS, an elevated choline to creatinine (Cho/ Cr) ratio is found in peritumoral regions of glioblastomas because of neoplastic cell infiltration, but there is no increase in the Cho/Cr ratio in the peritumoral regions of metastasis (3, 6, 9, 11). There is also no appreciable difference in the peritumoral N-acetylaspartate to creatine (NAA/Cr) ratios of the two groups, because of an absence of neuronal replacement or destruction (3). On PWI, several studies have revealed that the peritumoral regions of glioblastomas exhibit increased relative cerebral blood volume (rCBV), calculated in accordance with the ratio between CBV in the pathologic area and in contralateral white matter, because of neoangiogenesis and tumor infiltration (2, 3, 11, 29). Sunwoo et al. (30) showed that both intratumoral and peritumoral perfusion using arterial spin labeling (ASL) perfusion MR imaging can aid in the differentiation of glioblastoma from brain metastasis. Their study demonstrated that glioblastomas had significantly higher intratumoral and peritumoral perfusion than brain metastases had, and that peritumoral perfusion in particular provided stronger differentiation power. On DTI, several investigators have reported significantly greater
peritumoral mean diffusivity surrounding metastasis than around glioblastoma. However, no significant differences in peritumoral fractional anisotropy have been observed (11, 12). Lee et al. (2) found that the peritumoral minimum ADC value in glioblastoma was significantly lower than that of metastasis. Recently, Bauer et al. (31) have shown that a multiparametric approach with advanced MR imaging might be useful. They showed that the combination of diffusion-weighted imaging, DSC perfusion, and dynamic contrast-enhanced perfusion MR metrics in peritumoral T2 hyperintensity area can help the differentiation of glioblastoma from solitary brain metastasis with an accuracy of 98%.
Although advanced MRI methods help to distinguish glioblastoma from metastasis, we suggest the use of a more intuitive method with easily implemented MRI sequences, i.e., conventional T2-weighted and diffusion-based images such as DWI, ADC maps, and exponential DWI. However, this present study represents a simple visual morphologic assessment and does not describe a quantitative methodology.
This study had several limitations. Biopsy of peritumoral non-enhancing lesions was not done as part of the histologic examination at the time of surgery. Furthermore, we used a retrospective design and a limited number of patients; because of the small sample, factors that were less useful for differentiating glioblastoma from metastasis may not have been included, and important combinations of factors may have also been missed. Depending on the isocitrate dehydrogenase (IDH1) mutation status, 1p19q codeletion and methylation status of O-6-methylguanine-DNA methyltransferase (MGMT), glioblastoma has had different treatment successes, different patient populations, and different imaging findings in both conventional and advanced MR imaging (32-34). In our study, patients’ diagnoses with glioblastoma were based only on histological phenotypes, because they were diagnosed before WHO 2016 revision. Therefore, we failed to evaluate the different imaging findings of glioblastoma based on genetic mutations and molecular markers.
In conclusion, we found that visual assessment of tumoral and peritumoral regions, using conventional MRI and diffusion-based techniques, allows us to distinguish these two types of tumor.
Acknowledgments
We thank In Seong Kim, MR scientist of Siemens, for assistance in obtaining exponential DWI.
REFERENCES
1. Louis DN, Ohgaki H, Wiestler OD, et al. The 2007 WHO classification of tumours of the central nervous system. Acta Neuropathol 2007;114:97-109
2. Lee EJ, terBrugge K, Mikulis D, et al. Diagnostic value of peritumoral minimum apparent diffusion coefficient for differentiation of glioblastoma multiforme from solitary metastatic lesions. AJR Am J Roentgenol 2011;196:71-76 3. Law M, Cha S, Knopp EA, Johnson G, Arnett J, Litt AW.
High-grade gliomas and solitary metastases: differentiation by using perfusion and proton spectroscopic MR imaging. Radiology 2002;222:715-721
4. Furnari FB, Fenton T, Bachoo RM, et al. Malignant astrocytic glioma: genetics, biology, and paths to treatment. Genes Dev 2007;21:2683-2710
5. Cha S, Lupo JM, Chen MH, et al. Differentiation of glioblastoma multiforme and single brain metastasis by peak height and percentage of signal intensity recovery derived from dynamic susceptibility-weighted contrast-enhanced perfusion MR imaging. AJNR Am J Neuroradiol 2007;28:1078-1084
6. Chiang IC, Kuo YT, Lu CY, et al. Distinction between high-grade gliomas and solitary metastases using peritumoral 3-T magnetic resonance spectroscopy, diffusion, and perfusion imagings. Neuroradiology 2004;46:619-627 7. Opstad KS, Murphy MM, Wilkins PR, Bell BA, Griffiths JR,
Howe FA. Differentiation of metastases from high-grade gliomas using short echo time 1H spectroscopy. J Magn Reson Imaging 2004;20:187-192
8. Tang YM, Ngai S, Stuckey S. The solitary enhancing cerebral lesion: can FLAIR aid the differentiation between glioma and metastasis? AJNR Am J Neuroradiol 2006;27:609-611 9. Ishimaru H, Morikawa M, Iwanaga S, Kaminogo M, Ochi
M, Hayashi K. Differentiation between high-grade glioma and metastatic brain tumor using single-voxel proton MR spectroscopy. Eur Radiol 2001;11:1784-1791
10. Cho SK, Na DG, Ryoo JW, et al. Perfusion MR imaging: clinical utility for the differential diagnosis of various brain tumors. Korean J Radiol 2002;3:171-179
11. Lee EJ, Ahn KJ, Lee EK, Lee YS, Kim DB. Potential role of advanced MRI techniques for the peritumoural region in differentiating glioblastoma multiforme and solitary metastatic lesions. Clin Radiol 2013;68:e689-697
12. Lu S, Ahn D, Johnson G, Cha S. Peritumoral diffusion tensor imaging of high-grade gliomas and metastatic brain tumors. AJNR Am J Neuroradiol 2003;24:937-941
13. Kelly PJ, Daumas-Duport C, Kispert DB, Kall BA, Scheithauer BW, Illig JJ. Imaging-based stereotaxic serial biopsies in untreated intracranial glial neoplasms. J Neurosurg
1987;66:865-874
14. Strugar J, Rothbart D, Harrington W, Criscuolo GR. Vascular permeability factor in brain metastases: correlation with vasogenic brain edema and tumor angiogenesis. J Neurosurg 1994;81:560-566
15. Kelly PJ, Daumas-Duport C, Scheithauer BW, Kall BA, Kispert DB. Stereotactic histologic correlations of computed tomography- and magnetic resonance imaging-defined abnormalities in patients with glial neoplasms. Mayo Clin Proc 1987;62:450-459
16. Al-Okaili RN, Krejza J, Wang S, Woo JH, Melhem ER. Advanced MR imaging techniques in the diagnosis of intraaxial brain tumors in adults. Radiographics 2006;26 Suppl 1:S173-189
17. Maurer MH, Synowitz M, Badakshi H, et al. Glioblastoma multiforme versus solitary supratentorial brain metastasis: differentiation based on morphology and magnetic resonance signal characteristics. Rofo 2013;185:235-240 18. Park YW, Ahn SJ. Comparison of contrast-enhanced T2
FLAIR and 3D T1 black-blood fast spin-echo for detection of leptomeningeal metastases. Investig Magn Reson Imaging 2018;22:86-93
19. Burger PC, Vogel FS, Green SB, Strike TA. Glioblastoma multiforme and anaplastic astrocytoma. Pathologic criteria and prognostic implications. Cancer 1985;56:1106-1111 20. Oh J, Cha S, Aiken AH, et al. Quantitative apparent
diffusion coefficients and T2 relaxation times in characterizing contrast enhancing brain tumors and regions of peritumoral edema. J Magn Reson Imaging 2005;21:701-708
21. Smirniotopoulos JG, Murphy FM, Rushing EJ, Rees JH, Schroeder JW. Patterns of contrast enhancement in the brain and meninges. Radiographics 2007;27:525-551 22. Kunimatsu A, Kunimatsu N, Kamiya K, Watadani T, Mori
H, Abe O. Comparison between glioblastoma and primary central nervous system lymphoma using MR image-based texture analysis. Magn Reson Med Sci 2018;17:50-57 23. VandenBerg SR. Current diagnostic concepts of astrocytic
tumors. J Neuropathol Exp Neurol 1992;51:644-657 24. Fink KR, Fink JR. Imaging of brain metastases. Surg Neurol
Int 2013;4:S209-219
25. Takei H, Rouah E, Ishida Y. Brain metastasis: clinical characteristics, pathological findings and molecular subtyping for therapeutic implications. Brain Tumor Pathol 2016;33:1-12
26. Provenzale JM, Engelter ST, Petrella JR, Smith JS, MacFall JR. Use of MR exponential diffusion-weighted images to eradicate T2 "shine-through" effect. AJR Am J Roentgenol 1999;172:537-539
DM, MacFall JR. Use of exponential diffusion imaging to determine the age of ischemic infarcts. J Neuroimaging 2001;11:141-147
28. Penn RD. Cerebral edema and neurological function: CT, evoked responses, and clinical examination. Adv Neurol 1980;28:383-394
29. Calli C, Kitis O, Yunten N, Yurtseven T, Islekel S, Akalin T. Perfusion and diffusion MR imaging in enhancing malignant cerebral tumors. Eur J Radiol 2006;58:394-403 30. Sunwoo L, Yun TJ, You SH, et al. Differentiation of
glioblastoma from brain metastasis: qualitative and quantitative analysis using arterial spin labeling MR imaging. PLoS One 2016;11:e0166662
31. Bauer AH, Erly W, Moser FG, Maya M, Nael K. Differentiation
of solitary brain metastasis from glioblastoma multiforme: a predictive multiparametric approach using combined MR diffusion and perfusion. Neuroradiology 2015;57:697-703 32. Kwon YW, Moon WJ, Park M, et al. Dynamic susceptibility
contrast (DSC) perfusion MR in the prediction of long-term survival of glioblastomas (GBM): correlation with MGMT promoter methylation and 1p/19q deletions. Investig Magn Reson Imaging 2018;22:158-167
33. Smits M, van den Bent MJ. Imaging correlates of adult glioma genotypes. Radiology 2017;284:316-331
34. Yamashita K, Hiwatashi A, Togao O, et al. MR imaging-based analysis of glioblastoma multiforme: estimation of IDH1 mutation status. AJNR Am J Neuroradiol 2016;37:58-65