Kor J Fish Aquat Sci 47(5),495-500,2014
한수지 47(5), 495-500, 2014Original Article
495
Copyright © 2014 The Korean Society of Fisheries and Aquatic Science pISSN:0374-8111, eISSN:2287-8815
서 론
최근수산물이웰빙식품으로주목받으면서수산물에대한관 심이증가하고있으며
,
식습관의변화로단백질과지방이다량 함유된식품위주로소비구조가변화됨에따라고단백식품인 수산물의소비가점차증가할것으로예측된다(Kang and Kim,
2013).
수산물소비패턴과식문화의변화에따라가공기술개발과유통구조도변화하고있다
.
특히,
최근에는가공식품보다 는신선식품의선호도가높아지고있어,
신선식품의선도유지 와안전성확보기술개발에초점을두고있다.
굴
(Crassostrea gigas)
은지방함량은낮고,
단백질,
비타민과 아연,
철분등미네랄이풍부하여영양학적으로우수한식품이 다.
또한굴에다량함유되어있는글리코겐은체내소화흡수를 돕고,
혈액생성에관여하며,
혈액을맑게하므로어린이와노약 자들이부담없이섭취할수있다.
뿐만아니라이들성분은항 암효과등의다양한생리활성도가지고있는것으로알려져있 다(Hosoi et al., 2003; Kim et al., 1981; Sakaguchi and Murat 1989; Hur et al., 2002).
우리나라에서생산된굴은생굴
(
반각굴,
알굴)
과냉동굴,
건 조굴,
젓갈,
통조림등으로판매된다.
그러나최근내수유통물굴(Crassostrea gigas)의 선도에 따른 pH, 글리코겐, 가용성단백질, 탁도와의 상관관계
손광태·심길보*·임치원·윤나영·서정화
1·정삼근
1·정우영
2·조영제
2국립수산과학원 식품안전과, 굴수하식수산업협동조합, 부경대학교 식품공학과
Relationship of pH, Glycogen, Soluble Protein, and Turbidity between Freshness of Raw Oyster Crassostrea gigas
Kwang Tae Son, Kil Bo Shim*, Chi Won Lim, Na Young Yoon, Jeong Hwa Seo
1
, Sam Geun Jeong1
, Woo Young Jeong2
and Young Je Cho2
Food and Safety Research Division, National Fisheries Research and Development Institute, Busan 619-705, Korea
1
Oyster Hanging Culture Fisheries Cooperation, Tongyeong 650-070, Korea
2
Department of Food Science & Technology, Pukyong National University, Busan 608-737, Korea
We examined chemical changes in oysters Crassostrea gigas and packing water that were sold after storage at 5, 10, and 20°C. The pH of oysters stored at 5°C dropped to 5.81 after 10 days of storage, while that of oysters at 10°C and 20°C dropped to 5.37 after 8 days and to 5.04 after 4 days, respectively. The glycogen content of oysters stored at 5°C decreased from 718.89 to 421.85 mg/100g during storage, while that of oysters at 10°C decreased to 351.49 mg/100 g after 4 days. The turbidity and soluble protein in packing water increased slightly. The viable cell count of oysters did not exceed 6 log CFU/g after 10 days of storage at 5°C, but that of oysters at 10°C did so after 8 days. Additionally, the viable cell count of packing water was lower than that of oysters. We performed a principal component analysis, where the first principal component (55.03%-57.24%) and second principal component (42.76%-44.97%) described most variation. The first principal component included the pH of oysters and packing water, and the glycogen content of oysters. A Pearson correlation between the first two principal components had a higher R value than that between other components. Freshness was evaluated using the pH of oysters and packing water, and glycogen. We found that soluble protein content was significantly associated with a lower pH and glycogen content.
Key words: Oyster, Freshness, pH, Glycogen, Soluble protein
This is an Open Access article distributed under the terms of the Creative Commons Attribution Non-Commercial Licens (http://creativecommons.org/licenses/by-nc/3.0/)which permits unrestricted non-commercial use, distribution, and reproduction in any medium, provided the original work is properly cited.
http://dx.doi.org/10.5657/KFAS.2014.0495 Kor J Fish Aquat Sci 47(5) 495-500, October 2014
Received 18 August 2014; Revised 23 October 2014; Accepted 24 October 2014
*Corresponding author: Tel: +82. 51. 720. 2671 Fax: +82. 51. 720. 2669
E-mail address: [email protected]
손광태
ㆍ
심길보ㆍ
임치원ㆍ
윤나영ㆍ
서정화ㆍ
정삼근ㆍ
정우영ㆍ
조영제496
량이증가되면서내수를목적으로한생굴비중이점차증가하 고있다
.
굴은생산자가껍질을제거한후에산지위판장에서경 매를거친후생굴상태로시장이나대형소매점으로유통되거 나봉지굴형태로유통된다(Park et al., 2006).
굴은식물플랑 크톤등먹이생물뿐만아니라인체에유해한세균이나바이러 스등도쉽게축적할수있다(Potasman et al., 2002; Feldhusen, 2000; Cliver, 1997; Grimes, 1991).
그리고다른패류보다도조 직이연하여소화·
분해되기쉽고가공,
유통중온도변화로품 질저하가빨리일어난다(Park et al., 2006).
따라서굴의위생학 적안전성을확보하기위하여정부에서는생산해역에대한위 생관리를하고있으며,
생산자단체인수협은경매단계에서pH
와관능평가등의방법을이용하여선도를측정하여신선하고 안전한생굴이국내에유통되도록하고있다.
생굴의선도에대한선행연구로는온도에따른참굴의미생 물
, pH,
휘발성염기질소함량변화,
관능평가(Cao et al., 2009)
와오존,
키토산,
초고압,
박테리오신이코팅된항균성플라스 틱필름의처리로생굴의유통기한 연장에관한연구가있다(Chen et al., 2014; Cao et al., 2009, Park et al., 2006; Kim et al., 2002, He et al, 2002).
따라서본연구에서는현장에서신속
,
정확하게생굴의선도 를측정할수있는기술을개발하기위하여소포장생굴의저장 온도에따른이화학적성분변화를측정하고,
이들성분간의상 관관계를분석하여생굴의선도측정을위한기초자료로활용 하고자하였다.
재료 및 방법
재료
실험재료로사용한굴은
2014
년4
월에경상남도통영시해 역에서 채취된 것이며,
채취된 굴은 껍질을 제거하여 경매 후 인근 가공공장에서 포장하였다.
이때,
포장된 총 용량은362.26±8.38 g,
굴은136.63±8.92 g
과충진수(
해수와담수 를일정비율혼합물) 225.63±11.87 mL
이었다.
충진수의염 분농도는14.8 psu
이었다.
포장된굴은항온기(PFC-PO-150, TAESHIN bio science, Korea)
에서각각5, 10, 20°C
의일정한 온도에저장하면서1
일간격으로실험을진행하였다. 실험방법
pH
pH
분석시료는굴과증류수를1:9
비율로혼합하여제조하였 다.
분석시료와충진수의pH
는pH meter (Orion 3 star, Ther- mo Scientific Inc., Fort Collins, USA)
로측정하였다.
글리코겐 함량
글리코겐함량은시료
0.5 g
에30% KOH 5 mL
를첨가하여95℃
에서20
분간중탕하고포화Na
2SO
4용액0.5 mL
와etha-
nol 5 mL
를첨가하여95℃
에서다시15
분간중탕한후원심 분리(1,259 g, 10 min)
하였다.
침전물에2 mL
탈이온수와2.5 mL ethanol
을첨가하고원심분리(1,259 g, 10 min)
후, 5 M HCl 2 mL
넣고완전히녹인다음0.5 M NaOH
로 중화하여50 mL
로정용하여시료액으로사용하였다.
시료용액5 mL
에0.2% anthron-sulfate solution
을10 mL
를가하고95℃
에서10
분간중탕후냉각하여분광광도계(UV mini-1240, Shimadzu, Tokyo, Japan)
를이용하여620 nm
에서흡광도를측정하였다(Click and Engin, 2005).
글리코겐함량은glucose
를표준물질 로작성한정량곡선에따라측정하였으며,
글리코겐전환계수0.9
를곱하여계산하였다.
탁도
충진수의 탁도는휴대용탁도계
(2100P, HACH, Loveland, USA)
를사용하여측정하였으며, 0-1,000 NTU (Nepheomet- ric Turbidity Unit)
로나타내었다.
가용성단백질
충진수의가용성단백질함량은
Biuret assay
를이용하여측 정하였다.
충진수1 mL
에Biuret
시약4 mL
를넣고혼합하여,
실온에서30
분간방치한후분광광도계(UV mini-1240, Shi- madzu, Japan)
를이용하여540 nm
에서흡광도를측정하였다(Robinson and Hodgen, 1940).
가용성단백질함량은bovin
serum albumin
를표준단백질로작성한정량곡선에따라측정하였다
. 일반세균수
굴과충진수의일반세균수는
Standard Methods for the Ex- amination of Water and Wastewater (APHA, 1970)
의방법에 따라Standard plate count agar (Difco)
를사용하여35 ± 0.5°C
에서24-48
시간배양한후, Colony Forming Unit (CFU)
로나 타내었다.
통계처리
굴과충진수의이화학적성분변화결과에대한통계처리는
SAS
프로그램을이용하여단순상관계수(Pearson’s correlation coefficient, r)
및주성분분석을실시하였다(Steel and Torrie, 1960).
결과 및 고찰
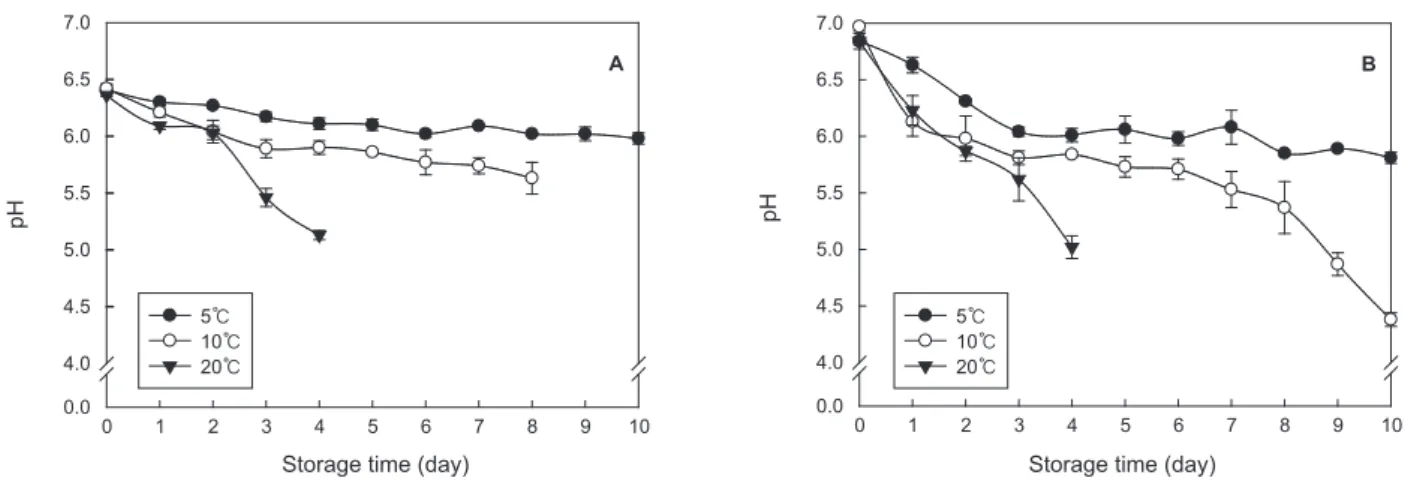
굴과 충진수의 pH변화
5°C
에서저장한굴의초기pH
는6.41
이었으나10
일경과후5.98
로저하되었으며, 10°C
에서굴의초기pH
는6.42
이었으 나3
일경과후5.89
이었다가8
일경과후5.63
까지저하되었다.
20°C
에서는저장초기에pH 6.36
이었으며, 4
일경과후5.13
까 지저하되었다(Fig. 1A).
충진수의초기pH
는6.84-6.97
로굴의pH
에비해다소높게나타났다. 5°C
에서는10
일경과후5.81
까굴의 선도에 따른 이화학적 성분변화
497
지감소하였고
, 10°C
에서는8
일경과후5.37, 20°C
에서는4
일 경과후5.02
까지감소하였다(Fig. 1B).
굴저장시
pH
변화는품질변화를알려주는중요한지표이 다.
굴에다량함유하고있는glycogen
은해당과정(glycolysis)
을거치면서lactate
을생성하고,
생성된lactate
에의해pH
가 저하된다(Cao et al., 2009; Park et al., 2006).
일부연구에서 는굴의선도판정지표로pH
를이용하는데,
굴의pH
가6.3
이 상이면“Very good”, 6.2-5.9
는“good”, 5.8
은“off”, 5,7-5.5
는“musty”, 5.2
이하는“sour”
또는“putrid”
로판정한다(Pottinger, 1948; Hunter and Linden, 1923).
굴과충진수의pH
는저장온 도가높아질수록빠르게저하되며,
굴보다는충진수의pH
가변 화폭이큰것으로나타났다. He et al. (2002)
은생굴을2~4°C
에 서16
일저장후pH
가5.1
까지저하되는것으로보고하였으며,
저장온도에의한굴의단백질변성은pH
변화에직접적인영향 을주는것으로확인되었다.
굴의 글리코겐 함량 변화
굴의글리코겐함량은초기에는
702.51-718.87 mg/100 g
이 었으며, pH
변화와같이저장기간동안지속적으로감소하였다.
저장초기에5°C
에서는718.87 mg/100 g
이었으나저장7
일경 과후545.22 mg/100 g
으로감소하였다가저장10
일후421.85 mg/100 g
까지감소하였다. 10°C
에서는5°C
보다빠르게감소 하여저장4
일후351.49 mg/100 g
으로감소하였으며,
그이 후에는서서히감소하여저장8
일에는347.36 mg/100 g
이었 다. 20°C
에서는초기702.51 mg/100 g
이었으며, 10°C
와유사 한경향으로저장4
일까지감소하였다(Fig. 2).
굴의종류에따 라글리코겐함량은차이가있으며,
채취시기에따라서도차이 가있다(Dridi et al., 2007; Krishnamoorthy et al., 1979; Willis et al., 1976).
따라서초기글리코겐함량은다소차이가있지만 저장중글리코겐감소는pH
변화등에영향을주는것으로사 료된다.
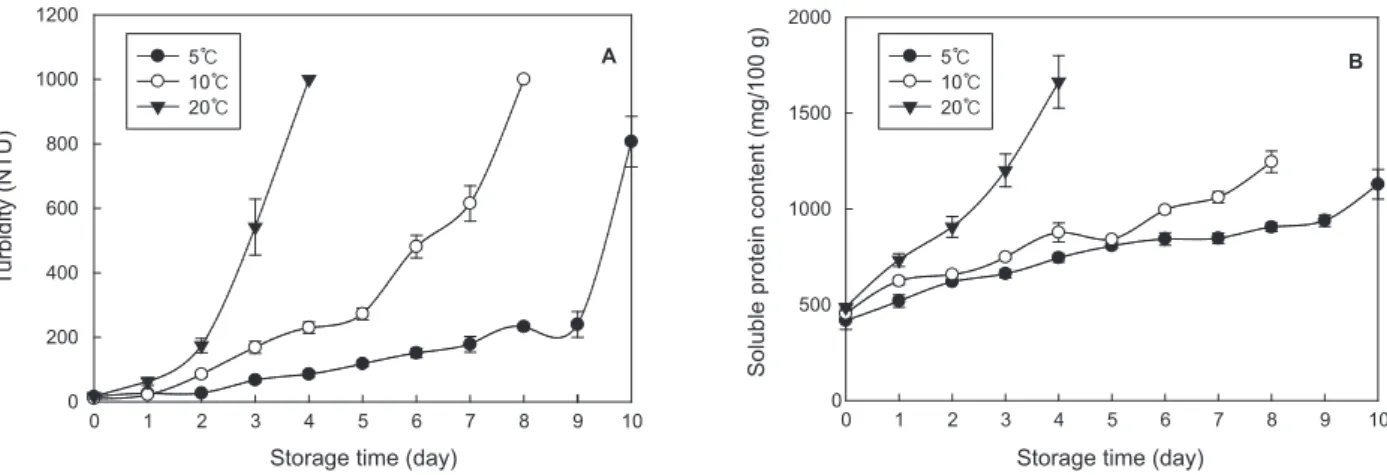
충진수의 탁도 및 가용성단백질 함량 변화
충진수의탁도변화는저장온도에따라큰차이가있었다
.
초 기탁도는12.46-17.45 NTU
의범위이었다. 5°C
에저장시탁도 는9
일까지239.5 NTU
이었으며,
이후급격하게증가하였다. 10°C
에저장시탁도는5
일경과후272.58 NTU
이었다가이 후급격히증가하여8
일이후에는검출최대한계인1,000 NTU
를초과하였다.
그리고20°C
저장시탁도는2
일경과후174.33 NTU
이었으며,
이후에급격하게증가하여4
일에검출최대한 계를초과하였다(Fig. 3A).
굴의가용성단백질함량은
5°C
에서1
일째는417.93 mg/100 g
이었으나저장기간동안지속적으로증가하여10
일후1128.67 mg/100 g
이었다(Fig. 3B). 10°C
에서는가용성단백질함량이453.82 mg/100 g
이었으나8
일후1,245.76 mg/100 g
로증가하 였다. 20°C
에서는초기값이486.04 mg/100 g
이었으나5
일후 에1,663.38 mg/100 g
까지증가하였다.
굴의선도가저하될수 록굴조직의파편과글리코겐및가용성단백질의용출로충진 수의탁도는높아진다.
따라서가용성단백질함량의증가와글 Fig. 1. Changes in pH values of oyster Crassostrea gigas (A) and packing water (B) during storage at 5, 10, and 20°C, respectively.Storage time (day)
0 1 2 3 4 5 6 7 8 9 10
pH
0.0 4.0 4.5 5.0 5.5 6.0 6.5 7.0
A
Storage time (day)
0 1 2 3 4 5 6 7 8 9 10
pH
0.0 4.0 4.5 5.0 5.5 6.0 6.5 7.0
B
Storage time (day)
0 1 2 3 4 5 6 7 8 9 10
Glycogen content (mg/100 g)
0 200 400 600 800
Storage time (day)
0 1 2 3 4 5 6 7 8 9 10
Turbidity (NTU)
0 200 400 600 800 1000 1200
A
Storage time (day)
0 1 2 3 4 5 6 7 8 9 10
Soluble protein content (mg/100 g)
0 500 1000 1500 2000
B
Storage time (day)
0 1 2 3 4 5 6 7 8 9 10
Viable cell count (Log CFU/g)
0 1 2 3 4 5 6 7 8
A
Storage time (day)
0 1 2 3 4 5 6 7 8 9 10
Viable cell count (Log CFU/mL)
0 1 2 3 4 5 6 7 8
5℃
10℃20℃
B 5℃
10℃20℃
5℃10℃
20℃
5℃
10℃20℃
5℃
10℃
20℃
5℃
10℃
20℃
5℃10℃
20℃
Factor 1 (57.24%)
A
Factor 2 (42.76%)
-1.0 -0.8 -0.6 -0.4 -0.2 0.0 0.2 0.4 0.6 0.8 1.0 -1.0-0.8-0.6-0.4-0.20.00.20.40.60.81.0 Viable cell count
(packing water)
(packing water)pH Viable cell count
(oyster)
(oyster)pH Glycogen Turbidity
Soluble protein
Factor 1 (55.03%)
B
Factor 2 (44.97%)
-1.0 -0.8 -0.6 -0.4 -0.2 0.0 0.2 0.4 0.6 0.8 1.0 -1.0-0.8-0.6-0.4-0.20.00.20.40.60.81.0 Viable cell count
(packing water)
(packing water)pH Viable cell count
(oyster)
(oyster)pH Glycogen Turbidity
Soluble protein
Fig. 2. Changes in glycogen content of oyster Crassostrea gigas and packing water during storage at 5, 10, and 20°C, respectively.
Storage time (day)
0 1 2 3 4 5 6 7 8 9 10
pH
0.0 4.0 4.5 5.0 5.5 6.0 6.5 7.0
A
Storage time (day)
0 1 2 3 4 5 6 7 8 9 10
pH
0.0 4.0 4.5 5.0 5.5 6.0 6.5 7.0
B
Storage time (day)
0 1 2 3 4 5 6 7 8 9 10
Glycogen content (mg/100 g)
0 200 400 600 800
Storage time (day)
0 1 2 3 4 5 6 7 8 9 10
Turbidity (NTU)
0 200 400 600 800 1000 1200
A
Storage time (day)
0 1 2 3 4 5 6 7 8 9 10
Soluble protein content (mg/100 g)
0 500 1000 1500 2000
B
Storage time (day)
0 1 2 3 4 5 6 7 8 9 10
Viable cell count (Log CFU/g)
0 1 2 3 4 5 6 7 8
A
Storage time (day)
0 1 2 3 4 5 6 7 8 9 10
Viable cell count (Log CFU/mL)
0 1 2 3 4 5 6 7 8
5℃10℃ 20℃
B 5℃10℃
20℃
5℃
10℃
20℃
5℃10℃
20℃
5℃
10℃20℃
5℃ 10℃20℃
5℃ 10℃ 20℃
Factor 1 (57.24%)
A
Factor 2 (42.76%)
-1.0 -0.8 -0.6 -0.4 -0.2 0.0 0.2 0.4 0.6 0.8 1.0 -1.0-0.8-0.6-0.4-0.20.00.20.40.60.81.0 Viable cell count
(packing water)
(packing water)pH Viable cell count
(oyster)
(oyster)pH Glycogen Turbidity
Soluble protein
Factor 1 (55.03%)
B
Factor 2 (44.97%)
-1.0 -0.8 -0.6 -0.4 -0.2 0.0 0.2 0.4 0.6 0.8 1.0 -1.0-0.8-0.6-0.4-0.20.00.20.40.60.81.0 Viable cell count
(packing water)
(packing water)pH Viable cell count
(oyster)
(oyster)pH Glycogen Turbidity
Soluble protein
손광태
ㆍ
심길보ㆍ
임치원ㆍ
윤나영ㆍ
서정화ㆍ
정삼근ㆍ
정우영ㆍ
조영제498
리코겐함량의감소는충진수의탁도에영향을주는것으로사 료된다
.
이러한충진수의탁도증가는저장2~3
일이후부터나 타나기때문에유통시관능적기호도저하에따른소비자구매 감소에도영향을미칠것으로판단된다.
일반 세균수 변화
굴의초기세균수는
2.36-2.68 log CFU/g
이었으며, 5°C
에서8
일간저장한굴의세균수는4.0-4.34 log CFU/g
로증가하였다. 10°C
에서4
일이후에는3.70-3.79 log CFU/g
이었으며, 20°C
에 서2
일간저장후에는3.45 log CFU/g
로증가하였다. 10°C
와20°C
에저장한굴의생균수는각각8
일과4
일경과후에6.25
와5.94 log CFU/g
까지상승하였다.
반면에충진수의세균수 변화는초기에는1.13-2.19 log CFU/mL
이었으며, 5°C
저장10
일까지지속적으로증가하여4.26 log CFU/mL
이었으며,
동시 기굴의세균수4.52 log CFU/g
과유사하였다. 10℃
에서저장 된굴의충진수는저장8
일에는5.65 log CFU/mL
로증가하였 으며, 20℃
에서는저장1
일경과후에급격히증가하여저장4
일에는
5.94 log CFU/mL
까지증가하였다.
Park et al. (2006)
은초고압처리한굴의저장중미생물수의 변화에서는무처리하여10℃
저장중세균수가저장기간동안 지속적으로증가한다고보고하였다.
그리고동온도에서저장8
일에8 log CFU/g
까지증가하였다고보고하였으나,
본연구에 서는6 log CFU/g
까지증가하여다소차이가있었다.
이화학 성분간의 상관관계
선도에따른
pH,
글리코겐,
탁도,
가용성단백질,
일반세균수 에대한상관관계를살펴본결과,
저장기간에따라선도가저하되면굴과충진수의
pH,
글리코겐함량은지속적으로감소하며
,
탁도와가용성단백질함량,
일반세균수는증가하게된다(Table 1).
특히충진수pH
는5°C
에서저장한굴pH
와글리코겐 함량변화에서상관계수는r=0.92, r=0.83
이었으며,
가용성단 백질함량과는r=-0.82
로높은상관성을나타내었다.
반면10°C
저장굴의pH
와글리코겐함량변화와는각각r=0.92, r=0.51
이 었으며,
가용성단백질함량과는r=-0.74
으로높은상관성을나 Fig. 3. Changes in turbidity (A) and soluble protein content (B) of packing water during storage at 5, 10, and 20°C, respectively.Storage time (day)
0 1 2 3 4 5 6 7 8 9 10
pH
0.0 4.0 4.5 5.0 5.5 6.0 6.5 7.0
A
Storage time (day)
0 1 2 3 4 5 6 7 8 9 10
pH
0.0 4.0 4.5 5.0 5.5 6.0 6.5 7.0
B
Storage time (day)
0 1 2 3 4 5 6 7 8 9 10
Glycogen content (mg/100 g)
0 200 400 600 800
Storage time (day)
0 1 2 3 4 5 6 7 8 9 10
Turbidity (NTU)
0 200 400 600 800 1000 1200
A
Storage time (day)
0 1 2 3 4 5 6 7 8 9 10
Soluble protein content (mg/100 g)
0 500 1000 1500 2000
B
Storage time (day)
0 1 2 3 4 5 6 7 8 9 10
Viable cell count (Log CFU/g)
0 1 2 3 4 5 6 7 8
A
Storage time (day)
0 1 2 3 4 5 6 7 8 9 10
Viable cell count (Log CFU/mL)
0 1 2 3 4 5 6 7 8
5℃
10℃20℃
B 5℃
10℃20℃
5℃10℃
20℃
5℃
10℃20℃
5℃
10℃
20℃
5℃
10℃
20℃
5℃10℃
20℃
Factor 1 (57.24%)
A
Factor 2 (42.76%)
-1.0 -0.8 -0.6 -0.4 -0.2 0.0 0.2 0.4 0.6 0.8 1.0 -1.0-0.8-0.6-0.4-0.20.00.20.40.60.81.0 Viable cell count
(packing water)
(packing water)pH Viable cell count
(oyster)
(oyster)pH Glycogen Turbidity
Soluble protein
Factor 1 (55.03%)
B
Factor 2 (44.97%)
-1.0 -0.8 -0.6 -0.4 -0.2 0.0 0.2 0.4 0.6 0.8 1.0 -1.0-0.8-0.6-0.4-0.20.00.20.40.60.81.0 Viable cell count
(packing water)
(packing water)pH Viable cell count
(oyster)
(oyster)pH Glycogen Turbidity
Soluble protein
Fig. 4. Changes of viable cell counts of oyster Crassostrea gigas (A) and packing water (B) during storage at 5, 10, and 20°C, respectively.
Storage time (day)
0 1 2 3 4 5 6 7 8 9 10
pH
0.0 4.0 4.5 5.0 5.5 6.0 6.5 7.0
A
Storage time (day)
0 1 2 3 4 5 6 7 8 9 10
pH
0.0 4.0 4.5 5.0 5.5 6.0 6.5 7.0
B
Storage time (day)
0 1 2 3 4 5 6 7 8 9 10
Glycogen content (mg/100 g)
0 200 400 600 800
Storage time (day)
0 1 2 3 4 5 6 7 8 9 10
Turbidity (NTU)
0 200 400 600 800 1000 1200
A
Storage time (day)
0 1 2 3 4 5 6 7 8 9 10
Soluble protein content (mg/100 g)
0 500 1000 1500 2000
B
Storage time (day)
0 1 2 3 4 5 6 7 8 9 10
Viable cell count (Log CFU/g)
0 1 2 3 4 5 6 7 8
A
Storage time (day)
0 1 2 3 4 5 6 7 8 9 10
Viable cell count (Log CFU/mL)
0 1 2 3 4 5 6 7 8
5℃
10℃20℃
B 5℃
10℃20℃
5℃10℃
20℃
5℃
10℃20℃
5℃
10℃
20℃
5℃
10℃
20℃
5℃10℃
20℃
Factor 1 (57.24%)
A
Factor 2 (42.76%)
-1.0 -0.8 -0.6 -0.4 -0.2 0.0 0.2 0.4 0.6 0.8 1.0 -1.0-0.8-0.6-0.4-0.20.00.20.40.60.81.0 Viable cell count
(packing water)
(packing water)pH Viable cell count
(oyster)
(oyster)pH Glycogen Turbidity
Soluble protein
Factor 1 (55.03%)
B
Factor 2 (44.97%)
-1.0 -0.8 -0.6 -0.4 -0.2 0.0 0.2 0.4 0.6 0.8 1.0 -1.0-0.8-0.6-0.4-0.20.00.20.40.60.81.0 Viable cell count
(packing water)
(packing water)pH Viable cell count
(oyster)
(oyster)pH Glycogen Turbidity
Soluble protein
굴의 선도에 따른 이화학적 성분변화
499
타내었다
(Table 1).
그리고탁도는글리코겐함량과가용성단백 질함량과상관성이높았으며(r=-0.48~-0.73, r=0.71~0.83),
일반세균수와도상관성이높았다(r=0.71~0.86).
따라서굴의 선도변화에관여하는인자중pH,
글리코겐,
가용성단백질함 량은선도변화와가장밀접한관련이있었다.
특히주성분분석 결과, 5°C
에서생굴의선도에따른제1
주성분인충진수의pH
와굴의pH
및글리코겐함량이57.24%
설명이가능하며,
제2
주성분인기타성분이42.76%
설명가능하였다. 10°C
에서도 유사하여제1
주성분이55.03%,
제2
주성분이44.97%
설명가 능하였다(Fig. 5).
따라서굴의선도는충진수와굴의pH,
글리코겐함량변화로판정할수있으며
,
특히가용성단백질함량은 이들성분과가장밀접한관계를가지는것으로확인되었다.
따 라서pH,
글리코겐,
가용성단백질함량변화는굴의선도측정 기술개발을위한품질지표로서의활용이가능할것이다.
사 사
본연구는국립수산과학원
(RP-2014-FS-025)
의지원에의해 수행되었으며,
이에감사드립니다.
Table 1. Correlation coefficients (r) for physicochemical of oyster Crassostrea gigas and packing water (Packing water)pH pH
(Oyster) Glycogen Soluble
protein Turbidity Viable cell count
(Oyster) Viable cell count (Packing water)
(Packing water)pH - 0.921
(0.92)2 0.83
(0.51) -0.82
(-0.74) -0.56
(-0.62) -0.51
(-0.30) -0.47
(-0.38)
(Oyster)pH 0.83
(0.54) -0.85
(-0.91) -0.61
(-0.81) -0.55
(-0.44) -0.54
(-0.53)
Glycogen -0.81
(-0.51) -0.73
(-0.48) -0.65
(-0.34) -0.63
(-0.41)
Soluble protein 0.71
(0.83) 0.54
(0.49) 0.53
(0.58)
Turbidity 0.71
(0.80) 0.75
(0.86) Viable cell count
(Oyster) 0.98
(0.87)
1Significant at P<0.05. The results of relationship analysis about chemical components in samples during storage at 5°C.
2The results of relationship analysis about chemical components in samples during storage at 10°C.
Fig. 5. PCA plot in chemical components of oyster Crassostrea gigas and pacing water during storage at 5, and 10℃.
Storage time (day)
0 1 2 3 4 5 6 7 8 9 10
pH
0.0 4.0 4.5 5.0 5.5 6.0 6.5 7.0
A
Storage time (day)
0 1 2 3 4 5 6 7 8 9 10
pH
0.0 4.0 4.5 5.0 5.5 6.0 6.5 7.0
B
Storage time (day)
0 1 2 3 4 5 6 7 8 9 10
Glycogen content (mg/100 g)
0 200 400 600 800
Storage time (day)
0 1 2 3 4 5 6 7 8 9 10
Turbidity (NTU)
0 200 400 600 800 1000 1200
A
Storage time (day)
0 1 2 3 4 5 6 7 8 9 10
Soluble protein content (mg/100 g)
0 500 1000 1500 2000
B
Storage time (day)
0 1 2 3 4 5 6 7 8 9 10
Viable cell count (Log CFU/g)
0 1 2 3 4 5 6 7 8
A
Storage time (day)
0 1 2 3 4 5 6 7 8 9 10
Viable cell count (Log CFU/mL)
0 1 2 3 4 5 6 7 8
5℃10℃
20℃
B 5℃10℃
20℃
5℃
10℃20℃
5℃
10℃
20℃
5℃10℃
20℃
5℃10℃
20℃
5℃
10℃20℃
Factor 1 (57.24%)
A
Factor 2 (42.76%)
-1.0 -0.8 -0.6 -0.4 -0.2 0.0 0.2 0.4 0.6 0.8 1.0 -1.0-0.8-0.6-0.4-0.20.00.20.40.60.81.0 Viable cell count
(packing water)
(packing water)pH Viable cell count
(oyster)
(oyster)pH Glycogen Turbidity
Soluble protein
Factor 1 (55.03%)
B
Factor 2 (44.97%)
-1.0 -0.8 -0.6 -0.4 -0.2 0.0 0.2 0.4 0.6 0.8 1.0 -1.0-0.8-0.6-0.4-0.20.00.20.40.60.81.0 Viable cell count
(packing water)
(packing water)pH Viable cell count
(oyster)
(oyster)pH Glycogen Turbidity
Soluble protein
손광태
ㆍ
심길보ㆍ
임치원ㆍ
윤나영ㆍ
서정화ㆍ
정삼근ㆍ
정우영ㆍ
조영제500
References
APHA. 1970. Recommended procedures for the examination of seawater and shellfish, 4th ed., American Public Health As- sociation, Washington, D.C., U.S.A., 1-47.
Cao R, Xue CH, Liu Q and Xue Y. 2009. Microbiological, chem- ical, and sensory assessment of Pacific oysters (Crassostrea
gigas) stored at different temperatures. Czech J Food Sci 27,
102–108.Chen H, Wang M, Chen S, Chen T and Huang N. 2014. Ef- fects of ozonated water treatment on the microbial popula- tion, quality, and shelf life of shucked oysters (Crassostrea
plicatula). J Aquatic food product technology 23, 175-185.
http://dx.doi.org/10.1080/10498850.2012.707761.
Cicik B and Engin K. 2005. The Effects of Cadmium on Levels of Glucose in Serum and glycogen Reserves in the Liver and Muscle Tissues of Cyprinus carpio. Turk J Vet Anim Sci 29, 113-117.
Cliver DO. 1997. Virus transmission via foods. Food Technol 51, 71-78.
Dridi S. Romdhne MS and Elcafsi M. 2007. Seasonal variation in weight and biochemical composition of the Pacific oys- ter, Crassostrea gigas in relation to the gametogenic cycle and environmental conditions of the Bizert lagoon, Tunisia.
Aquaculture 263, 238-248. http://dx.doi.org/10.1016/j.aqua- culture.2006.10.028.
Feldhusen F. 2000. The role of seafood in bacterial foodborne disease. Microbes Infect 2, 1651-1660.
Grimes DJ. 1991. Ecology of estuarine bacteria capable of caus- ing human disease: A review. Estuaries 14, 345-360.
He H, Adams RM, Farkas DF and Morrissey MT. 2002. Use of high-pressure processing for oyster shucking and shelf-life extension. J Food Sci 67, 640-645.
Hosoi M, Kubota S, Toyohara M, Toyohara H and Hayashi I.
2003. Effect of salinity change on free amino acid content in Pacific oyster. Fish Sci 69, 395-400.
Hunter AC and Linden BA. 1923. An investigation of oyster spoilage. Am Food J 18, 538-540.
Hur SH, Lee HJ and Hong JH. 2002. Characterization of materi- als for report processing in oyster porridge. J Korean Food Sci Soc Nutr 31, 770-774.
Kang JH and Kim TY. 2013. A study on current fisheries distri- bution laws and their improvement measures. Korea Mari- time Institute (KMI), Seoul, Korea, 64-68.
Kim JS, Yeum JH and Nam JN. 1981. Decomposition of glyco- gen and protein in picked oyster during fermentation with salt. J Korean Fish Soc 14, 66-71.
Kim YM, P HD and Lee DS. 2002. Shelf-life characteristics of fresh oysters and ground beef as affected by bacteriocin- coated plastic packaging film. J Sci Food Agr 82, 998–1002.
Krishnamoorthy RV, Lakshmi GJ, Biesiot P and Venkataramiah A. 1979. Variations in glycogen, total fat, and caloric ener-
gies of the American oyster Crassostrea virginica (Gmelin) from natural reefs in the Mississippi Sound. Proc Indian Acad Sci 88, 397-409.
Park WJ, Jwa MK, Hyun SH, Lim SB and Song DJ. 2006. Mi- crobial and quality changes during storage of raw oyster treated with high hydrostatic pressure. J Korean Soc Food Sci Nutr 35, 1449-1455.
Potasman I, Paz A and Odeh M. 2002 infectious outbreaks as- sociated with bivalve shellfish consumption: A worldwide perspective. Clin Infect Dis 35, 921-928.
Pottinger SR. 1948. Some data on pH and the freshness of shucked eastern oysters Comm. Fish Rev 10, 1-3.
Robinson HW and Hodgen CG. 1940. The Biuret reaction in the determination of serum protein. I. A study of the condi- tion necessary for the production of the stablele color which bears a quantitative relationship to the protein concentration.
J Biol Chem 135,707–725.
Sakaguchi M and Murat M. 1989. Seasonal variations of free amino acid on oyster whole body and adductor muscle. Nip- pon suisan Gakkaishi 55, 2037-2041.
Steel RGD and Torrie JH. 1980. Principle and procedure of statistics; a biometrical approach (2nd ed.). MacGraw-Hill Book Company, New York, U.S.A.
Willis SA, Havens WK and Ingle RM. 1976. Quality improve- ment of oysters, Crassostrea virginica (Gmelin), using arti- ficial food. Fl Mar Res Publ 20, 1-16.