뉴럴네트워크를 이용하여 EEG Data의 기저질환 유무 분류
윤희진
장안대학교 IT학부 인터넷정보통신과
Classification of the presence or absence of underlying disease in EEG Data using neural network
Hee-Jin Yoon
Professor, IT Collage, Jnagan University
요 약 2020년 1월, COVID19는 온 지구를 팬데믹에 빠트렸다. 이로 인해 경제적으로 큰 손실을 가져왔으며, 사회적으 로 혼란을 일으키고 있다. 이러한 코로나19는 심장병, 고혈압, 당뇨, 뇌졸중, 우울증, 암 등과 같은 기저질환자들에게 감염률이 월등히 높다. 또한, 기저질환자가 기저질환이 없는 사람들보다 치명률이 훨씬 높다고 연구되었다. 본 연구에서 는 뇌파데이터를 이용하여 기저질환의 유·무를 분류하였다. 기저질환자 유·무에 대한 분류를 위해 사용된 데이터는 데이 터사이언스랩에서 제공하는 뇌파데이터로 33개의 특징과 69개의 샘플로 이루어졌다. 데이터의 전처리는 Z-score를 사용하였다. 분류는 뉴럴네트워크 인 NEWFM와 ZNN엔진을 사용하였다. 실험 결과 기저질환자의 유·무에 대한 분류결 과 NEWFM은 77.94%, ZNN은 76.47%의 실험 결과를 얻었다. 이 연구를 통해 뇌파데이터를 측정하고 기저질환의 유 무를 분류하고 높은 감염률을 보이는 기저질환자들이 COVID19로부터 예방 할 수 있으리라 기대한다. 이를 기반으로 향후 기저질환에 대한 세분류를 할 수 있는 연구가 필요하고, 각 기저질환이 전염병에 미치는 영향에 대해서도 연구가 필요하다.
주제어 : 뇌파데이터, 기저질환, COVID19, 뉴럴네트워크, NEWFM, ZNN
Abstract In January 2020, COVID19 plunged the whole planet into a pandemic. This has caused great economic losses and is causing social confusion. COVID19 has a superior infection rate among people with underlying disease such as heart disease, high blood pressure, diabetes, stroke, depression, and cancer. In addition, it was studied that patients with underlying disease had a higher fatality rate than those without underlying disease. In this study, the presence or absence of underlying disease was classified using EEG data. The data used to classify the presence or absence of underlying disease was EEG data provided by Data Science lab, consisting of 33 features and 69 samples. Z-score was used for data pretreatment. Classification was performed using the neural network NEWFM and ZNN engine.
As a result of the classification of the presence or absence of the underlying disease, the experimental results were 77.945 for NEWFM and 76.4% for ZNN. Through this study, it is expected that EEG data can be measured, the presence or absence of an underlying disease is classified, and those with a high infection rate can be prevented from COVID19. Based on this, there is a need for research that can subdivide underlying disease in the future and research on the effects of each underlying disease on infectious disease.
Key Words : Electroencephalogram data, underlying disease, COVID19, neural Network, NEWFM, ZNN
*This study was supported by jangan university Research Grant in 2020.
*Corresponding Author : Hee-Jin Yoon([email protected])
Received November 2, 2020 Revised December 1, 2020 Accepted December 20, 2020 Published December 28, 2020
1. 서론
전 세계는 2020년 1월에 시작된 COVID19로 팬데믹 에 빠져있다. 높은 치명률을 보이고 있는 COVID19는 세계 경제에 큰 손실을 가져왔으며, 코로나블루로 많은 사람들이 일상생활에 어려움을 느끼며 사회적으로 혼란 을 일으키고 있다[1]. 이러한 코로나19는 심장병, 고혈 압, 당뇨, 뇌졸중, 우울증, 암, 고지혈증, 대상포진 등과 같은 기저질환자들에게 감염률이 월등히 높다[2]. 아직 백신이 개발되지 않은 상황에서 최선의 방법은 예방이다.
COVID19는 낮아지는 기온과 더불어 재확산이 되고 있 으며, 전파경로도 확실하지 않은 확진자들이 늘어나고 있 다. 본 연구에서는 뇌파데이터에 대해 뉴럴네트워크를 이 용하여 기저질환의 유무를 분류하였다. 분류를 위해 사용 된 뉴럴네트워크는 가중소속함수를 이용하여 클래스를 분류하는 NEWFM(NEural network with Weighted Fuzzy Membership funcion)과 ZNN(Zoom-in Neural Network) 두 방법으로 실험하였다.
2. 관련연구
2.1 뇌파데이터분석
뇌파(Electroencephalography, EEG) 데이터는 뇌 신경 사이의 전류 흐름의 전위 차이를 측정하는 전압계 와 같은 원리로 신호가 전달될 때 생기는 전기 흐름이다.
뇌파 데이터는 각각의 심신 상태에 따라 다르게 나타난 다. Fig. 1.과 같이 뇌파 데이터는 5개의 주파수에 의해 델타()리듬(0~4 Hz), 쎄타()리듬(4~8 Hz), 알파 ()리듬(8~13 Hz), 베타()리듬(13~30 Hz), 감마 ()리듬(30~50 Hz)으로 분류한다[3-6].
Fig. 1. Frequency of EEG_Data
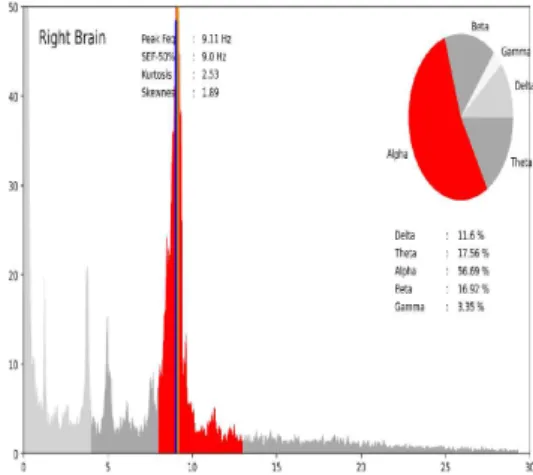
사용된 데이터 중 기저질환이 없는 사람의 좌·우 뇌파 데이터와 기저질환이 있는 사람의 좌·우 뇌파 데이터를 측정한 결과 Fig. 2. Fig. 3.와 Fig. 4. Fig. 5.같이 나타났 다. 뇌파 데이터의 주파수 대역은 델타 – 쎄타 – 알파 – 베타- 감마 순으로 느린 리듬에서 빠른 리듬으로 주파수 가 구성되며, 델타 주파수 영역은 내부의식 정보처리로 안정적인 환경을 의미하며 감마 주파수 영역으로 갈수록 외부의식 정보를 처리한다[7]. 뇌 휴식상태는 쎄타와 베 타 사이의 알파 주파수 영역을 의미한다. 즉, 스트레스나, 정신적 부하에서 뇌 휴식상태가 되면 알파 리듬이 주요 하게 증가하는 것을 확인 할 수 있다. 노화나 만성피로, 치매, 기저질환 등으로 뇌 기능이 저하 된 상태에서는 피 크가 퍼져있고 주파수가 낮은 쪽으로 이동되어있다. 또한 후두엽에서 알파파가 많이 나오는 알파 맵 표준패턴이 무너지는 것을 알 수 있다[8-10].
Fig. 2. Right EEG without underlying disease
Fig. 3. Left EEG without underlying disease
Fig. 4. Left EEG with underlying disease
Fig. 5. Right EEG with underlying disease
기저질환이 없는 사람의 Fig.2. Fig.3.와 기저질환이 있는 사람의 Fig. 4., Fig. 5.에서 보는 바와 같다. 이러한 특징을 가지고 있는 뇌파 데이터를 이용하여 기저질환의 유·무에 대한 실험을 하였다. 실험데이터는 33개의 특징 을 가진 69개의 샘픔(데이터사이언스랩 제공: Kdata 데 이터바우처)로 이루어져있다[11]. 33개의 특징에 대한 설명은 아래 Table 2.와 같다. 이 데이터의 기저질환의 종류는 고혈압, 당뇨, 뇌졸중, 우울증, 암, 고지혈증, 대상 포진, 청력 장애를 기저질환으로 포함하였고, 클래스는 기저질환과 기저질환이 없는 자로 분류하였다.(1-기저질 환자, 2-기저질환이 없는 자)
2.2 NEWFM(NEural network with Weighted Fuzzy Membership funcion)
뉴럴네트워크인 NEWFM은 입력계증, 하이퍼박스, 클 래스 분류계층으로 이루어진 지도학습 퍼지 신경망이다.
뇌파 데이터를 입력받아 가중퍼지소속함수의 비중복면적
의 가중치를 이용하여 대, 중, 소의 퍼지소속함수의 셑으 로 구성하며, 입력된 데이터를 학습한 후 멤버쉽 함수에 의해 기저질환이 있는 사람과 기저질환이 없는 사람을 분류한다. [12-14]
2.3 ZNN( Zoom-in Neural Netwok)
NEWFM에서의 특징추출의 단점을 보완하기 위해 개 발된 엔진으로 NEWFM에서 학습 후 특징들을 기저질환 의 유·무를 분류하는데 좋은 영향을 주는 특징과 좋지 않 은 영향을 주는 특징들을 모아서 다시 학습을 시킨다. 실 행 방법은 Fig. 6과 같다.
Fig. 6. Structure of ZNN
3. 제안방법
뉴럴네트워크를 이용하여 뇌파데이터에 대한 기저질 환 유무를 분류하기 위한 실험 절차는 아래 Fig. 7.와 같 이 3단계로 제안한다.
- Step 1. 기저질환자 유무에 대한 분류를 위해 사용된 데이터는 데이터사이언스랩에서 제공하는 뇌파데이터 로 33개의 특징과 69개의 샘플로 이루어졌다.
- Step 2. 데이터의 전처리는 Z-score를 사용하였다.[15]
- Step 3. (특징추출과 분류) 데이터의 특징 중 기저질환 자의 유무를 분류하기 분류에 좋은 영향을 주는 특징 과 좋지 않은 영향을 주는 특징들을 선택한다. 분류는 뉴럴네트워크 인 NEWFM과 ZNN(Zoom-in Neural Netwok) 두 방법으로 실험하였다.
Fig. 7. Process of Experiment
4. 실험
실험 조건은 아래 Table 1.와 같다. 클래스 분류를 위 한 방법은 sum of matched 방법을 사용하였으며, 가중 치는 0.04로 100,000회를 학습하였다. 조건은 NEWFM 과 ZNN 동일한 조건으로 실험하였다.
Method for Class Decistion sum of matched Method for Ordering Feature calculation with match count
Adjust Rate for Vertices 0.03
Adjust Rate for Weights 0.04
Count of Training 100,000
Table 1. Experimental conditions
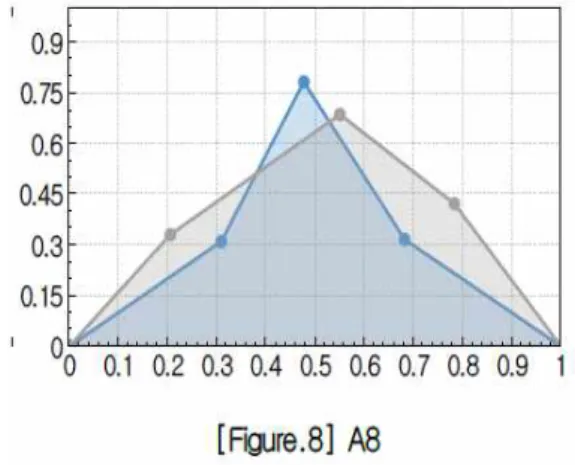
특징 중 분류에 가장 좋은 영향을 주는 8번 특징(안정 뇌파: Skewness_R:뇌 활성도 (피크 치우침 정도)이며 분류에 가장 좋지 않은 영향을 주는 특징은 27번 특징(인 지뇌파: low_cont: 종합적인 집중 수준 평가)으로 나타 났다. Fig. 8은 특징 8번으로 분류에 좋은 영향을 주는 비중복면적을 나타낸 그림이며, Fig 9.는 분류에 좋지 않 은 영향을 나타내는 27번 특징의 비중복면적을 나타내고 있다.
Fig 8.과 Fig 9.에서 보는 바와 같이 8번 특징은 클래 스1과 클래스2의 비중복면적이 뚜렷하게 구분이 되어진 다. 반면, Fig 9.에서 27번 특징의 비중복면적은 클래스 1과 클래스 2의 구분이 뚜렷하지 않다. NEWFM을 이용 하여 실행한 결과 77.9412% 나타났으며, ZNN 엔진을
이용하여 실행한 결과는 Layer 2단계까지 실험한 결과 76.47 %이 결과를 얻었고, Layer 3단계에서는 72.3 % 의 결과를 나타냈다.
Fig. 8. Non-weighted bounded area of feature number 8.
Fig. 9. Non-weighted bounded area of feature number 27.
5. 결론
이 연구를 통해 뇌파 데이터를 측정하고 기저질환의 유무를 분류하여 COVID19에 높은 감염률을 보이는 기 저질환자들을 COVID19로부터 예방 할 수 있으리라 기 대한다. 이를 기반으로 향후 기저질환에 대한 세분류를 할 수 있는 연구가 필요하고 각 기저질환이 전염병에 미 치는 영향에 대해서도 연구하고자 한다.
Order Category Item Description
1
rest electroencep
halogram
Peak freq_L left brain peak frequency
brain cell activity, degree of development, and degree of aging -age: Normal range-
1 year old: 5Hz or higher 3 year old: 6Hz or higher 5 year old: 7Hz or higher 8 year old: 8Hz and above
10+ : 8Hz to 12Hz
2 Peak freq_R right brain peak frequency
3 SEF50%_L left SEF50% frequency Brain fatigue(analyzed through the location of the Far Worth Spectrum (SEF)50% cumulative frequency and the alpha
eigenrhythm peak frequency position)
4 SEF50%_R Right SEF50% frequency
5 Kurtosis_L left brain kurtosis
Brain health
6 Kurtosis_R right brain kurtosis
7 Skewness_L left brain skewness
Brain activity(peak bias)
8 Skewness_R right brain skewness
9 Delta_L left brain delta power
a deep sleep
10 Delta_R right brain delta power
11 Theta_L left brain theta power
a sleepy or deep meditation poem
12 Theta_R right brain thetar power
13 Alpha_L left brain alpha power
Relaxed
14 Alpha_R right brain alpha power
15 Beta_L left brain beta power
Awakening state, conscious activity, general work
16 Beta_R right brain beta power
17 Gamma_L left brain gammer power
Activate in High cognitive action
18 Gamma_R right brain gammer power
19 bal_L left brain balance
balance of body and emotion
20 bal_R right brain balance
21
recognition electroencep
halogram
low_cs low level balance
intensity of cognitive task induced brain wave gamma wave
22 med_cs middle level cognitive intensity
23 high_cs high level cognitive intensity
24 low_ct low level cognitive speed
Cognitive tas recognition and response speed
25 med_ct middle level cognitive speed
26 high_ct high level cognitive speed
27 low_cont low level concentration
Comprehensive Level of Concentration Evaluation
28 med_cont middle level concentration
29 high_cont high level concentration
30 workload workload load The level of stress you feel when you perform a task
31 act_L left brain Degree
Gamma power of the left brain wave
-problem-solving tendencies:logical, analytical, linguistic, mathematical and sequential information processing methods.
32 act_R right brain Degree
Gamma power of Right Brain wave (if the right brain is more active,
- Problem-solving propensity:similar, intuitive, non-verbal, spatial and total information processing methods
33 Sex Target sex information 1 : female, 0 : male
34 Underlying
disease Underlying information
1 : high blood pressure 2 : diabetes 3 : cerebral apoplexy
4 : depression 5 : cancer 6 : hyperlipidemia
7 : herpes zoster 8 : hypacusis
9 : etc....
Table 2. Description of Feature [9]
REFERENCES
[1] Soo Lin, Hyunjung Lin, Jean-Pierre Despres,
“Collateral Damage of the COVID-19 pandemic on Nutritional Quality and Physical Activity:Perspective from South Korea“ volume 28, Issue 10. October2020.
P,1788-1790.
DOI: https://doi.org/10.1002/oby.22935
[2] Miyoung Choi,PhD, Ho Gyun Shin, MPH, Yan Jin, PhD, Joo Youn Kim, PhD, Kwang Hyub Han, MD ,“COVID-19 Pandemic-Epidemiology“ Joumal of the Korean Medical Association Aug2020;63(8):504-511.
DOI: 10.5124/jkma.2020.63.8.504
[3] Sohaib. A.T, Qureshi. S, Hagelback. J, Hilborn. O, and Jercie, P, “Evaluating classifiers for emotion recognition using EEG,“ Foundations of Augmented Cognition Lecture Notes in Computer Science, vol.
8027, pp. 492-501, 2013.
DOI: 10.1007/978-3-642-39454-6_53
[4] Duda. T. O, Hart. P. E, and Stork. D G, “Pattern classification, “Wiley-INterscience, 2000
DOI: https://doi.org/10.1007/BF01237942
[5] Landfield PW, McGaugh JL, Tusa RJ. “Theta Rhythm: A Temporal Correlate of Memory Storage Processes in the Rat“ Science 1972:175:87-89
DOI: https:doi.org/10.1126/xcience.175.4017.87 [6] Ole Jensen, Jochen Kaiser Jean-Philippe Lachaux
“Human gamma-frequency oscillations associated with attention and memory“ Trends in Neurosciences, Volume 30, Issue7, P.317-324
DOI: https://doi.org/10.1016/j.tins.2007.05.001
[7] Hyunju Lee, Dongil Shin dongkyoo Shin “A research on the emotion classification and precision improvement of EEG(Electroencephalogram)data using machine learning algorithm“ J,internet computer.Serv. ISSN 1598-0170 pp.27-36. 2019 DOI: 10.7472/jksii.2019.20.5.27
[8] Schnitzler a, Gross J. “Normal and pathological oscillatory communication in the brain.“ Nat Rev Neurosci 2005; 6:285-296.
DOI: 10.1038/nrn1650
[9] Jensen O, Kaiser J, Lachaux JP. Human gamma-frequency oscillations associated with attention and memory. Trends Neurosci 2007;30:317-324.
DOI:10.1016/j.tins.2007.05.001
[10] Alexander Craik, Yongtian He Jose L Contreras-Vidal,
“Deep learning for electroencephalogram(EEG) classification tasks:a review April 2019.
DOI:doi.org/10.1088/1741-2552/abOab5 [11] DataScience Lab
[12] S.H. Lee and J.S. Lim, Parkinson’s disease classification using gait characteristics and wavelet-based feature extraction, Expert Syst. Appl.
39 (2012), 7338-7344
DOI:doi.org/10.1016/j.eswa.2012.01.084
[13] Heejin Yoon, Bohyun Wang and JoonS. Lim, Prediction of Time Series Microarray Data using Neurofuzzy Network, Indian Journal of Science and Technology, Vol8(26), IPL0485, October 2015.
DOI:10.17485/ijst/2015/v8i26/80728
[14] Sang-Hong Lee, Hyoung J. Jang, Joon S.Lim“Forecasting Short-Term KOSPI Time Series Based on NEWFM“ New Directions in intelligent Interactive Multimedia pp.175-184.2008.
DOI:doi.org/10/1007/978-3-540-68127-4_18 [15] http://www.wikipedia.org
윤 희 진(Hee-Jin Yoon) [정회원]
· 1998년 ~2001년 : 동국대학교 공학 석사
· 2011년 ~ 2015년 : 가천대학교 공학 박사
· 2013년 ~ 현재 : 장안대학교 인터넷 정보통신과 조교수
· 관심분야 : 인공지능, 빅데이터
· E-Mail : [email protected]

![Table 2. Description of Feature [9]](https://thumb-ap.123doks.com/thumbv2/123dokinfo/5559393.473632/5.892.104.793.153.1106/table-description-feature.webp)
