Journal of Radiological Science and Technology, 38(4), 365-374 eISSN 2384-1168 ISSN 2288-3509 http://dx.doi.org/10.17946/JRST.2015.38.4.05
<원저>
Measurement of Image Quality According to the Time of Computed Radiography System *
- 시간에 따르는 CR장비의 영상의 질평가 -
Department of Radiology, Asan Medical Center
1) Department of College of Health Science, Radiologic Science, Korea University
2) Department of Radiological Technology, Baekseok Culture University
3) Department of Radiological Technology, Dongnam Health University
4) Department of Radiology, Kyung Hee University Hospital at Gang-dong
5) Department of Radiation Oncology, Sanggye Paik Hospital
6) Department of Bio-Technologist and Laboratory Animal, Shingu University College
7) Department of Radiological Technology, Shingu University College
Soon-Yong Son・Kwan-Woo Choi・Jung-Min Kim 1) ・Hoi-Woun Jeong 2) ・ Kyung-Tae Kwon 3) ・Sun-Kwang Hwang 4) ・Ik-Pyo Lee 4) ・Ki-Won Kim 4) ・
Jae-Yong Jung 5) ・Young-Ah Lee 6) ・Jin-Hyun Son 7) ・Jung-Whan Min 7)
― Abstract ―
The regular quality assurance (RQA) of X-ray images is essential for maintaining a high accuracy of diagnosis. This study was to evaluate the modulation transfer function (MTF), the noise power spectrum (NPS), and the detective quantum efficiency (DQE) of a computed radiography (CR) system for various periods of use from 2006 to 2015.
We measured the pre-sampling MTF using the edge method and RQA 5 based on commission standard in- ternational electro-technical commission (IEC). The spatial frequencies corresponding to the 50% MTF for the CR systems in 2006, 2009, 2012 and 2015 were 1.54, 1.14, 1.12, and 1.38 mm-1, respectively and the10% MTF for 2006, 2009, 2012, and 2015 were 2.68, 2.44, 2 .44, and 2.46mm-1, respectively. In the NPS results, the CR systems showed the best noise distribution in 2006, and with the quality of distributions in the order of 2015, 2009, and 2012. At peak DQE and DQE at 1 mm-1, the CR systems showed the best efficiency in 2006, and showed better efficiency in order of 2015, 2009, and 2012. Because the eraser lamp in the CR systems was re- placed, the image quality in 2015 was superior to those in 2009 and 2012.
This study can be incorporated into used in clinical QA requiring performance and evaluation of the per- formance of the CR systems.
Key Words : Modulation transfer function (MTF), Noise power spectrum (NPS), Detective quantum efficiency (DQE)
* This study was supported by the department of radiology, Shingu University.
Corresponding Author: Jung-Whan Min (13174) Department of radiology, Shingu University 377
Ⅰ. INTRODUCTION
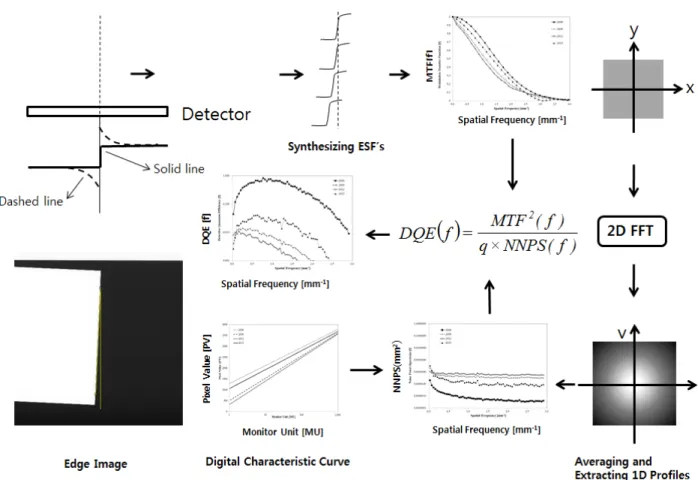
Digital medical imaging has improved rapidly with the recent development of computed radiography (CR) and picture archiving and communication systems (PACS) 1) . CR systems have a fundamental advantage in that CR detectors are generally not integrated into a given X-ray system and can be used with X-ray units from different suppliers. Other advantages of CR systems are convenient storage of radiological data, increased flexibility in image processing, and consistent reproducibility along with a greater dynamic range, wider exposure latitude and reduced patient exposure 2,3) . The measurement used to evaluate the fundamental performance of imaging systems are the modulation transfer function (MTF), noise power spectrum (NPS) and detective quantum efficiency (DQE) 4,5) . The MTF describes the signal transfer characteristics of the system as a function of spatial frequency. Various performance evaluation methods based on bar patterns, slits and edges have been suggested to calculate the pre-sampled MTF of the digital radiograph system 6-8) . The edge methods are generally used and preferred for various reasons, including having a simple construction and less sensitivity with respect to misalignment. Thus, methods for determining the edge response are acceptable for MTF measurements 8,9) . An accurately measured MTF is used to describe the imaging performance of the overall radiograph and it is essential in order to decide the DQE of the imaging device 4) . The NPS is one of the most general methods regarding measurements of the noise and quality of the image acquired with a uniform radiation field. It describes the noise and spatial frequency properties within the image 5) .
Various studies based on these methods of performance evaluation have been reported for measuring the physical performance of the CR systems 10-12) . However, previous studies have conducted comparison among the manufacturers and performance according to the exposure time of the image plate (IP) without regard to the aging of the CR systems and did not have include the IP and IP reader according to period of use. Over prolonged repeated exposures of the CR plates, the image quality begins to degrade, making it increasingly difficult for physicians
to determine anatomic structure. The latent images remain on the IP. Thus, erasing the IP with a light source of high density is needed before reusing the IP. This is accomplished using a high-pressure sodium or fluorescent lamp 13) . The time and level required to erase the IP depend upon the previous X-ray exposure and brightness of the lamp. The erasure rate is enhanced if the initial erasure is performed with a light spectrum that includes the ultraviolet (UV) range followed by a spectrum with the UV filtered out 14) . Thus, maintaining the CR systems, including the replacement of the erasing lamp, has an important role and is essential for accurate diagnosis. The purpose of this study is to evaluate the MTF, the NPS and the DQE of CR systems during various periods of use, from 2006 to 2015 (specifically, during 2006, 2009, 2012 and 2015).
Ⅱ. MATERIALS AND METHODS
1. Computed Radiography System
The Kodak Digital Science CR Systems consist of the storage phosphor reader, two types of storage phosphor screens, a bar code scanner for entering patient and exam information, and a workstation for reviewing the radiographs. The IP is a photo-stimulating-phosphor (PSP) based detector that stores X -ray energy characterized by high sensitivity and high sharpness for its image recording layers. The PSP material is a barium-strontium-fluoro-bromide/iodide (BaSrFBrI) compound doped with trace amounts of europium (Eu 2+ ).
Its luminescence peak is around 400 nm. The size of
the cassettes is 35 × 43 cm 2 , and the matrix size of
the image is 2048 × 2500 pixels, with a pixel size of
0.172 mm. IPs are lead-backed to ensure optimal
backscatter protection and to avoid the adverse effects
of backscatter on the image quality. The CR systems
with an IP were used for the measurements, as listed
in Table 1. The five IPs exposed under 200 times were
used in measurement. IPs were only used for measurement
of this study.
2. Measurements
We used RQA 5 based on commission standard international electro-technical commission (IEC). The source image distance (SID) was 150 cm, and an additional filtration of 21 mm Al was used. The tube voltage was 72 ± 2 kilovolt peak (kVp), and the half-value layer (HVL) was set to 7.1 ± 1 mmAl by adjusting 1 ~ 2 kVp. In order to obtain MTF measurements, should be restricted and the source must be perpendicular to the edge boundary’s surface center (Figure. 1).
3. MTF Measurements
The MTF measurement was performed using the pre- sampled MTF method described by Fujita et al. 6, 15-18) . Fujita et al. developed a useful method for measuring the pre-sampling MTF and described it in 6) . Because the pre-sampling MTF does not include the aliasing error, the pre-sampling MTFs for analog films and screen systems or for different digital X-ray systems can be compared. The pre-sampling MTF is the most reliable method to evaluate the resolution characteristics. The MTF describes the resolution of the detector. The MTF
Figure 1 In order to obtain MTF measurements, should be restricted and the source must be perpendicular to the edge boundary’s surface center. The MTF was computed by performing a fast Fourier transfer (FFT) of the LSF and normalizing its value to unity at a zero spatial frequency. The one-dimensional NPS was expressed by averaging the axis direction from the bandwidth of the two dimensional NPS space, and the accumulation correction was calculated by extracted the ROI from the whole image size. The DQE was evaluated from the measured MTF and NPS
Model IP type Imaging area (cm2) Pixel matrix Pixel size
Kodak GP-25 GP 35 × 43 2048 × 2500 0.172 mm
Table 1 Investigated CR imaging system and their principal characteristics
was measured using the slant-edge consist of 1 mm tungsten (W) (2 ~ 3°) method to avoid aliasing because of the relatively large sampling interval of the detector.
The edge spread function (ESF) thus acquired was differentiated to obtain the line spread function (LSF).
The MTF in the direction perpendicular to the original edge line was computed by performing a fast Fourier transfer (FFT) of the LSF and normalizing its value to unity at a zero spatial frequency. The calculations of the MTF and NPS were performed by using Excel.
4. NPS Measurements
The NPS as a function of spatial frequency measures the variations in the noise amplitude and describes the noise and spatial frequency properties within the image.
The method for computing the NPS as used in our QA algorithm, can be described by using recommendations by the IEC 62220-1 for the standardization of the NPS.
[ ( ) ]
2( ) 22
,
) 2 ,
( N N I x y I e dxdy
N N v I u
NPS
x y j uxvyy x
y
x
⎟ ⎟ Δ − Δ
− +⎠
⎞
⎜ ⎜
⎝
⎛ Δ Δ
=
π(1)
In equation (1), where u and v indicate the spatial frequencies along the x and the y axes. Δ x and Δ y are the sizes of the detector pixels along the x and the y axes. N x and N y indicate the sizes of the open fields along the x and the y axes (in numbers of pixels). I indicates the average value of the pixel intensity regarding the open field image. ΔI(x,y) indicates the difference in images between two images for the same open fields. ΔI is the pixel intensity’s average value regarding the other image’s ΔI(x,y) difference.
For evaluating the NPS, white images are obtained by projecting onto detectors without imaging an object. We applied two-dimensional FFTs in order to obtain region of interest (ROI) images and performed a scale revision by using the average ROI extracted from the whole image. The matrix was 1024 × 1024 pixels, the pixel size was 0.172 × 0.172 mm 2 , and the field of view was 17.6 × 17.6 cm 2 . Image preprocessing as applied in normal clinical use of the detector consists of offset and gain corrections, as well as
compensation for defective or nonlinear pixels. A pixel has a bit depth of 16 bits. The image data were acquired from the central area of each image by overlapping from a 256 × 256 ROI with a pixel sampling pitch of 0.172 mm.
5. DQE Measurements
DQE was calculated by using MTF, normalized NPS (NNPS), and the following equation (2).
( )
f q MTF NNPS ( ( f f ) )
DQE = ×
2(2)
In equation (2), MTF 2 (f) is the MTF that depends on the frequency, NPS is the NPS that depends on the frequency and NNPS (f) is the normalized NPS that depends on the frequency and q is the number of X-ray photons. The DQE indicates the characteristic gradient of the image. In contrast, the NPS indicates the characteristic of noise and the number of X-ray photons per penetrated area in the system. We used RQA 5 based on IEC photon fluence (photons/mm 2 ). The DQE can be evaluated from the measured MTF and NPS.
Ⅲ. RESULTS
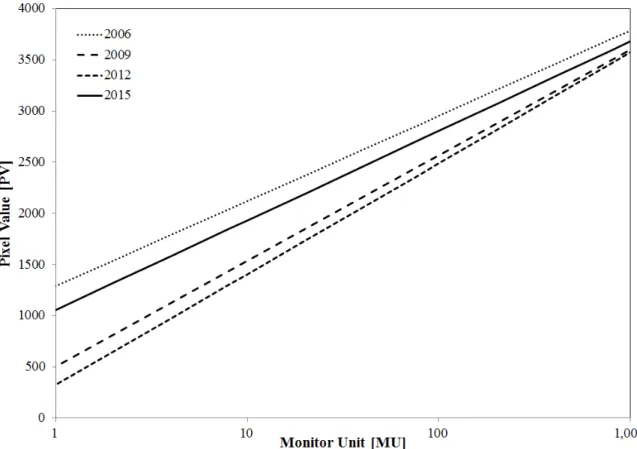
1. Detector Response
“For processing” digital image communication of
medicine (DICOM) images were then acquired, with
standard corrections for the X-ray heel effect, detector
offset, gain, and defective pixels being applied. Linear
measurement was not affected by bad pixel and gain
corrections. This is clear because CR systems measured
during various periods of use, 2006, 2009, 2012, and
2015, indicated values of 0.9960, 0.9972, 0.9975, and
0.9980, respectively. In Figure 2, the R 2 value close to
1 shows stabilized linearity of the system. The results
also showed linearity for the MTF measurements in our
experiments.
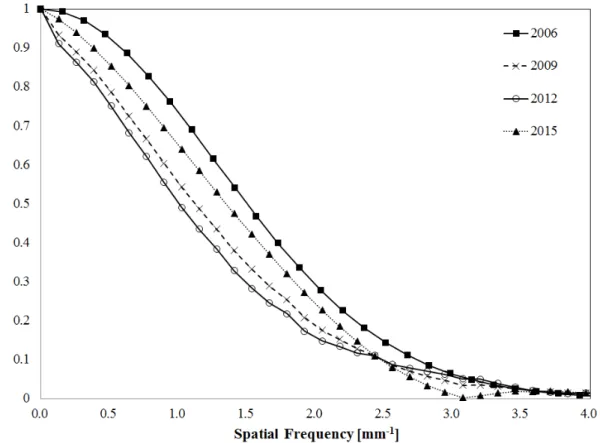
2. Modulation Transfer Function (MTF) For the edge method for measuring MTF, because the ESF, LSF, and windowing function affect the results, we used the standard method. Table 2 shows the spatial frequencies for the 10% and the 50% pre- sampling MTFs. We evaluated the pre-sampling MTF of the CR systems during various periods of use, from 2006 to 2015 (2006, 2009, 2012, and 2015).
In our results, the spatial frequencies corresponding
to the 50% MTF for the CR systems in 2006, 2009, 2012 and 2015 were 1.54, 1.14, 1.12, and 1.38 mm -1 , respectively. The spatial frequencies corresponding to the 10% MTF for 2006, 2009, 2012 and 2015 were 2.68, 2.44, 2.44, and 2.46 mm -1 , respectively(Figure. 3).
3. Noise Power Spectrum (NPS)
Figure. 4 presents the NPS profiles and shows the effect of additional Gaussian noise for the CR systems Figure 2 The R 2 value close to 1 shows stabilized linearity of the system. The CR systems measured at various periods of use showed a linearity that was close to 1 for the MTF measurements
Period of use
Spatial Frequency for MTF 50% (mm-1)
Spatial Frequency for MTF 10% (mm-1)
MTF at 1 mm-1
Peak DQE
DQE at 1 mm-1
2006 1.54 2.68 0.75 0.96 0.9
2009 1.14 2.44 0.57 0.024 0.0084
2012 1.12 2.44 0.52 0.012 0.0056
2015 1.38 2.46 0.66 0.064 0.048
Table 2 Results of the MTF and DQE of the CR systems for various period of use; MTF was evaluated for 50% and 10%
MTF curves at 1 mm -1 and then peak DQE and DQE at 1 mm -1 were calculated
Figure 4 The NPS spectra of the CR systems during various periods of use. The CR systems indicated that noise distribution is, from best to worst, 2006, 2015, 2009, 2012
Figure 3 Comparison of MTF curves for the CR systems during various periods of use. The CR systems indicated
that MTF curves are, from best to worst, 2006, 2015, 2009, 2012
during various periods of use, from 2006 to 2015 (2006, 2009, 2012, 2015) in each direction. The NPS for the CR detector was observed up to a spatial frequency of 3.0 mm -1 and included a low Nyquist frequency. It was showed a uniform distribution with increasing spatial frequency. In the NPS results, the CR systems in 2006 showed the best noise distribution, and showed better noise distributions in the order of 2015, 2009, and 2012.
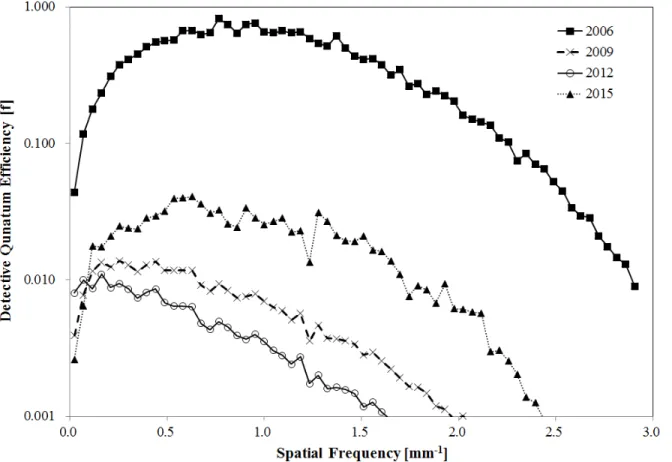
4. Detective Quantum Efficiency (DQE) Table 2 lists the peak DQE and the DQE at a spatial frequency of 1 mm −1 for the CR systems for various periods of use, from 2006 to 2015 (2006, 2009, 2012, 2015); our data are indicated in Figure. 5. The peak DQE for the CR systems in 2006, 2009, 2012, and 2015 were 0.96, 0.024, 0.012, and 0.064, respectively. The CR systems showed the best efficiency in 2006, and
showed better efficiency in the order of 2015, 2009, and 2012. The DQE of the CR systems in 2006, 2009, 2012, and 2015 for a spatial frequency of 1mm -1 were 0.9, 0.0084, 0.0056, and 0.0048, respectively. The CR systems showed the best efficiency in 2006, and showed better efficiency in the order of 2015, 2009 and 2012.
Ⅳ. DISCUSSION
Generally, the image quality decreased with increasing time of use for the X-ray generator, IP cassette, reader and eraser lamp. According to the results of the MTF, the NPS and the DQE of the CR systems over the period of use from 2006 to 2015 (measured in 2006, 2009, 2012, and 2015), the image quality measured in 2006 indicated the best performance. However, a noticeable point is that the results for MTF, NPS, and DQE in 2015 were
Figure 5 The DQE of the CR systems during various periods of use. DQE was evaluated by measuring MTF and NPS.
The CR systems indicated quantum efficiency was, from best to worst, 2006, 2015, 2009, 2012
superior to the results in 2009 and 2012. These results could be attributed to the deterioration of the CR systems and missing the replacement time of eraser lamp in 2009 and 2012. In Figure. 3, the MTFs at 0 ~ 2.5 mm -1 in 2009 and 2012 were superior to the MTF at 0 ~ 2.5 mm -1 in 2015. However, the MTF at 2.5 ~ 3.5 mm -1 in 2015 was superior to the MTFs at 2.5 ~ 3.5 mm -1 in 2009 and 2012. These results indicated that, at low and high frequencies, the MTF is subject to deterioration of the CR systems and replacement time of the eraser lamp.
Another factor is scan time. The Photo-Stimulated Luminescence (PSL) signal from one pixel would not be completely decayed before the PSL from the next was initiated. Consequently, it would bleed into the next pixel and cause spatial blurring. To avoid this, several time constants should elapse between the readouts.
Present day CR systems are of two general types:
cassette-based systems where the IP is enclosed in a light-tight cassette for the X-ray exposure, then subsequently moved by hand to the readout system;
and integrated readout systems where the IPs are captive within the readout system, re-circulated and reused without handling. Both types use a flying spot readout system, in which a laser spot is scanned with a mirror over the exposed IP in a point-by-point raster pattern. The flying spot scanner is not the only possible approach, but is common in commercially available medical CR systems. For scanning of IPs, highly collimated beams produced by lasers are essential. A circular beam with a Gaussian intensity in cross section is desirable. This should be accomplished by using helium–neon gas lasers or solid-state laser diodes 19) . The advantages of solid-state laser diodes compared to continuous gas lasers are that solid- state lasers are more compact and energy-efficient, have a long operational lifetime, and have an output intensity that can be controlled electrically. Because the eraser lamp in the CR systems was replaced, the image quality in 2015 was superior to those in 2009 and 2012. There are three reasons for these results.
First, over prolonged repeated exposures of the CR plates, the image quality begins to degrade, and latent images remain on the IP. Thus, erasing the IP
with a light source of high density is required before reusing the IP. Before using the IP, measuring the number of uses of the IP is necessary. The time and level of erasing the IP are subject to previous exposure to X-rays and brightness of the lamp 19) . Second, the decreased image quality of the CR systems is caused by the deterioration of the eraser lamp and dust on the photomultiplier (PM) tube. Thus, the regular QA for physical characteristics should be performed. Third, during the read out, the intensity of the laser should remain steady so that the emission rate for images is maintained. The topical review for CR by Rownalds reported that the MTF decreases with an increase of the emission rate, is known as phosphor blunting 20) . However, MTF is increased with an increase of emission rate, which we call beam sharpening. Beam sharpening arises from the interaction of only the leading edges of the readout beam with the remaining latent image resulting in better MTF at high emission rates than at low. Thus, laser emission rate in the scanner of the CR systems should be maintained at constant intensity. If the factors that affect the emission rate are changed, the MTF, NPS, and DQE are affected although the same reader and IP are used. Generally, the replacement time of the eraser lamp that causes the deterioration is very important, and the MTF, NPS and DQE should be performed for QA. American association of physicists in medicine (AAPM) Report no. 93 recommended conducting the QA for the CR systems monthly, quarterly, and annually, doing things such as erasing the IP cassette, evaluating image quality using the QA program, and maintaining the work station 21) .
In this study, the DQE results in 2006 are superior
to those in 2009, 2012, and 2015, and these results
indicate that maintaining the CR systems is important
as recommended by the AAPM, and R 2 value close to
1 shows stabilized linearity of the system. The results
also showed linearity and reproducibility for the MTF
measurements in our experiments.
Ⅴ. CONCLUSION
This study was undertaken to evaluate the MTF, the NPS and the DQE of the CR systems for various periods of use, from 2006 to 2015 (2006, 2009, 2012, and 2015), in order to maintain a high accuracy of diagnosis. The remaining latent image resulting in better MTF at high emission rates than at low. Thus, laser emission rate in the scanner of the CR systems should be maintained at constant intensity. With the progress of time, the deterioration in image quality and changes in general image quality were caused by practices in maintaining the CR systems. This study could be incorporated into used in clinical QA requiring performance and evaluation of the performance of the CR systems.
References
1. Schaetzing R. Computed radiography technology.
Proceeding of Radiological Society of North America, 10, 2003
2. Marshall NW, Monnin P, Bosmans H, Bochud FO, Verdun FR. Image quality assessment in digital mammography: part I. Technical characterization of the systems. Phys Med Biol, 56, 4201, 2011 3. Wandtke JC. Bedside chest radiology. State of the
art. Radiology, 190, 1, 1994
4. Gopal A, Samant SS. Validity of the line-pair bar-pattern method in the measurement of the mod- ulation transfer function (MTF) in megavoltage imaging. Med Phys, 35, 270, 2008
5. Jung-Whan Min, Hoi-Woun Jeong, Jung-Min Kim et al: Comparison of Noise Power Spectrum Methodologies in Measurements by Using Megavoltage X-ray Energies. J Korean Phys Soc, 60, 129, 2012 6. Fujita H, Tsai DY, Itoh T, Doi K, Morishita J, Ueda
K, et al. A Simple Method for Determining the Modulation Transfer Function in Digital Radiography.
IEEE Trans Med Imaging, 11, 34, 1992
7. Samei E, Flynn MJ, Reimann DA. A method for meas- uring the presampled MTF of digital radiographic systems using an edge test device. Med Phys, 25,
102, 1998
8. Greer PB, van Doorn T. Evaluation of an algorithm for the assessment of the MTF using an edge method.
Med Phys, 27, 2048, 2000
9. Samei E, Flynn MJ. An experimental comparison of detector performance for direct and indirect digital radiography systems. Med Phys, 30, 608, 2003 10. Dobbins T, Ergun DL, Rutz L, Hinshaw DA, Blume
H, Clark DC. DQE(f) of four generations of computed radiography acquisition devices. Med Phys, 22(10), 1581, 1995
11. Hillen W, Schiebel U, Zaengel T. Imaging perform- ance of a digital storage phosphor system. Med Phys, 14, 744, 1987
12. Bradford CD, Peppler WW, Dobbins III JT.
Performance characteristics of a Kodak computed radiography system. Med Phys, 26, 27, 1999 13. Seibert JA. The Expanding Role of Medical Physics
in Diagnostic Imaging for AAPM ed G D Frey and P Sprawls, 37, 1997
14. Matsuda T, Arakawa S, Koda K, Torii S, Nakajima N. New technical developments in the FCR9000, Fuji Computed Radiography Technical Review No 2, 1993.
15. Jung-Whan Min, Hoi-Woun Jeong, Jung-Min Kim et al: Performance of an Edge Block Used in a Configuration Detector: Image Quality Measurements.
J Korean Phys Soc, 64, 732, 2014
16. Jung-Whan Min, Hoi-Woun Jeong, Jung-Min Kim et al: Evaluation of the Modulation Transfer Function of Megavoltage X-rays. J Korean Phys Soc, 65, 1969, 2014
17. Soon-Yong Son, Jung-Whan Min, Jung-Min Kim et al: Evaluation of an Edge Method for Computed Radiography and an Electronic Portal Imaging Device in Radiotherapy: Image Quality Measurements. J Korean Phys Soc, 65, 1976, 2014
18. Jung-Whan Min, Ki-Won Kim, Jung-Min Kim et al: Evaluation of image quality by using a tungsten edge block in a megavoltage (MV) X-ray imaging.
Korean Journal of Medical Physics, 23(3), 154, 2012 19. Kengyelics SM, Launders JH, Cowen AR. Physical
imaging performance of a compact computed ra-
diography acquisition device. Med Phys, 25, 354, 1998
20. Rowlands JA. The physics of computed radiography.
Phys Med Biol, 47, R123, 2002
21. Seibert JA, Bogucki TM, Ciona T, Huda W, Karellas A, Mercier JR, et al. Report of AAPM Task Group 10, 1, 2006
∙ 국문초록
시간에 따르는 CR장비의 영상의 질평가
손순룡・최관우・김정민 1) ・정회원 2) ・권경태 3) ・황선광 4) ・이익표 4) ・김기원 4) ・ 정재용 5) ・이영아 6) ・손진현 7) ・민정환 7)
서울아산병원 영상의학과・1)고려대학교 방사선학과・2)백석문화대학교 방사선과
3)동남보건대학교 방사선과・4)강동경희대병원 영상의학과・5)상계백병원 종양학과
6)신구대학교 바이오 동물학과・7)신구대학교 방사선과