D I A B E T E S & M E T A B O L I S M J O U R N A L
This is an Open Access article distributed under the terms of the Creative Commons Attribution Non-Commercial License (https://creativecommons.org/licenses/by-nc/4.0/) which permits unrestricted non-commercial use, distribution, and reproduction in any medium, provided the original work is properly cited.
Association between the Thigh Muscle and Insulin Resistance According to Body Mass Index in Middle- Aged Korean Adults
Ji Eun Heo1,2, Jee-Seon Shim2,3, Hokyou Lee3, Hyeon Chang Kim2,3
1Department of Public Health, Yonsei University Graduate School, Seoul,
2Cardiovascular and Metabolic Disease Etiology Research Center, 3Department of Preventive Medicine, Yonsei University College of Medicine, Seoul, Korea
Background: We examined the associations between thigh muscle area (TMA) and insulin resistance (IR) according to body mass index (BMI) in middle-aged Korean general population.
Methods: TMA was measured using quantitative computed tomography and corrected by body weight (TMA/Wt) in 1,263 men, 788 premenopausal women, and 1,476 postmenopausal women all aged 30 to 64 years. The tertiles of TMA/Wt were calculated separately for men and for premenopausal and postmenopausal women. Homeostatic model assessment for insulin resistance (HOMA-IR) was performed using fasting blood glucose and insulin levels, and increased IR was defined according to sex-specif- ic, top quartiles of HOMA-IR. Associations between the TMA/Wt tertiles and increased IR according to the BMI categories (<25 and ≥25 kg/m2) were assessed using multivariable logistic regression analysis.
Results: In men with higher BMIs, but not in those with lower BMIs, the presence of an increased IR had significantly higher odds ratios in the lower TMA/Wt tertiles, even after adjustment for visceral fat area. However, in premenopausal and postmenopausal women, there was no significant inverse association between TMA/Wt tertiles and increased IR, regardless of BMI category.
Conclusion: Our findings suggest that the thigh muscle is inversely associated with IR in men, particularly in those with higher BMIs.
Keywords: Body composition; Insulin resistance; Muscles; Sarcopenia; Tomography, X-ray computed
Corresponding author: Hyeon Chang Kim https://orcid.org/0000-0001-7867-1240 Department of Preventive Medicine, Yonsei University College of Medicine, 50 Yonsei- ro, Seodaemun-gu, Seoul 03722, Korea
E-mail: [email protected]
INTRODUCTION
Sarcopenia, the degenerative loss of skeletal muscle mass, could be associated with a cardio-metabolic risk, metabolic disease, and psychological disorders [1-3]. Many studies have reported a significant inverse association between muscle mass and insulin resistance (IR). However, most of these studies were conducted in older adults or people with chronic condi- tions, such as diabetes mellitus, chronic obstructive pulmonary disease, or end-stage renal disease [4-8]. Some studies have been conducted in general populations [2,4,8-11], but only few
of them targeted middle-aged population [2,11]. And the re- sults were inconsistent. One study found a significant associa- tion between low muscle mass and higher IR in a middle-aged population [11]. Another noted a significant association be- tween low muscle mass and higher IR in an older adult popu- lation, but was unable to document the same association in a middle-aged population [2]. Although the initiation of muscle decline starts in the middle age, little information is available regarding the independent impact of low muscle mass and IR in the middle-aged general population.
Several lifestyle factors, including smoking, alcohol con- https://doi.org/10.4093/dmj.2019.0110
pISSN 2233-6079 · eISSN 2233-6087
sumption, exercise, and protein intake, could be determinants of decreases in muscle mass and function, and age-related muscle decline could be more prominent in men than in wom- en [12]. Although many characteristics differ between men and women, most studies on associations between muscle mass and IR have only addressed these differences in their analyses by adjustment, instead of stratification. Also, previous studies have demonstrated different trends in muscle and obe- sity indicators, including visceral fat, according to the meno- pausal status of women [13]. These differences according to sex and menopausal status could modify the relationships be- tween muscle mass and IR, but there are not enough studies and the mechanisms are not well established. In addition, it should be investigated whether the impacts of the muscle mass on IR are independent from those of known risk factors, in- cluding lifestyle factors and obesity status [14-16].
Accordingly, we sought to evaluate the independent rela- tionship between thigh muscle area (TMA) measured using quantitative computed tomography (QCT) and IR according to different body mass index (BMI) categories in middle-aged, relatively healthy, men and premenopausal and postmeno- pausal women.
METHODS
Study population
The present study utilized data from the Cardiovascular and Metabolic Disease Etiology Research Center (CMERC) cohort study, which was designed to recruit members of the general population residing in four districts (Seoul, Goyang, Gimpo, and Incheon) in South Korea. The inclusion criteria were 30 to 64 years of age, residing more than 8 months of the year at cur- rent residence with no plans to move over the next 2 years, and having the ability to provide verbal or written consent to par- ticipate in the study. Participants were excluded if they had been diagnosed with cancer within the last 2 years or were cur- rently being treated for cancer; had a history of myocardial in- farction, stroke, or heart failure; were currently involved in pharmaceutical trials; or were currently pregnant or reported the possibility of being pregnant on the day of registration. The detailed methods for the CMERC cohort study have been re- ported elsewhere [17]. This study initially enrolled 4,060 par- ticipants between 2013 and 2017. All participants completed health questionnaires and examinations according to a pre- defined protocol. Those with missing TMA variables (n=268),
those who were treated for diabetes mellitus (n=190), and those with a BMI under 18.5 kg/m2 (n=75) were excluded from the current analysis. Finally, a cross-sectional analysis was conducted of the remaining 1,263 men, 788 premeno- pausal women, and 1,476 postmenopausal women. All partici- pants provided written informed consent, and the study proto- col was approved by the Institutional Review Board of Sever- ance Hospital at Yonsei University College of Medicine (IRB No. 4-2013-0661).
Measurements
All participants were individually interviewed using standard- ized questionnaires to obtain information regarding demo- graphics, health behaviors, and medication use. Trained inter- viewers conducted face-to-face interviews and administered questionnaires according to a standard protocol. Health be- haviors included smoking status (current smoker, former smoker, or non-smoker), alcohol intake (current heavy drink- er, current non-heavy drinker, former drinker, or non-drink- er), physical activity, and sleep duration. Average alcohol con- sumption (in grams per drinking day) was calculated using the average number of alcoholic beverages consumed and the fre- quency of alcohol consumption, and then converted into the amount of ethanol in grams. Current heavy drinking was de- fined as drinking >40 g ethanol per drinking day for men and
>20 g per drinking day for women for two or more times a week [18]. Physical activity was assessed using the Internation- al Physical Activity Questionnaire-Short Form. For this study, high activity referred to activities that considerably increased an individual’s respiratory effort, whereas moderate activity re- ferred to those that moderately increased respiratory effort.
Regular exercise was defined as moderate-to-high-intensity physical activity performed at least three times per week. Sleep duration was recorded in hours per day (hr/day) and as the av- erage over the past year. Medication use (antihypertensive and lipid-lowering) was assessed by self-reports.
The study participants wore lightweight clothing for conve- nient and reliable examinations. BMI was calculated as the body weight divided by the standing height squared (kg/m2).
Waist circumference was assessed to the nearest 0.1 cm at the midpoint between the lower border of the rib cage and the iliac crest using an ergonomic circumference-measuring tape (SECA 201; SECA, Hamburg, Germany). Participants rested for 5 minutes before the blood pressure measurement, and sys- tolic and diastolic blood pressures were repeatedly measured
three times at 2-minute intervals. The average of the second and third measurements was used for analysis. Hypertension was defined as a systolic blood pressure ≥140 mm Hg, diastol- ic blood pressure ≥90 mm Hg, or a self-report of current use of an antihypertensive medication.
Blood samples were collected from the antecubital vein after the patients had fasted for at least 8 hours. Fasting blood glu- cose concentrations were measured using a colorimetry meth- od (ADVIA 1800 Auto Analyzer; Siemens Medical Solutions, Malvern, PA, USA). Serum insulin concentrations were mea- sured with a radioimmunoassay (SR-300; Stratec, Birkenfeld, Germany). Glycosylated hemoglobin concentrations were as- sessed using high-performance liquid chromatography (Vari- ant II TURBO; Bio-Rad, Berkeley, CA, USA) according to the National Glycohemoglobin Standardization Program guide- lines. IR was evaluated using the homeostasis model assess- ment of IR (HOMA-IR) and was calculated as follows: fasting plasma glucose (mg/dL)×fasting plasma insulin (mIU/mL)/
405 [19]. Increased IR was defined as ranking in the top 25th percentile of HOMA-IR values separately for men (≥2.711), premenopausal women (≥2.148), and postmenopausal wom- en (≥2.318) [20]. Pre-diabetes was defined as a fasting glucose level of 100 to 126 mg/dL or a glycosylated hemoglobin level of 5.7 to 6.5% according to the American Diabetes Association criteria [21]. Total cholesterol, high-density lipoprotein choles- terol, low-density lipoprotein cholesterol, and triglyceride lev- els were measured using enzymatic methods (ADVIA 1800 Auto Analyzer). Dyslipidemia was defined as a total cholester- ol level ≥240 mg/dL, or a high-density lipoprotein cholesterol level ≤40 mg/dL, or a low-density lipoprotein cholesterol level
≥160 mg/dL, or a triglycerides level ≥200 mg/dL according to the Expert Panel on Detection, Evaluation, and Treatment of High Blood Cholesterol in Adults or as people who were tak- ing lipid-lowering medication. C-reactive protein concentra- tions were determined with a turbidimetric immunoassay (ADVIA 1800 Auto Analyzer).
TMA and visceral fat area were measured by QCT using a Somatom Definition AS+ 128-channel CT (Siemens Health- care, Forchheim, Germany), a Somatom sensation 64-channel CT (Siemens Healthcare), or a GE Lightspeed VCT scanner (General Electric Medical System, Milwaukee, WI, USA).
Scanning was performed at 120 kVp and 150 mAs and a pitch of 1.0. Images were reconstructed with a 3-mm slice thickness.
Voxels were separated into fat and muscle tissue according to Hounsfield units (HU): –190 to –30 HU for fat and 30 to 100
HU for muscle. All scanned data were analyzed using Aquarius intuition Viewer version 4.4.12 software (Terarecon, Foster City, CA, USA). TMA was recorded as the mean of right and left TMA values. TMA was found to be correlated with body size (r=0.566 in men, r=0.491 in premenopausal women, and r=0.463 in postmenopausal women), indicating that partici- pants with a larger body size may have larger TMA. Therefore, TMA was corrected by body weight (TMA/Wt, cm2/kg) [22].
The participants were divided into three groups according to sex and menopausal-specific TMA/Wt tertiles: <338.9, 338.9–
377.7, and ≥377.8 for men; <276.5, 276.5–309.1, and ≥309.2 for premenopausal women; and <261.0, 261.0–292.4, and
≥292.5 for postmenopausal women.
Statistical analysis
We evaluated differences in demographic characteristics among the three groups based on the TMA/Wt tertiles, and we used one-way analysis of variance for normally distributed variables, Kruskal-Wallis test for skewed variables, and chi- square test for categorical variables. The P for trend was calcu- lated using a contrast to test for linear trends in continuous variables and the Cochran-Armitage test for categorical vari- ables.
Multivariable logistic regression analyses were used to assess independent associations between TMA/Wt (using tertiles and continuous variables) and the likelihood of an increased IR in three adjusted models: [1] adjusted for age; [2] additionally ad- justed for systolic blood pressure, triglyceride level, smoking, alcohol intake, exercise, and sleep duration; and [3] additional- ly adjusted for visceral fat area. We conducted the above-men- tioned analyses separately for men, premenopausal, and post- menopausal women, because there were significant interac- tions between sex and TMA/Wt (P for interaction=0.028) and a borderline interaction between menopausal status and TMA/Wt (P for interaction=0.065) in the presence of an in- creased IR and because both TMA/Wt and HOMA-IR signifi- cantly differed according to sex and menopausal status in women (Supplementary Table 1).
The associations between TMA/Wt (using tertiles and con- tinuous variables) and the likelihood of an increased IR were also assessed in people with lower (<25.0 kg/m2) and higher BMIs (≥25.0 kg/m2) using the same models. Then, we also an- alyzed interactions between TMA/Wt tertiles and BMI catego- ries for the presence of an increased IR in men and in pre- menopausal and postmenopausal women. All statistical tests
were performed using SAS version 9.4 (SAS Institute, Cary, NC, USA). Statistical significance was defined as a two-sided P value <0.05.
RESULTS
The general characteristics of the study participants are pre- sented in Supplementary Table 1. This study included 1,263 men, 788 premenopausal women, and 1,476 postmenopausal women, with mean ages of 49.8, 43.0, and 57.1 years, respec- tively. Both mean TMA/Wt and median HOMA-IR values were significantly higher in men than in women. Mean TMA/
Wt was significantly higher in premenopausal than in post- menopausal women. Conversely, the median HOMA-IR was significantly higher in postmenopausal than in premenopausal women.
Table 1 shows the general characteristics of the men accord- ing to TMA/Wt tertiles. Men in the lower TMA/Wt tertiles tended to have higher obesity indices, blood pressure, triglyc- erides, and HOMA-IR values; higher frequencies of former smokers; and higher frequencies of hypertension, pre-diabetes mellitus, and dyslipidemia. Tables 2 and 3 show the general characteristics of the premenopausal and postmenopausal women, respectively, according to TMA/Wt tertiles. Both pre- menopausal and postmenopausal women in the lower TMA/
Wt tertiles tended to have higher obesity indices, blood pres- sure, lipid profile, HOMA-IR, C-reactive, and protein levels;
higher frequencies of hypertension; and lower frequencies of regular exercise. Postmenopausal women in the lower TMA/
Wt tertiles tended to have higher frequencies of pre-diabetes mellitus and dyslipidemia and lower frequencies of current heavy drinking, unlike premenopausal women.
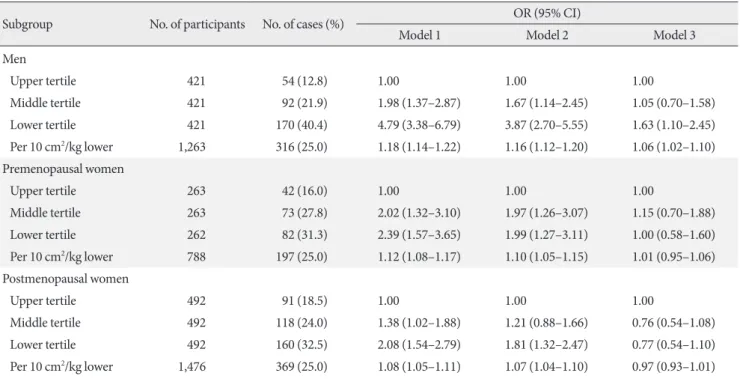
Table 4 presents the results of the multivariable logistic re- gression models for the associations between TMA/Wt (as ter- tiles and continuous variables) and increased IR in men, pre- menopausal, and postmenopausal women. In men, even after adjustment for potential confounders, including visceral fat area, the presence of an increased IR was significantly higher in the lower TMA/Wt tertile (odds ratio [OR], 1.63; 95% confi- dence interval [CI], 1.10 to 2.45), but was not significant in the middle tertile (OR, 1.05; 95% CI, 0.70 to 1.58), relative to the upper tertile. In this model, which included TMA/Wt as a con- tinuous variable, the multivariable-adjusted OR increased by 1.06 (95% CI, 1.02 to 1.10) per 10 cm2/kg lower TMA/Wt.
However, in both premenopausal and postmenopausal wom-
en, an association between TMA/Wt and increased IR was not observed after additionally adjustment for visceral fat area. We also repeated the analysis using fasting glucose and fasting in- sulin levels as dependent variables instead of HOMA-IR and observed similar results (data not shown).
Table 5 presents the associations between TMA/Wt and in- creased IR according to the BMI categories in men. Among men with lower BMIs, the presence of an increased IR had higher, but non-significant, ORs in the lower and middle TMA/Wt tertiles. However, among men with higher BMIs, the presence of an increased IR showed significantly higher ORs in the lower TMA/Wt tertiles than in the upper TMA/Wt tertile.
There was a significant interaction between the TMA/Wt ter- tiles and BMI categories in the presence of an increased IR in men (P for interaction=0.046).
Conversely, there were no significant associations between TMA/Wt and increased IR, regardless of BMI category, in pre- menopausal and postmenopausal women. Also, there were no significant interactions between TMA/Wt tertiles and BMI categories in the presence of an increased IR in premenopausal (P for interaction=0.093) or postmenopausal (P for interac- tion=0.853) women (Supplementary Table 2).
DISCUSSION
The current study found that a lower thigh muscle was inde- pendently associated with a higher IR, even after adjustment for traditional risk factors, in a cohort of middle-aged Korean men with higher BMIs, but not in men with lower BMIs. This trend was not observed in premenopausal and postmenopaus- al women, regardless of the BMI category.
Associations between muscle mass and IR have been report- ed in animal [23] and human studies [1,2,11,24-27], including a gene analysis [28]. One of these results is consistent [24] with ours, and one is inconsistent [25]. Some studies are incompa- rable [2,11,26,27] because they did not stratify by the obesity status. One study [24] reported that people with a lower mus- cle mass and higher BMIs had significantly higher ORs for IR, particularly in a middle-aged population. Another study [25]
suggested that people with a lower muscle mass and lower BMIs had a significantly higher OR for IR. This inconsistent results might be due to not adjusting for central obesity, which could be highly correlated with the IR, particularly in the low- er-BMI population [29]. Other studies [2,11,26,27] had similar results with ours; however, comparison is difficult because a
stratified analysis according to sex and obesity status was not performed in those studies. Although two of them [26,27]
conducted a longitudinal analysis between low muscle mass
and higher IR it might be hard to identify an independent ef- fect of the low muscle because it was not adjusted by the body size. Except for one study [26], most previous studies used an Table 1. Characteristics in men (n=1,263) according to TMA/Wt tertiles
Variable TMA/Wt tertiles P for
difference P for trend Lower (<338.9 cm2/kg) Middle (338.9–377.7 cm2/kg) Upper (≥377.8 cm2/kg)
Age, yr 50.3±10.6 50.7±10.1 48.3±10.1 0.002 0.167
BMI, kg/m2 26.3±3.2 24.6±2.4 23.8±2.3 <0.001 <0.001
Waist circumference, cm 91.6±8.0 86.6±5.9 82.3±6.3 <0.001 <0.001
Visceral fat area, cm2 143.6±48.9 118.7±40.8 88.9±36.3 <0.001 <0.001
SBP, mm Hg 128.0±13.5 124.7±13.7 123.0±13.2 <0.001 <0.001
DBP, mm Hg 83.1±10.2 80.5±9.7 79.2±9.7 <0.001 <0.001
Total cholesterol, mg/dL 197.1±35.2 199.9±35.8 196.7±30.9 0.333 0.597
HDL-C, mg/dL 48.9±12.2 50.7±11.7 54.4±12.8 <0.001 <0.001
LDL-C, mg/dL 122.3±32.8 123.9±34.3 120.9±28.1 0.427 0.938
Triglycerides, mg/dL 141.0 (104.0–209.0) 136.0 (97.0–194.0) 117.0 (80.0–163.0) <0.001 <0.001 Fasting glucose, mg/dL 92.0 (86.0–102.0) 91.0 (84.0–99.0) 89.0 (83.0–94.0) <0.001 <0.001 Fasting insulin, uIU/mL 10.3 (7.8–13.7) 8.7 (6.8–10.9) 7.5 (6.0–9.8) <0.001 <0.001
HbA1c, % 5.6 (5.4–5.9) 5.5 (5.3–5.8) 5.4 (5.2–5.6) <0.001 <0.001
HOMA-IR 2.39 (1.74–3.35) 2.00 (1.52–2.58) 1.64 (1.30–2.20) <0.001 <0.001
Increased IR, % 170 (40.4) 92 (21.9) 54 (12.8) <0.001 <0.001
C-reactive protein, mg/L 0.9 (0.5–1.9) 0.7 (0.4–1.3) 0.5 (0.3–1.1) 0.068 0.163
Hypertension 188 (44.7) 132 (31.4) 110 (26.1) <0.001 <0.001
Pre-diabetes mellitus 181 (43.0) 166 (39.4) 111 (26.4) <0.001 <0.001
Dyslipidemia 232 (55.1) 222 (52.7) 155 (36.8) <0.001 <0.001
Antihypertensive medication 97 (23.0) 66 (15.7) 42 (10.0) <0.001 <0.001
Lipid-lowering medication 40 (9.5) 36 (8.6) 23 (5.5) 0.075 0.029
Smoking status 0.042 0.827
Non-smoker 93 (22.1) 84 (19.9) 115 (27.3)
Former smoker 197 (46.8) 180 (42.8) 172 (40.9)
Current smoker 131 (31.1) 157 (37.3) 134 (31.8)
Alcohol intake 0.409 0.231
Non-drinker 35 (8.3) 24 (5.7) 40 (9.5)
Former drinker 21 (5.0) 25 (5.9) 27 (6.4)
Current non-heavy drinker 200 (47.5) 208 (49.4) 186 (44.2)
Current heavy drinker 165 (39.2) 164 (39.0) 168 (39.9)
Regular exercise 270 (64.1) 267 (63.4) 295 (70.1) 0.082 0.063
Sleep duration, hr/day 6.9±1.2 6.8±1.2 7.0±1.1 0.096 0.601
Values are presented as mean±standard deviation, median (interquartile range), or number (%). P values were derived using the independent t- test, Wilcoxon rank sum test, or chi-square test.
TMA, thigh muscle area; Wt, weight; BMI, body mass index; SBP, systolic blood pressure; DBP, diastolic blood pressure; HDL-C, high-density lipoprotein cholesterol; LDL-C, low-density lipoprotein cholesterol; HbA1c, glycosylated hemoglobin; HOMA-IR, homeostasis model assess- ment of insulin resistance; IR, insulin resistance.
estimated muscle mass, instead of a measured muscle area.
Unlike previous studies, we measured TMA using QCT in a large general population and excluded the potential effect of an-
tidiabetic treatment on the association between thigh muscle and IR, excluding the patients who were taking antidiabetic medications. We also tried to control for confounders not only Table 2. Characteristics in premenopausal women (n=788) according to TMA/Wt tertiles
Variable TMA/Wt tertiles P for
difference P for trend Lower (<276.5 cm2/kg) Middle (276.5–309.1 cm2/kg) Upper (≥309.2 cm2/kg)
Age, yr 43.6±6.9 43.3±6.9 42.0±7.0 0.019 0.056
BMI, kg/m2 24.4±3.2 22.9±2.6 21.6±2.0 <0.001 <0.001
Waist circumference, cm 80.3±8.1 76.3±6.3 72.3±5.9 <0.001 <0.001
Visceral fat area, cm2 84.20±32.70 75.80±30.70 58.10±25.6 <0.001 <0.001
SBP, mm Hg 113.5±12.7 110.7±12.6 108.6±11.7 <0.001 0.001
DBP, mm Hg 73.8±9.5 72.2±9.0 71.1±8.5 0.001 0.002
Total cholesterol, mg/dL 195.6±32.2 191.1±30.6 188.9±33.8 0.051 0.021
HDL-C, mg/dL 60.8±14.1 61.4±13.9 64.4±15.4 0.011 0.054
LDL-C, mg/dL 117.8±31.2 113.7±27.1 108.2±29.8 0.002 0.004
Triglycerides, mg/dL 93.5 (73.0–123.0) 85.0 (65.0–110.0) 79.0 (59.0–107.0) <0.001 0.004
Fasting glucose, mg/dL 85.0 (80.0–90.0) 86.0 (80.0–91.0) 83.0 (79.0–89.0) 0.002 0.696
Fasting insulin, uIU/mL 8.3 (7.0–10.7) 7.9 (6.6–9.8) 7.1 (6.0–8.8) <0.001 0.002
HbA1c, % 5.4 (5.2–5.6) 5.4 (5.2–5.6) 5.4 (5.2–5.5) 0.622 0.691
HOMA-IR 1.75 (1.43–2.34) 1.69 (1.36–2.21) 1.49 (1.24–1.88) <0.001 0.009
Increased IR, % 82 (31.3) 73 (27.8) 42 (16.0) <0.001 <0.001
C-reactive protein, mg/L 0.6 (0.4–1.3) 0.5 (0.3–1.1) 0.3 (0.2–0.6) <0.001 0.021
Hypertension 33 (12.6) 22 (8.4) 19 (7.2) 0.085 0.035
Pre-diabetes mellitus 55 (21.0) 57 (21.7) 45 (17.1) 0.369 0.265
Dyslipidemia 47 (17.9) 52 (19.8) 45 (17.1) 0.721 0.805
Antihypertensive medication 14 (5.3) 6 (2.3) 8 (3.0) 0.143 0.155
Lipid-lowering medication 3 (1.2) 7 (2.7) 6 (2.3) 0.439 0.357
Smoking status 0.787 0.537
Non-smoker 237 (90.5) 238 (90.5) 230 (87.5)
Former smoker 14 (5.3) 14 (5.3) 19 (7.2)
Current smoker 11 (4.2) 11 (4.2) 14 (5.3)
Alcohol intake 0.022 0.227
Non-drinker 50 (27.0) 62 (23.0) 60 (18.0)
Former drinker 2 (1.1) 17 (6.3) 14 (4.2)
Current non-heavy drinker 112 (60.5) 163(60.4) 209 (62.8)
Current heavy drinker 21 (11.4) 28 (10.4) 50 (15.0)
Regular exercise 143 (54.6) 155 (58.9) 177 (67.3) 0.011 0.003
Sleep duration, hr/day 6.9±1.3 7.0±1.2 7.0±1.2 0.712 0.421
Values are presented as mean±standard deviation, median (interquartile range), or number (%). P values were derived using the independent t- test, Wilcoxon rank sum test, or chi-square test.
TMA, thigh muscle area; Wt, weight; BMI, body mass index; SBP, systolic blood pressure; DBP, diastolic blood pressure; HDL-C, high-density lipoprotein cholesterol; LDL-C, low-density lipoprotein cholesterol; HbA1c, glycosylated hemoglobin; HOMA-IR, homeostasis model assess- ment of insulin resistance; IR, insulin resistance.
by adjusting for risk factors, including central obesity, but also by stratifying by sex, menopausal status, and overall obesity status.
The underlying mechanisms of the association between low
muscle mass and higher IR are not fully understood. One of the potential explanations is that muscle tissue is the primary tissue responsible for insulin-mediated glucose disposal; hence, Table 3. Characteristics in postmenopausal women (n=1,476) according to TMA/Wt tertiles
Variable TMA/Wt tertiles P for
difference P for trend Lower (<261.0 cm2/kg) Middle (261.0–292.4 cm2/kg) Upper (≥292.5 cm2/kg)
Age, yr 57.6±3.9 57.0±3.9 56.7±4.4 0.001 <0.001
BMI, kg/m2 25.3±3.1 23.5±2.4 22.4±2.0 <0.001 <0.001
Waist circumference, cm 83.3±8.2 79.3±6.8 75.1±6.1 <0.001 <0.001
Visceral fat area, cm2 115.90±40.40 99.30±36.30 79.90±30.90 <0.001 <0.001
SBP, mm Hg 119.9±14.9 117.7±14.8 114.8±13.2 <0.001 <0.001
DBP, mm Hg 76.1±9.0 75.0±9.1 73.2±8.3 <0.001 <0.001
Total cholesterol, mg/dL 209.1±36.0 208.8±35.8 203.8±33.2 0.031 0.155
HDL-C, mg/dL 59.3±13.6 59.4±13.6 62.2±15.0 0.001 0.056
LDL-C, mg/dL 128.0±32.0 125.7±33.1 121.2±31.3 0.028 0.019
Triglycerides, mg/dL 116.5 (86.0–150.0) 108.0 (84.0–143.0) 98.0 (72.0–137.5) <0.001 0.022 Fasting glucose, mg/dL 89.0 (84.0–95.5) 88.0 (82.0–94.0) 87.0 (82.0–93.0) <0.001 <0.001
Fasting insulin, uIU/mL 8.6 (7.0–11.0) 8.0 (6.4–10.3) 7.5 (5.8–9.5) <0.001 <0.001
HbA1c, % 5.7 (5.4–6.0) 5.6 (5.4–5.9) 5.6 (5.4–5.8) 0.008 <0.001
HOMA-IR 1.89 (1.50–2.59) 1.74 (1.35–2.29) 1.58 (1.25–2.12) <0.001 <0.001
Increased IR, % 160 (32.5) 118 (24.0) 91 (18.5) <0.001 <0.001
C-reactive protein, mg/L 0.8 (0.4–1.7) 0.6 (0.4–1.1) 0.5 (0.3–0.9) <0.001 0.011
Hypertension 159 (32.3) 131 (26.6) 105 (21.3) <0.001 <0.001
Pre-diabetes mellitus 238 (48.4) 199 (40.5) 214 (43.5) 0.041 0.123
Dyslipidemia 254 (51.6) 233 (47.4) 195 (39.6) <0.001 <0.001
Antihypertensive medication 115 (23.4) 83 (16.9) 84 (17.1) 0.013 0.012
Lipid-lowering medication 88 (17.9) 79 (16.1) 80 (16.3) 0.701 0.495
Smoking status 0.511 0.599
Non-smoker 469 (95.3) 476 (96.8) 471 (95.7)
Former smoker 15 (3.1) 12 (2.4) 11 (2.2)
Current smoker 8 (1.6) 4 (0.8) 10 (2.0)
Alcohol intake 0.002 0.012
Non-drinker 205 (36.0) 174 (35.9) 121 (28.7)
Former drinker 17 (3.0) 19 (3.9) 9 (2.1)
Current non-heavy drinker 317 (55.7) 272 (56.1) 251 (59.5)
Current heavy drinker 30 (2.3) 20 (4.1) 41 (9.7)
Regular exercise 326 (66.3) 332 (67.5) 355 (72.2) 0.109 0.046
Sleep duration, hr/day 6.8±1.2 6.8±1.2 6.8±1.3 0.802 0.507
Values are presented as mean±standard deviation, median (interquartile range), or number (%). P values were derived using the independent t- test, Wilcoxon rank sum test, or chi-square test.
TMA, thigh muscle area; Wt, weight; BMI, body mass index; SBP, systolic blood pressure; DBP, diastolic blood pressure; HDL-C, high-density lipoprotein cholesterol; LDL-C, low-density lipoprotein cholesterol; HbA1c, glycosylated hemoglobin; HOMA-IR, homeostasis model assess- ment of insulin resistance; IR, insulin resistance.
Table 4. Association between TMA/Wt and increased IR in men and premenopausal and postmenopausal women
Subgroup No. of participants No. of cases (%) OR (95% CI)
Model 1 Model 2 Model 3
Men
Upper tertile 421 54 (12.8) 1.00 1.00 1.00
Middle tertile 421 92 (21.9) 1.98 (1.37–2.87) 1.67 (1.14–2.45) 1.05 (0.70–1.58)
Lower tertile 421 170 (40.4) 4.79 (3.38–6.79) 3.87 (2.70–5.55) 1.63 (1.10–2.45)
Per 10 cm2/kg lower 1,263 316 (25.0) 1.18 (1.14–1.22) 1.16 (1.12–1.20) 1.06 (1.02–1.10) Premenopausal women
Upper tertile 263 42 (16.0) 1.00 1.00 1.00
Middle tertile 263 73 (27.8) 2.02 (1.32–3.10) 1.97 (1.26–3.07) 1.15 (0.70–1.88)
Lower tertile 262 82 (31.3) 2.39 (1.57–3.65) 1.99 (1.27–3.11) 1.00 (0.58–1.60)
Per 10 cm2/kg lower 788 197 (25.0) 1.12 (1.08–1.17) 1.10 (1.05–1.15) 1.01 (0.95–1.06) Postmenopausal women
Upper tertile 492 91 (18.5) 1.00 1.00 1.00
Middle tertile 492 118 (24.0) 1.38 (1.02–1.88) 1.21 (0.88–1.66) 0.76 (0.54–1.08)
Lower tertile 492 160 (32.5) 2.08 (1.54–2.79) 1.81 (1.32–2.47) 0.77 (0.54–1.10)
Per 10 cm2/kg lower 1,476 369 (25.0) 1.08 (1.05–1.11) 1.07 (1.04–1.10) 0.97 (0.93–1.01) Model 1, adjusted for age; Model 2, adjusted for variables in Model 1 plus systolic blood pressure, triglyceride level, smoking, alcohol intake, reg- ular exercise, and sleep duration; Model 3, adjusted for variables in Model 2 plus visceral fat.
TMA, thigh muscle area; Wt, weight; IR, insulin resistance; OR, odds ratio; CI, confidence interval.
Table 5. Association between TMA/Wt and increased IR according to BMI categorization in men
BMI No. of participants No. (%) of cases OR (95% CI)
Model 1 Model 2 Model 3
BMI <25 kg/m2
Upper tertile 227 12 (5.3) 1.00 1.00 1.00
Middle tertile 228 32 (14.0) 2.93 (1.46–5.85) 2.58 (1.26–5.28) 1.84 (0.88–3.84)
Lower tertile 227 36 (15.9) 3.38 (1.70–6.70) 3.15 (1.57–6.34) 1.59 (0.75–3.40)
Per 10 cm2/kg lower 682 80 (11.7) 1.10 (1.04–1.17) 1.10 (1.03–1.16) 1.02 (0.95–1.09) BMI ≥25 kg/m2
Upper tertile 194 52 (26.8) 1.00 1.00 1.00
Middle tertile 194 71 (36.6) 1.59 (1.03–2.45) 1.54 (0.98–2.43) 1.08 (0.66–1.74)
Lower tertile 193 113 (58.6) 3.89 (2.53–5.97) 3.73 (2.39–5.85) 2.31 (1.42–3.74)
Per 10 cm2/kg lower 581 236 (40.6) 1.16 (1.11–1.21) 1.15 (1.10–1.20) 1.09 (1.03–1.15) Model 1, adjusted for age; Model 2: adjusted for variables in Model 1 plus systolic blood pressure, triglyceride level, smoking, alcohol intake, reg- ular exercise, and sleep duration; Model 3, adjusted for variables in Model 2 plus visceral fat.
TMA, thigh muscle area; Wt, weight; IR, insulin resistance; BMI, body mass index; OR, odds ratio; CI, confidence interval.
a low muscle mass could cause a decreased insulin-mediated glucose disposal, followed by higher IR. Another explanation could be in lifestyle factors, including smoking, alcohol intake, and physical activity. In the present study, after adjusting for
these lifestyle factors, ORs were slightly weakened, but still re- mained significant in men. This suggested that lifestyle factors might partially, but not fully, explain the association between low muscle mass and higher IR. In the current study, according
to stratification analyses by BMI categories, a significant in- verse association was only observed in men with higher BMIs.
Interestingly, while age-related muscle loss has been shown to be due to a reduction in muscle fibers and fiber atrophy [30], participants with obesity [31-33], particularly men [34], also have increased ceramides in their muscle fibers, as well as few- er muscle fibers, which plays an important role in IR.
In women, regardless of menopausal status, the significant association disappeared after adjusting for the visceral fat area.
This finding could suggest that the differences in body compo- sition between men and women may modify the relationship between muscle and IR. First, age-related decreases in skeletal muscle mass and muscle strength are inevitable in both men and women; however, they are more prominent in men than in women [12]. This could be affected by the sex-specific effects of sex hormones. In men, testosterone levels generally control changes in skeletal muscle mass, and in women, there is much less of an absolute decline in testosterone levels with aging than that in men. Thus, women may not experience the effects of testosterone decline on skeletal muscle mass. Additionally, fe- male sex hormones, especially estrogen, have been found to provide protective effects on adipocyte inflammation, oxida- tive stress, and IR in an animal study [35]. Second, fat distribu- tions are different between men and women. Adipose tissue primarily accumulates around the trunk and abdomen in men, but around the hips and thighs in women [36,37]. According to previous studies, although the absolute amount of visceral fat area is higher in men than in women, the risk of visceral fat area on cardiometabolic abnormalities is higher in women than in men [38]. A possible reason for this is that the thigh muscle might have a relatively smaller impact on the IR in women than in men [39], due to the preexisting risk of fat on metabolic imbalance [40]. In this regard, women would likely be less affected by muscle declines than men.
After stratification according to menopausal status, lower thigh muscle tended to be associated with higher IR in pre- menopausal women, whereas higher thigh muscle was tended to be associated with higher IR in postmenopausal women.
Nevertheless, both of these trends were not significant. Instead of thigh muscle mass, age and visceral fat area were significant- ly associated with increased IR in premenopausal women, while blood pressure, triglycerides, and visceral fat area were significantly associated with increased IR in postmenopausal women (Supplementary Table 3). Several previous studies [41- 43] have reported that postmenopausal women have greater
abdominal fat, higher blood pressure, higher lipid profiles than premenopausal women even after adjustment for age, and these risk factors could have great harmful impact on higher IR than protective effect of greater muscle mass. Further stud- ies are needed to confirm which ways associations differ be- tween premenopausal and postmenopausal women, as well as between men and women.
The current study had a few limitations. First, TMA was measured using QCT, but more detailed characteristics such as thigh intramuscular or intermuscular fat content were not measured. Previous research has indicated that there are sex differences in mid-thigh composition, such as muscle density, which is a marker of muscle fat infiltration [44,45]. Although fat infiltration in a muscle accounts for a relatively small por- tion of the muscle, not considering muscle fat infiltration may not represent the muscles of women well. Second, we used HOMA-IR as a surrogate marker for IR. However, it is fre- quently used for assessing IR in large population-based stud- ies, because it takes minimal time, is not invasive, and shows excellent predictability for IR [46]. Third, both the thigh mus- cle and IR were measured only once; therefore, we cannot ex- clude the possibility of random measurement errors that might have weakened the observed association. Fourth, we might not have completely accounted for all residual confounders. Final- ly, this study was cross-sectional in nature; therefore, a causal association between low thigh muscle mass and higher IR is uncertain.
In conclusion, we found an association between lower thigh muscle mass and higher IR in men, particularly those with higher BMIs, but not in those with lower BMIs, even after ad- justing for traditional risk factors. Our findings suggest that the maintenance of both an appropriate BMI and thigh muscle is important for normal IR in middle-aged Korean men.
SUPPLEMENTARY MATERIALS
Supplementary materials related to this article can be found online at https://doi.org/10.4093/dmj.2019.0110.
CONFLICTS OF INTEREST
No potential conflict of interest relevant to this article was re- ported.
AUTHOR CONTRIBUTIONS
Conception or design: J.E.H., H.C.K.
Acquisition, analysis, or interpretation of data: J.E.H., J.S.S., H.C.K.
Drafting the work or revising: J.E.H., H.L., H.C.K.
Final approval of the manuscript: J.E.H., J.S.S., H.L., H.C.K.
ORCID
Ji Eun Heo https://orcid.org/0000-0001-6449-5856 Hyeon Chang Kim https://orcid.org/0000-0001-7867-1240
ACKNOWLEDGMENTS
This work was supported by the Korea Health Technology R&D Project (grant number: HI13C0715) funded by the Min- istry of Health and Welfare of the Republic of Korea.
REFERENCES
1. Eastwood SV, Tillin T, Wright A, Mayet J, Godsland I, Forouhi NG, Whincup P, Hughes AD, Chaturvedi N. Thigh fat and muscle each contribute to excess cardiometabolic risk in South Asians, independent of visceral adipose tissue. Obesity (Silver Spring) 2014;22:2071-9.
2. Moon SS. Low skeletal muscle mass is associated with insulin resistance, diabetes, and metabolic syndrome in the Korean population: the Korea National Health and Nutrition Examina- tion Survey (KNHANES) 2009-2010. Endocr J 2014;61:61-70.
3. Heo JE, Shim JS, Song BM, Bae HY, Lee HJ, Lee E, Kim HC.
Association between appendicular skeletal muscle mass and depressive symptoms: review of the cardiovascular and meta- bolic diseases etiology research center cohort. J Affect Disord 2018;238:8-15.
4. Lee SW, Youm Y, Lee WJ, Choi W, Chu SH, Park YR, Kim HC.
Appendicular skeletal muscle mass and insulin resistance in an elderly Korean population: the Korean social life, health and aging project-health examination cohort. Diabetes Metab J 2015;39:37-45.
5. Hirasawa Y, Matsuki R, Ebisu T, Kurose T, Hamamoto Y, Seino Y. Evaluation of skeletal muscle mass indices, assessed by bio- electrical impedance, as indicators of insulin resistance in pa- tients with type 2 diabetes. J Phys Ther Sci 2019;31:190-4.
6. Wells CE, Polkey MI, Baker EH. Insulin resistance is associated
with skeletal muscle weakness in COPD. Respirology 2016;21:
689-96.
7. Wang HL, Ding TT, Lu S, Xu Y, Tian J, Hu WF, Zhang JY. Mus- cle mass loss and intermuscular lipid accumulation were asso- ciated with insulin resistance in patients receiving hemodialy- sis. Chin Med J (Engl) 2013;126:4612-7.
8. Lee J, Hong YP, Shin HJ, Lee W. Associations of sarcopenia and sarcopenic obesity with metabolic syndrome considering both muscle mass and muscle strength. J Prev Med Public Health 2016;49:35-44.
9. Poehlman ET, Dvorak RV, DeNino WF, Brochu M, Ades PA.
Effects of resistance training and endurance training on insulin sensitivity in nonobese, young women: a controlled random- ized trial. J Clin Endocrinol Metab 2000;85:2463-8.
10. Grontved A, Ried-Larsen M, Ekelund U, Froberg K, Brage S, Andersen LB. Independent and combined association of mus- cle strength and cardiorespiratory fitness in youth with insulin resistance and β-cell function in young adulthood: the Europe- an Youth Heart Study. Diabetes Care 2013;36:2575-81.
11. Srikanthan P, Karlamangla AS. Relative muscle mass is inverse- ly associated with insulin resistance and prediabetes: findings from the third National Health and Nutrition Examination Survey. J Clin Endocrinol Metab 2011;96:2898-903.
12. Kim KM, Jang HC, Lim S. Differences among skeletal muscle mass indices derived from height-, weight-, and body mass in- dex-adjusted models in assessing sarcopenia. Korean J Intern Med 2016;31:643-50.
13. Dmitruk A, Czeczelewski J, Czeczelewska E, Golach J, Parnicka U. Body composition and fatty tissue distribution in women with various menstrual status. Rocz Panstw Zakl Hig 2018;69:
95-101.
14. Moon HU, Ha KH, Han SJ, Kim HJ, Kim DJ. The association of adiponectin and visceral fat with insulin resistance and β-cell dysfunction. J Korean Med Sci 2018;34:e7.
15. Cheng YH, Tsao YC, Tzeng IS, Chuang HH, Li WC, Tung TH, Chen JY. Body mass index and waist circumference are better predictors of insulin resistance than total body fat percentage in middle-aged and elderly Taiwanese. Medicine (Baltimore) 2017;96:e8126.
16. Peplies J, Bornhorst C, Gunther K, Fraterman A, Russo P, Veidebaum T, Tornaritis M, De Henauw S, Marild S, Molnar D, Moreno LA, Ahrens W; IDEFICS consortium. Longitudinal associations of lifestyle factors and weight status with insulin resistance (HOMA-IR) in preadolescent children: the large prospective cohort study IDEFICS. Int J Behav Nutr Phys Act
2016;13:97.
17. Shim JS, Song BM, Lee JH, Lee SW, Park JH, Choi DP, Lee MH, Ha KH, Kim DJ, Park S, Lee WW, Kim HC. Cardiovascular and Metabolic Diseases Etiology Research Center (CMERC) cohort: study protocol and results of the first 3 years of enroll- ment. Epidemiol Health 2017;39:e2017016.
18. Park JT, Kim BG, Jhun HJ. Alcohol consumption and the CAGE questionnaire in Korean adults: results from the Second Korea National Health and Nutrition Examination Survey. J Korean Med Sci 2008;23:199-206.
19. Matthews DR, Hosker JP, Rudenski AS, Naylor BA, Treacher DF, Turner RC. Homeostasis model assessment: insulin resis- tance and beta-cell function from fasting plasma glucose and insulin concentrations in man. Diabetologia 1985;28:412-9.
20. Yun KJ, Han K, Kim MK, Park YM, Baek KH, Song KH, Kwon HS. Insulin resistance distribution and cut-off value in Koreans from the 2008-2010 Korean National Health and Nutrition Ex- amination Survey. PLoS One 2016;11:e0154593.
21. American Diabetes Association. Diagnosis and classification of diabetes mellitus. Diabetes Care 2012;35 Suppl 1(Suppl 1):S64- 71.
22. Ochi M, Tabara Y, Kido T, Uetani E, Ochi N, Igase M, Miki T, Kohara K. Quadriceps sarcopenia and visceral obesity are risk factors for postural instability in the middle-aged to elderly population. Geriatr Gerontol Int 2010;10:233-43.
23. Huang L, Tepaamorndech S, Kirschke CP, Newman JW, Keyes WR, Pedersen TL, Dumnil J. Aberrant fatty acid metabolism in skeletal muscle contributes to insulin resistance in zinc trans- porter 7 (znt7)-knockout mice. J Biol Chem 2018;293:7549-63.
24. Srikanthan P, Hevener AL, Karlamangla AS. Sarcopenia exac- erbates obesity-associated insulin resistance and dysglycemia:
findings from the National Health and Nutrition Examination Survey III. PLoS One 2010;5:e10805.
25. Kim J. Gender difference in association between appendicular skeletal muscle mass and cardiometabolic abnormalities in normal-weight and obese adults: Korea National Health and Nutrition Examination Survey (KNHANES) IV-3 and V-1.
Asia Pac J Public Health 2015;27:NP468-75.
26. Han SJ, Boyko EJ, Kim SK, Fujimoto WY, Kahn SE, Leonetti DL. Association of thigh muscle mass with insulin resistance and incident type 2 diabetes mellitus in Japanese Americans.
Diabetes Metab J 2018;42:488-95.
27. Aleman-Mateo H, Lopez Teros MT, Ramirez FA, Astiazaran- Garcia H. Association between insulin resistance and low rela- tive appendicular skeletal muscle mass: evidence from a cohort
study in community-dwelling older men and women partici- pants. J Gerontol A Biol Sci Med Sci 2014;69:871-7.
28. Tonks KT, Coster AC, Christopher MJ, Chaudhuri R, Xu A, Gagnon-Bartsch J, Chisholm DJ, James DE, Meikle PJ, Green- field JR, Samocha-Bonet D. Skeletal muscle and plasma lipido- mic signatures of insulin resistance and overweight/obesity in humans. Obesity (Silver Spring) 2016;24:908-16.
29. Fu X, Zhu F, Zhao X, Ma X, Zhu S. Central fat accumulation associated with metabolic risks beyond total fat in normal BMI Chinese adults. Ann Nutr Metab 2014;64:93-100.
30. Gueugneau M, Coudy-Gandilhon C, Theron L, Meunier B, Barboiron C, Combaret L, Taillandier D, Polge C, Attaix D, Picard B, Verney J, Roche F, Feasson L, Barthelemy JC, Bechet D. Skeletal muscle lipid content and oxidative activity in rela- tion to muscle fiber type in aging and metabolic syndrome. J Gerontol A Biol Sci Med Sci 2015;70:566-76.
31. Adams JM 2nd, Pratipanawatr T, Berria R, Wang E, DeFronzo RA, Sullards MC, Mandarino LJ. Ceramide content is in- creased in skeletal muscle from obese insulin-resistant hu- mans. Diabetes 2004;53:25-31.
32. Boden G. Ceramide: a contributor to insulin resistance or an innocent bystander? Diabetologia 2008;51:1095-6.
33. Coen PM, Dube JJ, Amati F, Stefanovic-Racic M, Ferrell RE, Toledo FG, Goodpaster BH. Insulin resistance is associated with higher intramyocellular triglycerides in type I but not type II myocytes concomitant with higher ceramide content. Dia- betes 2010;59:80-8.
34. Haugaard SB, Vaag A, Hoy CE, Madsbad S. Sex and muscle structural lipids in obese subjects: an impact on insulin action?
Eur J Clin Invest 2008;38:494-501.
35. Stubbins RE, Najjar K, Holcomb VB, Hong J, Nunez NP. Oes- trogen alters adipocyte biology and protects female mice from adipocyte inflammation and insulin resistance. Diabetes Obes Metab 2012;14:58-66.
36. Bredella MA. Sex differences in body composition. Adv Exp Med Biol 2017;1043:9-27.
37. Wu CH, Yao WJ, Lu FH, Yang YC, Wu JS, Chang CJ. Sex differ- ences of body fat distribution and cardiovascular dysmetabolic factors in old age. Age Ageing 2001;30:331-6.
38. Schorr M, Dichtel LE, Gerweck AV, Valera RD, Torriani M, Miller KK, Bredella MA. Sex differences in body composition and association with cardiometabolic risk. Biol Sex Differ 2018;
9:28.
39. Larsen BA, Wassel CL, Kritchevsky SB, Strotmeyer ES, Criqui MH, Kanaya AM, Fried LF, Schwartz AV, Harris TB, Ix JH;
Health ABC Study. Association of muscle mass, area, and strength with incident diabetes in older adults: the Health ABC Study. J Clin Endocrinol Metab 2016;101:1847-55.
40. Brochu M, Starling RD, Tchernof A, Matthews DE, Garcia-Ru- bi E, Poehlman ET. Visceral adipose tissue is an independent correlate of glucose disposal in older obese postmenopausal women. J Clin Endocrinol Metab 2000;85:2378-84.
41. Toth MJ, Tchernof A, Sites CK, Poehlman ET. Menopause-re- lated changes in body fat distribution. Ann N Y Acad Sci 2000;
904:502-6.
42. Zanchetti A, Facchetti R, Cesana GC, Modena MG, Pirrelli A, Sega R; SIMONA participants. Menopause-related blood pres- sure increase and its relationship to age and body mass index:
the SIMONA epidemiological study. J Hypertens 2005;23:
2269-76.
43. Wang N, Qin MZ, Cui J. Lipid profile comparison between
pre- and post-menopausal women. Zhonghua Xin Xue Guan Bing Za Zhi 2016;44:799-804.
44. Kasai T, Ishiguro N, Matsui Y, Harada A, Takemura M, Yuki A, Kato Y, Otsuka R, Ando F, Shimokata H. Sex- and age-related differences in mid-thigh composition and muscle quality de- termined by computed tomography in middle-aged and elder- ly Japanese. Geriatr Gerontol Int 2015;15:700-6.
45. Visser M, Goodpaster BH, Kritchevsky SB, Newman AB, Nev- itt M, Rubin SM, Simonsick EM, Harris TB. Muscle mass, muscle strength, and muscle fat infiltration as predictors of in- cident mobility limitations in well-functioning older persons. J Gerontol A Biol Sci Med Sci 2005;60:324-33.
46. Ikeda Y, Suehiro T, Nakamura T, Kumon Y, Hashimoto K.
Clinical significance of the insulin resistance index as assessed by homeostasis model assessment. Endocr J 2001;48:81-6.