http://dx.doi.org/10.5369/JSST.2011.20.5.305 pISSN 1225-5475/eISSN 2093-7563
Facile Fabrication and Sensing Characteristics of TiO
2Nanosheets Using Sonication
Joon-Boo Yu1, Bong-Hwan Cho1, Sholin Zhang1, Seoung-Hun Do1, Jeong-Ok Lim3, Hyung-Gi Byun2, and Jeung-Soo Huh1,+
Abstract
This study focuses on the fabrication of TiO2nanosheets and their gas sensor application. A simple sonochemical method is employed to fabricate the TiO2nanosheets. The obtained samples were investigated by transmission electron microscope(TEM) and X-ray Diffraction(XRD). The TiO2nanosheets were coated on substrates by a dropping method followed by heat treatment. The sensor responses to volatile organic compounds(VOCs) such as toluene, benzene, ethanol and acetaldehyde were studied. It was found that the TiO2nanosheets sensors are able to detect ppb-levels of VOC gases.
Keywords : TiO2Nanosheets, Sonication, Gas Sensors, VOCs
1. INTRODUCTION
Gases that are harmful indoors like VOCs(Volatile Organic Compound) gases have recently become strictly regulated. These VOC gases are easily transformed from a liquid to vapor phase. They can cause enormous damage to the environment and eco-system, this danger necessitates the development of VOC gas sensors. New house syndrome and new car syndrome are examples of this danger in our daily life. In order to meet this need for safety, metal oxide semiconductor sensors, based on materials like SnO2[1], ZnO[2], TiO2[3], are being developed to produce low cost portable sensors.
Various nanostructured TiO2 materials such as nanorods[4], nanowires[5], and nanotubes[3] have been studied for the detection of harmful gases. It is well recognized that sheet-like nanostructures have advantages in terms of sensing because of their high surface area[6,7].
However, TiO2nanosheets for gas sensor applications have rarely been studied due to their difficult synthesis. The most popular method to synthesize TiO2nanomaterials is a chemical processing route based on the hydrothermal treatment of raw TiO2 powder with NaOH. This method was first developed by Kasuga et al. in 1998 and is widely
used these days[8]. Recently, a sonochemical route has been successfully employed to synthesize many TiO2 nanostructured materials[9-11]. It is well known that the chemical effects of ultrasound come from the acoustic cavitation it causes. The formation, growth and implosive collapse of gas bubbles in a liquid solution produces intense local heating with temperatures up to 5000 。C, pressures of about 500 bar and very short lifetimes with cooling rates greater than 109 K/s[12, 13]. These unique conditions facilitate the synthesis of novel solid phases, which are difficult to prepare in other ways, and can stabilize the nanometer-sized clusters produced during the cavitation.
This study focuses on the fabrication of TiO2nanohseets and their gas sensor application. A simple sonochemical method is employed to fabricate TiO2 nanosheets. The obtained samples were investigated by transmission electron microscope(TEM) and X-ray Diffraction(XRD).
The gas sensing properties of the nanosheets in regard to VOC gases were also studied.
2. EXPERIMENTAL 2.1 Preparation of the TiO2nanosheets
In a typical synthesis, 0.4 g of TiO2powder(Degussa P- 25) and 120 ml of NaOH at different concentrations (5 M, 10 M, 15 M) were mixed by vigorous magnetic stirring.
The solutions were irradiated by high-intensity
1 Department of Material Science and Metallurgy, Kyungpook National University
2 Department of Information & Communication Engineering, Kangwon National University
3 Department of Biomedical Science, Kyungpook National University +Corresponding author: [email protected]
(Received : Aug. 1. 2011, Revised : Sep. 10. 2011, Accepted : Sep. 20. 2011)
ultrasound(500 W, 20 kHz) for a set time(1 hr or 3 hrs) at room atmosphere. After the irradiation, the light pink colored suspensions were washed with distilled water in a centrifuge(D.I water) to remove impurities. Then the products were mixed with 0.2 M HCl solution under ultrasonic irradiation for 1 hr. After washing again with D.I water and ethanol, the solutions were dried at 90 。C for 10 hrs and final the products were obtained.
2.2 Characterization of TiO2nanosheets
The resulting powders were investigated using transmission electron microscope(TEM, Hitachi H 7600) at 100 kV and energy dispersive X-ray spectroscopy(EDX, Hitachi EDX 350). The crystallinity of the products was characterized by X-ray diffraction(XRD) with Cu-Kα radiation ranging from 10 。to 100 。. A field emission transmission electron microscope(FE-TEM, Phillips Tecnai G2 F20 S-TWIN) at 200 kV was used to confirm the morphology.
2.3 Sensor fabrication and measurement
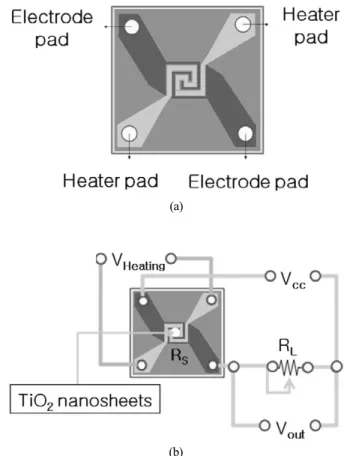
Silicon based micro-substrates with Pt electrodes and heaters were fabricated by a MEMs process. The size of the micro-substrates was 2 mm×2 mm, and the sensing area was 0.6 mm×0.6 mm, as shown in Fig. 1 (a). The shape of the electrodes was helical and the spacing between the sensing electrodes was about 95.2 μm. After processing the heating electrode, it was covered with insulating materials(SiO2).
The TiO2 powders were first mixed with a binder(ethylcellous and α-terpineol, 1:20). Then the resulting paste was coated on the sensing electrode using the dropping method. After coating, the sensors were heated at 90 。C for 1 hr and then sintered at 600 。C for 1 hr to remove the organic binder and promote adhesion between the sensing material and the micro-substrates. The sensing material has a diameter of about 653.7 um and thickness of about 10.85 um.
The micro-sensor fixed on a commercial stem was installed in a test chamber(40 ml). The carrier gas was refined air. The carrier and target gas flow rates were controlled by a mass flow controller(MFC) and a mass flow meter(MFM). The carrier gas flow rate was set at 250 sccm. VOC gases such as toluene, ethanol, acetaldehyde and benzene were selected as the target gases. The operating temperature of the sensors was controlled by a
precision power supply. The precise temperature was controlled with reference to a voltage dependent temperature table that was pre-measured using an infrared thermometer under the same conditions. The accuracy of the sensor temperature is about ± 5 。C. Fig. 1(b) shows the signal detecting circuit for gas sensor measurements.
VHeatingis the voltage from the power supply to the heater.
VCC is the applied voltage(4 V). The reference resistance(RL, between 1 MΩ~40 MΩ) and sensor resistance(RS) were aligned to the voltage from VCC. The sensor signal is represented by the values of VOUT, which were obtained from the specific voltages across the reference resistors during exposure to different gases. The sensor resistance(RS) was measured over the gap between VCCand VOUTaccording to the following equation:
Then, the response was defined as follows,
Where Ra is the electrical resistance in air and Rg is the electrical resistance in the target gas.
(1)
(2)
Fig. 1. Schematic of (a) the micro-sensor and (b) the signal detecting circuit.
(a)
(b)
3. RESULTS AND DISCUSSIONS
3.1 Morphologies and crystal structures of the TiO2 nanosheets
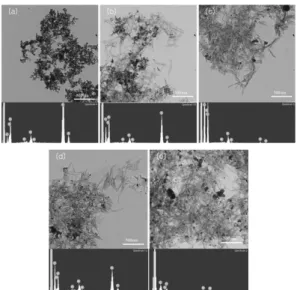
TEM observation was carried out for the morphology characterization of the samples, as shown in Fig. 2.
Samples (a), (b) and (d) were obtained after 1 hr of ultrasound irradiation using 5 M, 10 M and 15 M of NaOH, respectively. Samples (c) and (e) were obtained after 3 hrs of ultrasound irradiation using 10 M and 15 M of NaOH, respectively. It is observed that the product in sample (a) is in the form particles, revealing that the reaction was not successful. Sample (b) and (d) shows a mixed product of nanoparticles and nanosheets. However, the sample (d) shows higher purity compared to sample (b), suggesting that the high concentration of NaOH facilitates the preferred reaction in our experiment.
Comparing samples (b) and (d) to sample (c) and (e), it can be clearly seen that the samples obtained after a longer irradiation time posses higher purity. The elements of all the samples were investigated by EDX, as shown in Fig.
2(down). There was no other impurity peaks observed in the EDX analysis, which shows that all the samples are pure.
The formation mechanism of the TiO2nanosheets by this sonochemical method is thought to be as follows. First, the TiO2powder is transformed into a layered compound of Na2Ti2O5·H2O by the energy from the ultrasound in the
presence of NaOH. The chemical reaction can be depicted as:
As such, a high concentration of NaOH can encourage the above reaction from left side to right side. The large impact of the ultrasound also leads to an exfoliation of the compound layer resulting in a sheet like structure[14]. The washing of the product in HCl brings about an ion exchange between Na+ with H+ and the formation of TiO2 nanosheets. Unlike the conventional hydrothermal treatment where the resulting TiO2 nanosheets roll up to form tube-like structure which reduces the surface energy[15, 16], the TiO2 nanosheets produced by sonochemical method avoid deformation. That is because the high temperature and pressure created by the ultrasonic effect greatly enhanced the crystallization of the TiO2and acts like an annealing process[17, 18]. Consequently the increase of ultrasonic irradiation time within a certain range can increase the crystallinity of the TiO2nanosheets.
3.2 Sensing properties
Fig. 3 shows the electrical resistances of the sensors as a function of temperature, ranging from 350 。C to 530 。C. It can be seen that the resistances initially increase with temperature but reach a maximum at 478 。C. In the case of n-type oxide semiconductors, the resistance then decreases with increasing temperature. This unusual behavior can be attributed to vigorous oxygen adsorption of the metal oxide at these temperatures. The adsorbed oxygen captures electrons from the semiconductor and forms oxygen ions, and thus increases the resistance of the n-type semiconductor. When the operating temperature increases over 478 。C, the resistance of the sensors decreases again.
This is probably due to the thermal excitation of electrons becomes dominant at higher temperatures [18].
Fig. 4 shows the sensor response of the samples towards 20 ppm of ethanol. We can see that the response of the samples increases with operating temperature. At working temperatures higher than 478 。C, however, the sensor response is almost constant. Moreover, the 15 M NaOH / 1 hr and 15 M NaOH / 3 hrs samples have higher responses than the 10 M NaOH / 1hr and 10 M NaOH / 3 hrs samples.
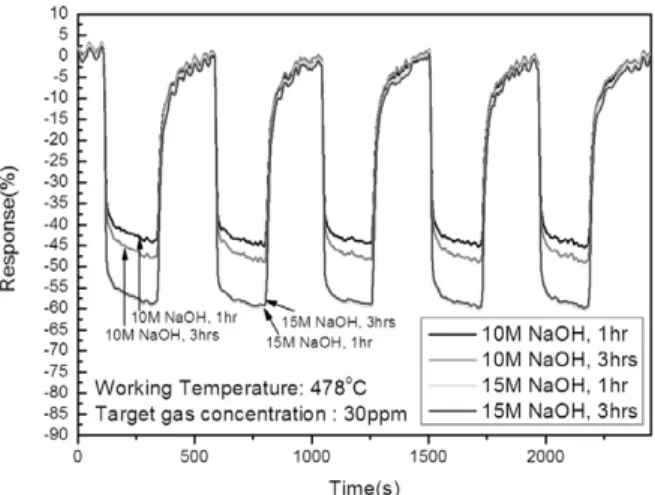
Fig. 5 shows the switching behavior of the sensors after exposure to to 30 ppm of ethanol at an operating temperature of 478 。C. It is clear that the response of the sensor is repeatable. The sensing response of the samples for the successive variations of ethanol concentration was
(3)
Fig. 2. TEM images and EDX analysis of the TiO2products with different concentrations of NaOH and irradiation times: (a) 5 M NaOH /1hr, (b) 10 M NaOH /1hr, (c) 10 M NaOH /3hrs, (d) 15 M NaOH /1hr (e) 15M NaOH /3hrs.
also studied. These measurements were carried out by increasing and decreasing the concentrations of ethanol, as shown in Fig. 6. It is obvious that the sensors have a stable response as the ethanol concentration changes from 1 ppm to 30 ppm. It can be seen that the concentrations of NaOH and the ultrasonic treatment time were important factors in the sensor responses. The response of the samples largely depends on the concentration of NaOH, while the effects of sonication time on the sensing properties are relatively small.
The sensing properties in regard to various VOC gases were also investigated. Fig. 7 shows the response of the 15 M NaOH/3 hrs sample to various concentrations of toluene, acetaldehyde and benzene. It was found that the response of the sample increases as the concentration increases. The response to acetaldehyde first increases and then maintains a constant value for concentrations over 0.5 ppm, indicating a saturated state. The high response of the sample also indicates that our sensor may detect VOC gases at a ppb-level. During the reactions sample prepared with 20 M NaOH broke down due to the high concentration of NaOH. As such, samples prepared with more than 20 M NaOH were not selected to fabricate nanosheets.
Fig. 3. Resistance of the TiO2nanosheets sensors as a function of temperature.
Fig. 4. Sensor response toward 20ppm ethanol at different working temperatures.
Fig. 5. Repeatability test of TiO2nanosheet based micro-sensors to ethanol.
Fig. 6. Response of TiO2nanosheet sensors to step-wise changes of the ethanol concentration.
Fig. 7. Response of the TiO2nanosheet sensors to toluene, acetaldehyde and benzene versus concentration.
4. CONCLUSIONS
The TiO2nanosheets were successfully fabricated using ultrasonic treatment. Our investigation revealed that both the concentration of NaOH and sonication time affects the sensing properties of the TiO2nanosheet based sensors.
The difference in sensor response between the samples obtained after 1 hr and 3 hr of ultrasonic treatment was about 10 %. The difference in sensor response between the samples prepared with different concentrations of NaOH was about 30 %. The optimum working temperature of the TiO2 nanosheet sensors is about 478 。C. The sample prepared with 15 M NaOH that was subjected to 3 hrs of ultrasonic irradiation showed the best sensing properties in the presence of VOC gases. In the presence of ethanol, the sensor demonstrated excellent repeatability and stability.
These results indicated the sensor system can detect VOC gas at ppb-level.
ACKNOWLEDGMENT
This research was supported by Conversing Research Center Program(2011K000679) funded by the Ministry of Education, Science and Technology and KEITI.
REFERENCES
[1] T. Ohgaki, R. Matsuoka, K. Watanabe, K. Matsumoto, Y. Adachi, I. Sakaguchi, S. Hishita, N. Ohashi, and H.
Haneda, “Synthesizing SnO2 thin films and characterizing sensing performances”, Sensors and Actuators B, vol. 150, pp. 99-104, 2010.
[2] S. L. Zhang, S. M. Park, J. O. Lim, and J. S. Huh,
“Sonochemical synthesis and gas sensing properties of well aligned ZnO nanorods”, Met. Mater. Int., vol. 14, pp. 621-624, 2008.
[3] M. H. Seo, M. Yuasa, T. Kida, J. S. Huh, N. Yamazoe, and K. Shimanoe, “Microstructure control of TiO2 nanotubular for improvd VOCs sensing”, Sensors and Actuators B, vol. 154, pp. 251-256, 2011.
[4] R. Rella, J. Spadavecchia, M.G. Manera, S. Capone, A.
Taurino, M. Martino, A.P. Caricato, and T. Tunno,
“Acetone and ethanol solid-state gas based on TiO2 nanoparticles thin film deposited by matrix assisted pulsed laser evaporation”, Sensors and Actuators B, vol. 127, pp. 426-431, 2007.
[5] Z. Li, M. Wu, T. Liu, C. Wu, Z. Jiao, and Bing Zhao,
“Preparation fo TiO2nanowire gas nanosensor by AFM anode oxidation”, Ultramicroscopy, vol. 108, pp. 1334- 1337, 2008.
[6] M. H. Xu, F. S. Cai, J. Yin, Z. H. Yuan, and L. J. Bie,
“Facile synthesis of highly ethanol-sensitive SnO2 nanosheets using homogeneous precipitation method”
Sensors and Actuators B, vol. 145, pp. 875-878, 2010.
[7] A. A. Firooz, A. R. Mahjoub, and A. A. Khodadadi,
“Effects of flower-like, sheet-like, and granular SnO2 nanostructures prepared by solid-state reactions on CO sensing”, Mater. Chem. and Phys., vol. 115, pp. 196- 199, 2009.
[8] T. Kasuga, M. Hiramatsu, A. Hoson, T. Sekino, and K.
Niihara, “Formation of titanium oxide nanotube”, Langmuir , vol. 14, p. 3160, 1998.
[9] S. Guo, Z. Wu, H. Wang, and F. Dong, “Synthesis of mesoporous TiO2 nanorods via a mild template-free sonochemical route and their photocatalytic performances”, Catal.Commun. vol. 10, pp. 1766-1770, 2009.
[10] W. Guo, Z. Lin, X. Wang, and G. Song, “Sonochemi- cal synthesis of nanocrystalline TiO2by hydrolysis of titanium alkoxides”, Microelectron. Eng. vol. 66, pp.
95-101, 2003.
[11] M. Seo, M. Yuasa, T. Kida J. Huh, K. Shimanoe, and N. Yamazoe, “Gas sensing characteristics and porosity control of nanostructured films composed of TiO2 nanotubes”, Sensors and Actuators B, vol. 137, pp.
513-520, 2009.
[12] E. B. Flint and K. S Suslick, “The temperature of cavitation”, Science , vol. 253, pp. 1397-1399, 1991.
[13] Y. Didenko and K. S Suslick, “The energy efficiency of formation of photons, radicals and ions during single-bubble cavitation”, Nature, vol. 418, pp. 394- 397, 2002.
[14] K. S. Suslick, “Sonochemistry”, Science, vol. 247, pp.
1439-45, 1990.
[15] M. Seo, M. Yuasa, T. Kida, J. Huh, K. Shimanoe, and N. Yamazoe, “Gas sensing characteristics and porosity control of nanostructured films composed of TiO2 nanotubes”, Sensors and Actuators B, vol. 137, pp.
513-520, 2009.
[16] M. Seo, S. Oh, T. Kida, K. Shimanoe, and J. Huh,
“Characteristics of TiO2nanotube gas sensor prepared by hydrothermal treatment”, Kor. J. Mater. Res., vol.
17, pp. 437-441, 2007.
[17] Crum, L. A.; Suslick, and K. S. “Bubbles hotter than