Introduction
In clinical orthodontics, the size, position, and relation- ships of craniofacial structures are evaluated using lateral cephalometric radiograph as an essential tool in order to understand the etiology of malocclusion, which provides data to make a plan for the correction of the problems.
Since cephalometric radiographs were introduced in clin- ical orthodontics in 1931, they have been used as an essen- tial tool to study on the craniofacial growth, to make ortho-
dontic diagnosis and treatment plan, to evaluate treatment results, and to predict craniofacial growth. However, the two-dimensional (2D) images had a limitation as diagno- stic tool in complicated dentofacial deformities. Therefore, additional images such as postero-anterior cephalometric radiograph and submentovertex radiograph were used as well. Nevertheless, in such complicated dentofacial defor- mity cases, the combination of 2D images could not pro- vide sufficient information. However, three-dimensional (3D) reconstructed images using CT have been recently in- troduced, which made it possible to evaluate 3D relation- ship of anatomic structures properly and to make a deci- sion of 3D surgical plan. In addition, 3D image data can be used for surgical simulation using 3D reconstructed images on computer monitor, real surgical simulation onto the stereolithographic model produced with 3D image data,
Evaluation of accuracy of 3D reconstruction images using multi-detector CT and cone-beam CT
Mija Kim, Kyung-Hoe Huh*, Won-Jin YI**, Min-Suk Heo*, Sam-Sun Lee**, Soon-Chul Choi*
Department of Orthodontics, Hangang Sacred Heart Hospital, Graduate School of Clinical Dentistry, Hallym University, Seoul, Korea
*Department of Oral and Maxillofacial Radiology and Dental Research Institute, School of Dentistry, Seoul National University, Seoul, Korea
**Department of Oral and Maxillofacial Radiology, BK21 Craniomaxillofacial Life Science, and Dental Research Institute, School of Dentistry, Seoul National University, Seoul, Korea
ABSTRACT
Purpose : This study was performed to determine the accuracy of linear measurements on three-dimensional (3D) images using multi-detector computed tomography (MDCT) and cone-beam computed tomography (CBCT).
Materials and Methods : MDCT and CBCT were performed using 24 dry skulls. Twenty-one measurements were taken on the dry skulls using digital caliper. Both types of CT data were imported into OnDemand software and identification of landmarks on the 3D surface rendering images and calculation of linear measurements were performed. Reproducibility of the measurements was assessed using repeated measures ANOVA and ICC, and the measurements were statistically compared using a Student t-test.
Results : All assessments under the direct measurement and image-based measurements on the 3D CT surface rendering images using MDCT and CBCT showed no statistically difference under the ICC examination. The measurements showed no differences between the direct measurements of dry skull and the image-based measurements on the 3D CT surface rendering images (P¤.05).
Conclusion : Three-dimensional reconstructed surface rendering images using MDCT and CBCT would be appropriate for 3D measurements. (Imaging Sci Dent 2012; 42 : 25-33)
KEY WORDS : Reproducibility of Results; Three-Dimensional Image; Skull
*This study was supported by grant no 04-2009-0035 from the SNUDH Research Fund.
Received September 28, 2011; Revised October 27, 2011; Accepted November 8, 2011 Correspondence to : Prof. Kyung-Hoe Huh
Department of Oral and Maxillofacial Radiology, School of Dentistry, Seoul Natio- nal University, 275-1 Yeongeon-dong, Jongno-gu, Seoul 110-768, Korea Tel) 82-2-2072-0211, Fax) 82-2-744-3919, E-mail) [email protected]
Copyright ⓒ 2012 by Korean Academy of Oral and Maxillofacial Radiology
This is an Open Access article distributed under the terms of the Creative Commons Attribution Non-Commercial License (http://creativecommons.org/licenses/by-nc/3.0) which permits unrestricted non-commercial use, distribution, and reproduction in any medium, provided the original work is properly cited.
Imaging Science in Dentistry∙pISSN 2233-7822 eISSN 2233-7830
and construction of surgical wafer or guide. In the future, such technology would provide more realistic surgical sim- ulation on computer monitor, easy evaluation of possibility of limitation for such simulation, and decision of final sur- gical plan and construction of surgical wafer in a single serial process.
Conventional multi-detector CT (MDCT) has been used to obtain image data from different angles of the body, however it has limitations such as cost, high radiation, and difficulty to access. Therefore, it may have limited uses for patients with severe dentofacial deformities requiring surgical approach. However, the recently developed cone- beam CT (CBCT)1-3for dental use has increased practical use in clinical orthodontic field because it has advantages such as cost-effectiveness, less radiation dose, and more accessibility compared with MDCT. It was reported that CBCT was useful in the general orthodontic field such as orthodontic diagnosis through orthodontic simulation4 and 3D evaluation of upper respiratory system.5More- over, CBCT can be used as a useful tool to provide super- imposition for evaluation of growth, treatment and stabil- ity, or information about impacted teeth or bone quality needed for effective orthodontic treatment.6,7So far, many diagnostic methods using 3D landmarks and reference planes on 3D surface rendering images have been intro- duced.8-15The storage of information and data of the dento- facial structure of normal or average population might help the diagnosis of orthodontic patients using 3D cephalo- metry directly in the future. For this purpose, the reprodu- cibility and accuracy of the landmark identification on 3D CT surface rendering image should be confirmed. There- fore, this study was performed to evaluate the accuracy of linear measurements on the 3D images acquired from MDCT and CBCT.
Materials and Methods
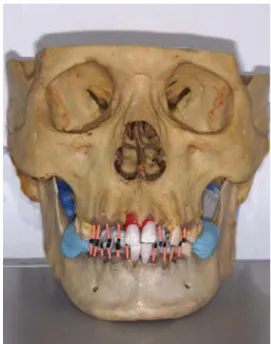
Twenty-four dry skulls were used in this study. In the skulls which lost the upper or lower incisors, acrylic artifi- cial teeth mixed with barium powder were positioned into the alveolar socket in order to mimic the incisors (Fig. 1).
Rubber impression material was placed between the con- dylar head and the articular surface in order to separate them, and the mandible was fixed to the cranium and max- illa using a rubber band. Subsequently, MDCT and CBCT were taken with appropriate position according to the image acquisition protocol. Image taking protocol for MDCT with Somatom Sensation (Siemens, Erlangen, Germany) was set at 120 kVp, 50 mA, 2.8 seconds scan time, 512×
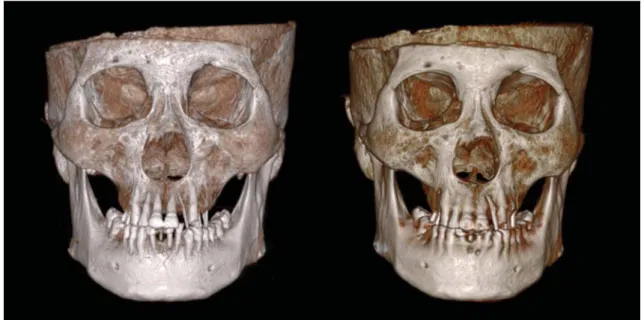
512 matrix, 0.75 mm slice thickness, 0.5 mm reconstruc- tion interval, and 256 mm length. That of CBCT with 3D eXam Dental CT (Kavo, Biberach, Germany) was 23×17 cm FOV size, 8.5 seconds scan time, isotropic voxel of 0.3 mm axial slice thickness (Fig. 2). These axial data were stored as DICOM file.
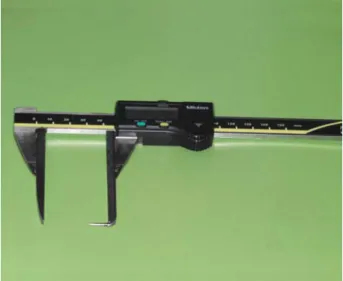
Using 14 landmarks (Table 1), the direct (physical) mea- surements on the dry skulls were compared with the image- based measurements on the 3D surface rendering images acquired from the MDCT and CBCT, that a total of twenty -one distance measurements were performed: nine distance measurements on the mid-sagittal surface (S-Na, Ba-Na, Ba-ANS, ANS-PNS, Na-ANS, Na-A, Na-B, Na-Pog, Na- Me) and six distance measurements between the bilateral landmarks (Pog-Go, Pog-Co, Go-Me, Go-Co, Go-Gn, Po- Or). Since Sella (S) is not a point landmark with bony base, it could not be defined in both of the direct and image-bas- ed measurement. In this study, S was replaced by the mid- point of the floor of sella turcica. Although Condylion (Co) has variable definitions according to the projection, it was defined as the most superior point of the mandibular con- dyle in the sagittal and frontal view in this study. The di- rect measurements were performed using a customized di- gital caliper (Fig. 3) and the image-based measurements using OnDemandTM(ver. 1.0, Cybermed, Seoul, Korea) software on 3D surface rendering images of the MDCT and CBCT (Fig. 4).
In identifying the landmarks on 3D CT surface render-
Fig. 1.An example of dry skull specimen with mandible fixed to the cranium.
ing image, the adjustment of threshold of image was help- ful to detect the bony structures. In this study, all of the landmarks except S on the MDCT images could be identi- fied at 0 HU threshold value, and the bony continuity of sella turcica could be identified at -500 HU. Since every dry skull had different thickness on sella turcica, the thre- shold of each image had to be adjusted. For the CBCT im- ages, all of the landmarks except Or and S could be identi- fied at 0 HU threshold value, while Or could be seen as
continuous surface at -250 HU, and S at -500 HU.
The anterior mid-sagittal landmarks such as Na, ANS, A-point, B-point, Pog, and Me were identified considering both of the frontal and lateral view of 3D surface rendering image. Other inner landmarks such as PNS and Ba were defined by rotating the 3D image so that the bony edge could be readily identified. Also, all the mandibular land- marks were identified using the segmentation image remov- ing the cranial and maxillary parts of the 3D images. All
Table 1.Definition of cephalometric landmarks
Abbreviation Landmark Definition
S Sella Center of the pituitary fossa of the sphenoid bone determined by inspection (In 3D measurements, midpoint of floor of pituitary fossa in the median plane)
Na Nasion Junction of the frontonasal suture
Ba Basion Most anterior point of the foramen magnum
ANS Anterior Nasal Spine Most anterior midpoint of the anterior nasal spine of the maxilla PNS Posterior Nasal Spine Most posterior midpoint of the posterior nasal spine of the palatine bone
A A-Point Point of maximum concavity in the midline of the alveolar process of the maxilla viewed sagittally
B B-Point Point of maximum concavity in the midline of the alveolar process of the mandible viewed sagittally
Me Menton Most inferior midpoint of the chin on the outline of the mandibular symphysis viewed sagittally
Pog Pogonion Most anterior midsagittal point along convexity of chin of mandibular body viewed sagittally Go Gonion Point midway along curvature of angle of mandible between inferior border of body and
posterior border of ramus of mandible viewed sagittally
Co (Superior) Most superior point of the mandibular condyle (viewed sagittally and antero-posteriorly) Condylion
Gn Gnathion Most antero-inferior point on mental symphysis Or Orbitale Most inferior point on the infraorbital rim
Po Porion Most superior point of the external acoustic meatus
Fig. 2.An example of MDCT 3D image (left) and CBCT 3D image (right) on OnDemendTM(Cybermed, Seoul, Korea) software.
the measurements were taken by one orthodontist three times at four-week interval to exclude learning effect. The direct measurements on the dry skull were compared with the image-based measurements on 3D surface rendering image.
With above data, the repeated measurements were assess- ed respectively to evaluate their reproducibility, and com- parison was performed between direct measurements and image-based measurements with MDCT and CBCT to in- vestigate their accuracy. The reproducibility of the mea- surements was analyzed using repeated measures ANOVA and Intra-class correlation coefficient (ICC) and the mea-
surements were compared by Student t-test. All statistical analyses were performed using SPSS for Windows (ver 10.0, SPSS Inc., Chicago, USA).
Results
The repeated values of the direct and image-based mea- surements on the 3D CT images with MDCT and CBCT indicated excellent reliability with a high ICC, that the lowest values were 0.984, 0.990, and 0.0965, respectively (Tables 2-4). In the repeated measures ANOVA, there were statistical difference in five measurements (S-Na, Ba-ANS, Pog-GoRt, Pog-CoRt, Go-GnRt) of the direct measurement (Table 2), in six measurements (Ba-Na, ANS-PNS, Pog- GoRt, Pog-GoLt, Co-GoRt, Go-GnRt) of the image-based measurement on MDCT 3D reconstruction images (Table 3), and in one measurement (ANS-PNS) of that on CBCT 3D reconstruction images (Table 4). However, the differ- ences of mean value were small; under 0.3 mm, 0.6 mm, and 0.2 mm, respectively.
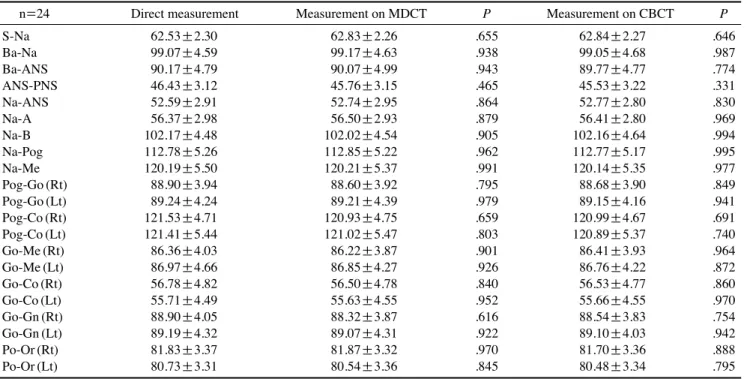
Also, there was no statistical difference between the di- rect measurements on dry skull and the image based mea- surements on both types of 3D CT surface rendering im- ages (P¤.05) (Table 5).
Discussion
CT can be used not only for partial information for re- gional pathology5-7 but also for general information that makes it possible to make diagnosis and treatment plann-
Fig. 3. A modified digital caliper to measure distance between landmarks located in concave surface.
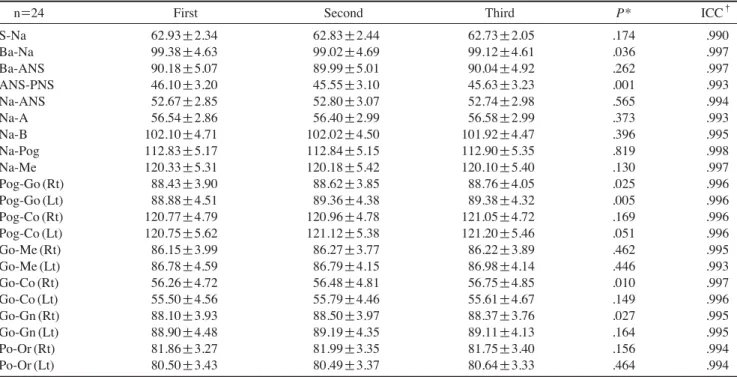
Fig. 4.An example of measurement between mid-sagittal landmarks using OnDemand. A. MDCT. B. CBCT.
A B
ing, to perform surgical simulation,16,17and to make stere- olithographic model of dentofacial deformity. As CT tech- nology has been progressed, it has been used in general orthodontic field such as orthodontic diagnosis through orthodontic simulation4 as well as surgical procedure for
dentofacial deformity. Therefore, 3D CT surface rendering image has to guarantee the accuracy as a virtual image of real craniofacial structure.
The three dimensional accuracy of cephalometric land- marks on 3D surface rendering image has been studied
Table 2.The repeated measurements of direct measurements in human dry skull
n==24 First Second Third P* ICC†
S-Na 62.64±2.40 62.44±2.34 62.51±2.19 .029 .995
Ba-Na 99.09±4.54 99.06±4.61 99.06±4.64 .927 ¤.999
Ba-ANS 90.25±4.78 90.08±4.75 90.19±4.84 .014 ¤.999
ANS-PNS 46.54±3.12 46.36±3.14 46.39±3.11 .072 .997
Na-ANS 52.58±2.86 52.60±2.94 52.60±2.96 .966 .996
Na-A 56.41±2.94 56.40±2.99 56.31±3.03 .314 .998
Na-B 102.11±4.45 102.20±4.48 102.21±4.52 .244 .998
Na-Pog 112.78±5.28 112.79±5.22 112.77±5.30 .959 .998
Na-Me 120.18±5.44 120.20±5.53 120.19±5.54 .927 ¤.999
Pog-Go (Rt) 88.91±4.02 88.76±4.00 89.02±3.80 .017 .998
Pog-Go (Lt) 89.27±4.25 89.21±4.30 89.25±4.19 .768 .998
Pog-Co (Rt) 121.56±4.78 121.44±4.72 121.61±4.65 .019 .998
Pog-Co (Lt) 121.36±5.46 121.38±5.40 121.51±5.48 .057 .998
Go-Me (Rt) 86.38±4.08 86.36±3.94 86.35±4.09 .927 .998
Go-Me (Lt) 86.90±4.59 86.85±4.51 87.16±5.09 .605 .984
Go-Co (Rt) 56.68±4.85 56.79±4.82 56.86±4.80 .185 .998
Go-Co (Lt) 55.62±4.61 55.74±4.44 55.77±4.45 .363 .998
Go-Gn (Rt) 88.90±4.04 88.79±4.01 89.01±4.12 .023 .998
Go-Gn (Lt) 89.20±4.43 89.13±4.27 89.25±4.28 .214 .998
Po-Or (Rt) 81.81±3.30 81.79±3.30 81.91±3.51 .309 .997
Po-Or (Lt) 80.73±3.36 80.72±3.35 80.75±3.24 .947 .997
*by repeated measures ANOVA, †intraclass correlation coefficient
Table 3.The repeated measurements of the image-based measurements on MDCT 3D rendering surface images
n==24 First Second Third P* ICC†
S-Na 62.93±2.34 62.83±2.44 62.73±2.05 .174 .990
Ba-Na 99.38±4.63 99.02±4.69 99.12±4.61 .036 .997
Ba-ANS 90.18±5.07 89.99±5.01 90.04±4.92 .262 .997
ANS-PNS 46.10±3.20 45.55±3.10 45.63±3.23 .001 .993
Na-ANS 52.67±2.85 52.80±3.07 52.74±2.98 .565 .994
Na-A 56.54±2.86 56.40±2.99 56.58±2.99 .373 .993
Na-B 102.10±4.71 102.02±4.50 101.92±4.47 .396 .995
Na-Pog 112.83±5.17 112.84±5.15 112.90±5.35 .819 .998
Na-Me 120.33±5.31 120.18±5.42 120.10±5.40 .130 .997
Pog-Go (Rt) 88.43±3.90 88.62±3.85 88.76±4.05 .025 .996
Pog-Go (Lt) 88.88±4.51 89.36±4.38 89.38±4.32 .005 .996
Pog-Co (Rt) 120.77±4.79 120.96±4.78 121.05±4.72 .169 .996
Pog-Co (Lt) 120.75±5.62 121.12±5.38 121.20±5.46 .051 .996
Go-Me (Rt) 86.15±3.99 86.27±3.77 86.22±3.89 .462 .995
Go-Me (Lt) 86.78±4.59 86.79±4.15 86.98±4.14 .446 .993
Go-Co (Rt) 56.26±4.72 56.48±4.81 56.75±4.85 .010 .997
Go-Co (Lt) 55.50±4.56 55.79±4.46 55.61±4.67 .149 .996
Go-Gn (Rt) 88.10±3.93 88.50±3.97 88.37±3.76 .027 .995
Go-Gn (Lt) 88.90±4.48 89.19±4.35 89.11±4.13 .164 .995
Po-Or (Rt) 81.86±3.27 81.99±3.35 81.75±3.40 .156 .994
Po-Or (Lt) 80.50±3.43 80.49±3.37 80.64±3.33 .464 .994
* by repeated measures ANOVA, †intraclass correlation coefficient
using MDCT13,18-30and CBCT.31-33There were some cate- gories in those studies; (1) identification of cephalometric landmarks on 3D surface rendering images and evaluation of the reproducibilites,19,25,28,29 and (2) identification of landmarks and comparison of those measurements on both
dry skull and 3D surface rendering images.
In the future, landmark identification and measurement on 3D CT surface rendering images may be the most important procedure in orthodontic diagnosis and treat- ment planning. Therefore, this study aimed to investigate
Table 4.The repeated measurements of the image-based measurements on CBCT 3D rendering surface images
n==24 First Second Third P* ICC†
S-Na 62.92±2.31 62.80±2.31 62.78±2.23 .237 .992
Ba-Na 98.99±4.76 99.04±4.70 99.10±4.59 .590 .997
Ba-ANS 89.79±4.80 89.74±4.75 89.78±4.77 .744 .998
ANS-PNS 45.59±3.14 45.62±3.31 45.37±3.26 .016 .995
Na-ANS 52.71±2.87 52.84±2.78 52.76±2.79 .418 .995
Na-A 56.44±2.83 56.32±2.82 56.45±2.79 .342 .995
Na-B 102.18±4.67 102.12±4.69 102.18±4.61 .810 .997
Na-Pog 112.92±5.17 112.50±5.38 112.90±5.24 .622 .981
Na-Me 120.07±5.39 120.15±5.39 120.21±5.29 .402 .998
Pog-Go (Rt) 88.69±3.98 88.58±3.85 88.78±3.92 .176 .997
Pog-Go (Lt) 89.13±4.24 89.09±4.20 89.23±4.11 .730 .994
Pog-Co (Rt) 121.02±4.74 120.90±4.69 121.06±4.61 .418 .996
Pog-Co (Lt) 121.00±5.51 120.83±5.32 120.85±5.32 .592 .996
Go-Me (Rt) 86.42±3.96 86.41±4.01 86.40±3.86 .984 .996
Go-Me (Lt) 86.80±4.25 86.72±4.27 86.77±4.19 .710 .997
Go-Co (Rt) 56.39±4.78 56.62±4.77 56.58±4.77 .124 .998
Go-Co (Lt) 55.70±4.55 55.65±4.59 55.65±4.55 .866 .997
Go-Gn (Rt) 88.57±3.80 88.38±3.85 88.67±3.88 .186 .995
Go-Gn (Lt) 88.88±4.37 88.95±4.36 89.49±3.73 .447 .965
Po-Or (Rt) 81.68±3.36 81.62±3.37 81.79±3.40 .453 .995
Po-Or (Lt) 80.40±3.45 80.50±3.35 80.55±3.25 .346 .996
*by repeated measures ANOVA, †intra-class correlation coefficient
Table 5.Comparison of the direct measurements to image-based measurements on MDCT and CBCT
n==24 Direct measurement Measurement on MDCT P Measurement on CBCT P
S-Na 62.53±2.30 62.83±2.26 .655 62.84±2.27 .646
Ba-Na 99.07±4.59 99.17±4.63 .938 99.05±4.68 .987
Ba-ANS 90.17±4.79 90.07±4.99 .943 89.77±4.77 .774
ANS-PNS 46.43±3.12 45.76±3.15 .465 45.53±3.22 .331
Na-ANS 52.59±2.91 52.74±2.95 .864 52.77±2.80 .830
Na-A 56.37±2.98 56.50±2.93 .879 56.41±2.80 .969
Na-B 102.17±4.48 102.02±4.54 .905 102.16±4.64 .994
Na-Pog 112.78±5.26 112.85±5.22 .962 112.77±5.17 .995
Na-Me 120.19±5.50 120.21±5.37 .991 120.14±5.35 .977
Pog-Go (Rt) 88.90±3.94 88.60±3.92 .795 88.68±3.90 .849
Pog-Go (Lt) 89.24±4.24 89.21±4.39 .979 89.15±4.16 .941
Pog-Co (Rt) 121.53±4.71 120.93±4.75 .659 120.99±4.67 .691
Pog-Co (Lt) 121.41±5.44 121.02±5.47 .803 120.89±5.37 .740
Go-Me (Rt) 86.36±4.03 86.22±3.87 .901 86.41±3.93 .964
Go-Me (Lt) 86.97±4.66 86.85±4.27 .926 86.76±4.22 .872
Go-Co (Rt) 56.78±4.82 56.50±4.78 .840 56.53±4.77 .860
Go-Co (Lt) 55.71±4.49 55.63±4.55 .952 55.66±4.55 .970
Go-Gn (Rt) 88.90±4.05 88.32±3.87 .616 88.54±3.83 .754
Go-Gn (Lt) 89.19±4.32 89.07±4.31 .922 89.10±4.03 .942
Po-Or (Rt) 81.83±3.37 81.87±3.32 .970 81.70±3.36 .888
Po-Or (Lt) 80.73±3.31 80.54±3.36 .845 80.48±3.34 .795
P : Student t-test between direct measurement and measurement on MDCT and CBCT.
18,20-24,26,27,30-33
the accuracy, reproducibility, and possibility of errors in those procedures. Also, this study compared the differ- ences of the results between MDCT and CBCT. For this purpose, the landmarks in this study were selected in commonly used landmarks for both 2D images and 3D images, with agreement of definition.
As computer and CT-related technology have been pro- gressed, it has been reported that the error of measurement originated from the image acquisition, processing, recon- struction, and display procedure has decreased and that the error of repeated measurements was generally less than 2 mm.13,18-33However, it was reported that landmark identi- fication on 3D surface rendering images would be quite different from that on 2D images.31,34
In this study, a total of twenty-one measurements were performed to examine the reproducibility of the repeated measurements and to compare the image-based measurements with the direct measurements on dry skull as gold standard: nine distance measurements on the mid- sagittal surface (S-Na, Ba-Na, Ba-ANS, ANS-PNS, Na- ANS, Na-A, Na-B, Na-Pog, Na-Me) and six distance mea- surements between the bilateral landmarks (Pog-Go, Pog- Co, Go-Me, Go-Co, Go-Gn, Po-Or). As shown in Tables 2-4, all the assessments under the direct measurement and image-based measurement of 3D CT surface rendering im- ages with MDCT and CBCT revealed good reproducibility (high ICC). As shown in Table 5, all twenty-one measure- ments showed no differences between the measurements on dry skull and both types of 3D surface rendering images (P¤.05).
The poor reproducibility of 3D landmarks identification might be originated from the contributing factors such as the characteristics of specific landmarks, errors related with CT images, and errors related with image acquisition protocol. Regarding the factors related with reproducibility of landmarks, Olszewski et al35classified the landmarks into four groups, from group 1 (very high reproducibility) to group 4 (low reproducibility) according to their inter- observer reproducibility originated from the characteristics of the landmars. According to their report, the landmarks in this study could be classified as follows. ANS was group 1, A point, Ba, S, Me, and Na were group 2, Go, Or, Po, and B were group 3, and Pog was group 4. Also, Williams and Richtsmeier26classified the mandibular landmarks into
“fuzzy”, “constructed”, and “biologic” according to their characteristics, that “fuzzy” and “constructed” landmarks revealed less reliability than “biological” landmarks. In this study, Gn, Pog, and Co belonged to “fuzzy” landmarks, Go belonged to “constructed”, and there was no “biologi-
cal” landmark. Since Na indicated the intersection of the internasal and the frontonasal suture on 2D cephalometric lateral image, vertical error might primarily occur in identi- fying the landmark on plain radiograph,20,31,36while on 3D image, it might be difficult to establish the suture location on the mid-sagittal plane due to the loss of detail on the rendering image. Also, Go also revealed low reproducibi- lity in the y-directions, and Or and Co in the x-direction on 3D images.37
The second contributing factor related to the errors was the characteristic of CT images.25,32,38Partial volume ef- fect19 of CT image could affect the error in identifying sharp and small landmarks such as ANS or PNS. This phe- nomenon appeared strongly when using dry skull, which 3D measurements were always less than the direct mea- surements.38In our study, the slice thickness of MDCT was 0.75 mm, therefore the relatively thin slice might reduce those errors of the measurements.8,24,27,30,39
The third contributing factor related to the errors was the type of image acquisition. CBCT produces 3D CT images based on data acquired from a single rotation of cone-shap- ed X-ray tube and detector around subject.1-3These com- plete series from a single 360�rotation scan is referred to as the projection data, and the number of images compri- sing the projection data is determined by the frame rate, the completeness of the trajectory arc, and the speed of the rotation. More projection data might provide more in- formation in reconstructing the image. However, there was a study that showed no difference in accuracy even the number of image projections was reduced to 153.33In this study, the image acquisition protocols were set at the com- monly used protocol of patients. These protocols might result in no significant differences between direct and im- age-based measurements on 3D images. However, it should be considered that the accuracy of measurement might be decreased by the degradation of image quality due to soft- tissue attenuation, metallic artifacts, and patient motion.
In addition, patient posture during image acquisition and head-fixing device might result the errors.32
It was reported that the landmark identification on 3D surface rendering images was more realistic and accurate than that on 2D images because the stereoscopic images could be displayed and rotated in intended direction for landmark identification. Some landmarks might be difficult to localize when using only CT axial slices.19,40 The accu- racy of 3D CT was reported as higher than that of 2D CT images.21,41,42However, some landmarks such as Me and Zy were reported to be more accurate when identifying on 3D surface rendering images in conjunction with 2D im-
ages.27A new 3D cephalometric method, direct identifi- cation of landmarks on 3D surface rendering images,13was regarded as an important intermediation to link 2D cepha- lometric radiographs and 3D images.
Available 3D images without any distortion have advan- tages to overcome the limitation of 2D images. Since 3D cephalometric method would be commonly used soon, the appropriate landmarks for 3D analysis should be develop- ed. Also, their reproducibility and accuracy should be eval- uated, and consensus on the landmarks should be made.
In conclusion, this study evaluated the reproducibility and accuracy of identification of common cephalometric land- marks on 3D surface rendering images, and 3D surface rendering images using MDCT and CBCT were appropri- ate for 3D measurements.
References
1. Mozzo P, Procacci C, Tacconi A, Martini PT, Andreis IA. A new volumetric CT machine for dental imaging based on the cone-beam technique: preliminary results. Eur Radiol 1998; 8 : 1558-64.
2. Sukovic P. Cone beam computed tomography in craniofacial imaging. Orthod Craniofac Res 2003; 6(suppl 1) : 31-6.
3. Ludlow JB, Davies-Ludlow LE, Brooks SL, Howerton WB.
Dosimetry of 3 CBCT devices for oral and maxillofacial radi- ology: CB Mercuray, NewTom 3G and i-CAT. Dentomaxillo- fac Radiol 2006; 35 : 219-26.
4. Maki K, Inou N, Takanishi A, Miller AJ. Computer-assisted simulations in orthodontic diagnosis and the application of a new cone beam X-ray computed tomography. Orthod Cranio- fac Res 2003; 6(suppl 1) : 95-101.
5. Aboudara CA, Hatcher D, Nielsen IL, Miller A. A three-dimen- sional evaluation of the upper airway in adolescents. Orthod Craniofac Res 2003; 6(suppl 1) : 173-5.
6. Cevidanes LH, Styner MA, Proffit WR. Image analysis and superimposition of 3-dimensional cone-beam computed tomo- graphy models. Am J Orthod Dentofacial Orthop 2006; 129 : 611-8.
7. Kau CH, Richmond S, Palomo JM, Hans MG. Three-dimensio- nal cone beam computerized tomography in orthodontics. J Orthod 2005; 32 : 282-93.
8. Park SH, Yu HS, Kim KD, Lee KJ, Baik HS. A proposal for a new analysis of craniofacial morphology by 3-dimensional computed tomography. Am J Orthod Dentofacial Orthop 2006;
129 : 600.e23-e34.
9. Maeda M, Katsumata A, Ariji Y, Muramatsu A, Yoshida K, Goto S, et al. 3D-CT evaluation of facial asymmetry in patients with maxillofacial deformities. Oral Surg Oral Med Oral Pathol Oral Radiol Endod 2006; 102 : 382-90.
10. Olszewski R, Cosnard G, Macq B, Mahy P, Reychler H. 3D CT-based cephalometric analysis: 3D cephalometric theoreti- cal concept and software. Neuroradiology 2006; 48 : 853-62.
11. Hwang HS, Hwang CH, Lee KH, Kang BC. Maxillofacial 3- dimensional image analysis for the diagnosis of facial asym-
metry. Am J Orthod Dentofacial Orthop 2006; 130 : 779-85.
12. Lagravère MO, Hansen L, Harzer W, Major PW. Plane orienta- tion for standardization in 3-dimensional cephalometric analy- sis with computerized tomography imaging. Am J Orthod Dentofacial Orthop 2006; 129 : 601-4.
13. Swennen GR, Schutyser F, Barth EL, De Groeve P, De Mey A. A new method of 3-D cephalometry Part I: The anatomic Cartesian 3-D reference system. J Craniofac Surg 2006; 17 : 314-25.
14. Olszewski R, Zech F, Cosnard G, Nicolas V, Macq B, Reychler H. Three-dimensional computed tomography cephalometric craniofacial analysis: experimental validation in vitro. Int J Oral Maxillofac Surg 2007; 36 : 828-33.
15. Yoon SJ, Lim HJ, Kang BC, Hwang HS. Three dimensional CT analysis of facial asymmetry. Korean J Oral Maxillofac Radiol 2007; 37 : 45-51.
16. Xia J, Samman N, Yeung RW, Shen SG, Wang D, Ip HH, et al. Three-dimensional virtual reality surgical planning and si- mulation workbench for orthognathic surgery. Int J Adult Or- thodon Orthognath Surg 2000; 15 : 265-82.
17. Westermark A, Zachow S, Eppley BL. Three-dimensional oste- otomy planning in maxillofacial surgery including soft tissue prediction. J Craniofac Surg 2005; 16 : 100-4.
18. Hildebolt CF, Vannier MW, Knapp RH. Validation study of skull three-dimensional computerized tomography measure- ments. Am J Phys Anthropol 1990; 82 : 283-94.
19. Kragskov J, Bosch C, Gyldensted C, Sindet-Pedersen S. Com- parison of the reliability of craniofacial anatomic landmarks based on cephalometric radiographs and three-dimensional CT scans. Cleft Palate Craniofac J 1997; 34 : 111-6.
20. Nagashima M, Inoue K, Sasaki T, Miyasaka K, Matsumura G, Kodama G. Three-dimensional imaging and osteometry of adult human skulls using helical computed tomography. Surg Radiol Anat 1998; 20 : 291-7.
21. Cavalcanti MG, Vannier MW. Quantitative analysis of spiral computed tomography for craniofacial clinical applications.
Dentomaxillofac Radiol 1998; 27 : 344-50.
22. Cavalcanti MG, Haller JW, Vannier MW. Three-dimensional computed tomography landmark measurement in craniofacial surgical planning: experimental validation in vitro. J Oral Ma- xillofac Surg 1999; 57 : 690-4.
23. Jung H, Kim HJ, Kim DO, Hong SI, Jeong HK, Kim KD, et al. Quantitative analysis of three-dimensional rendered imag- ing of the human skull acquired from multi-detector row com- puted tomography. J Digit Imaging 2002; 15 : 232-9.
24. Kim DO, Kim HJ, Jung H, Jeong HK, Hong SI, Kim KD. Qu- antitative evaluation of acquisition parameters in three-dimen- sional imaging with multidetector computed tomography using human skull phantom. J Digit Imaging 2002; 15(suppl 1) : 254-7.
25. Jeon KJ, Park H, Lee HC, Kim KD, Park CS. Reproducibilities of cephalometric measurements of three-dimensional CT im- ages reconstructed in the personal computer. Korean J Oral Maxillofac Radiol 2003; 33 : 171-8.
26. Williams FL, Richtsmeier JT. Comparison of mandibular land- marks from computed tomography and 3D digitizer data. Clin Anat 2003; 16 : 494-500.
27. Cavalcanti MG, Rocha SS, Vannier MW. Craniofacial mea-
surements based on 3D-CT volume rendering: implications for clinical applications. Dentomaxillofac Radiol 2004; 33 : 170- 6.
28. Park JW, Kim NK, Chang YI. Formulation of a reference coor- dinate system of three-dimensional (3D) head & neck images:
Part I. Reproducibility of 3D cephalometric landmarks. Korean J Orthod 2005; 35 : 388-97.
29. Olszewski R, Reychler H, Cosnard G, Denis JM, Vynckier S, Zech F. Accuracy of three-dimensional (3D) craniofacial ceph- alometric landmarks on a low-dose 3D computed tomograph.
Dentomaxillofac Radiol 2008; 37 : 261-7.
30. Lopes PM, Moreira CR, Perrella A, Antunes JL, Cavalcanti MG. 3-D volume rendering maxillofacial analysis of angular measurements by multislice CT. Oral Surg Oral Med Oral Pa- thol Oral Radiol Endod 2008; 105 : 224-30.
31. Stratemann SA, Huang JC, Maki K, Miller AJ, Hatcher DC.
Comparison of cone beam computed tomography imaging with physical measures. Dentomaxillofac Radiol 2008; 37 : 80-93.
32. Periago DR, Scarfe WC, Moshiri M, Scheetz JP, Silveira AM, Farman AG. Linear accuracy and reliability of cone beam CT derived 3-dimensional images constructed using an orthodontic volumetric rendering program. Angle Orthod 2008; 78 : 387- 95.
33. Brown AA, Scarfe WC, Scheetz JP, Silveira AM, Farman AG.
Linear accuracy of cone beam CT derived 3D images. Angle Orthod 2009; 79 : 150-7.
34. Kumar V, Ludlow JB, Mol A, Cevidanes L. Comparison of conventional and cone beam CT synthesized cephalograms.
Dentomaxillofac Radiol 2007; 36 : 263-9.
35. Olszewski R, Tanesy O, Cosnard G, Zech F, Reychler H. Re-
producibility of osseous landmarks used for computed tomo- graphy based three-dimensional cephalometric analyses. J Cra- niomaxillofac Surg 2010; 38 : 214-21.
36. Baumrind S, Frantz RC. The reliability of head film measure- ments. 1. Landmark identification. Am J Orthod 1971; 60 : 111- 27.
37. Chien PC, Parks ET, Eraso F, Hartsfield JK, Roberts WE, Ofner S. Comparison of reliability in anatomical landmark identification using two-dimensional digital cephalometrics and three-dimensional cone beam computed tomography in vivo. Dentomaxillofac Radiol 2009; 38 : 262-73.
38. Jeong HG, Kim KD, Park H, Kim DO, Jeong H, Kim HJ, et al.
Three-dimensional image analysis of the skull using variable CT scanning protocols-effect of slice thickness on measure- ment in the three-dimensional CT images. Korean J Oral Maxi- llofac Radiol 2004; 34 : 151-7.
39. Swennen GR, Schutyser F. Three-dimensional cephalometry:
spiral multi-slice vs cone-beam computed tomography. Am J Orthod Dentofacial Orthop 2006; 130 : 410-6.
40. Richtsmeier JT, Paik CH, Elfert PC, Cole TM 3rd, Dahlman HR. Precision, repeatability, and validation of the localization of cranial landmarks using computed tomography scans. Cleft Palate Craniofac J 1995; 32 : 217-27.
41. Fox LA, Vannier MW, West OC, Wilson AJ, Baran GA, Pil- gram TK. Diagnostic performance of CT, MPR, 3DCT imag- ing in maxillofacial trauma. Comput Med Imaging Graph 1995; 19 : 385-95.
42. Laine FJ, Conway WF, Laskin DM. Radiology of maxillofacial trauma. Curr Probl Diagn Radiol 1993; 22 : 145-88.