Intravascular optical coherence tomography (OCT) is a useful tool for the detection of a thin layer of neointimal hyperplasia (NIH) and malapposition with high- resolution ( ≥ 10 µm).
1-5ST-elevation myocardial infarction (STEMI) is associated with a higher risk of stent thrombosis and malapposition may be a surrogate marker.
6-8Currently, available drug eluting stents (DES) have different properties of stent expansion and apposition. However, the data are lacking in initial findings
The Initial Extent of Malapposition in ST-Elevation Myocardial Infarction Treated with Drug-Eluting Stent:
The Usefulness of Optical Coherence Tomography
Ung Kim,
1Jung-Sun Kim,
2Jin-Sun Kim,
2Jung-Myung Lee,
2Jung-Woo Son,
2Jaedeok Kim,
2Young-Guk Ko,
2Donghoon Choi,
2and Yangsoo Jang
21Division of Cardiology, Inje University College of Medicine, Pusan Paik Hospital, Busan;
2Division of Cardiology, Yonsei Cardiovascular Center, Yonsei University College of Medicine, Seoul, Korea.
Purpose: The aim of this study is to identify the extent of initial malapposition using optical coherence tomography (OCT) in ST-elevation myocardial infarctions (STEMI) treated with different types of drug-eluting stents (DES). Materials and Methods: Twenty four STEMI patients that underwent primary percutaneous coronary intervention (PCI) were enrolled. The OCT and intravascular ultrasound (IVUS) were performed within 72 hours after the primary PCI. Distances between the endo-luminal surface of the strut reflection and the vessel wall and the extent of malapposition were measured and analyzed. Results: Sirolimus-eluting stents (SES), paclitaxel-eluting stents (PES) and zotarolimus-eluting stents (ZES) were deployed in 7 patients (29%), 7 patients (29%) and 10 patients (42%). In total, 4951 struts in 620 mm single-stent segments were analyzed (1463 struts in SES, 1522 in PES, and 1966 in ZES). In strut analysis by OCT, the incidence of malapposition was 17 % (860/4951) and in stent analysis by IVUS, malapposition rate was 21% (5/24). The malapposition rate of strut level using OCT in 5 patients who had malapposition in IVUS was significantly higher than the 19 of those who had not (32 ± 5% vs. 12 ± 6%, p = 0.001). In addition, the frequency of malap- position was also significantly different (28% in SES, 11% in PES, 10% in ZES, p
= 0.001). The use of SES was an independent predictor of malapposed struts.
Conclusion: The incidence of malapposition using OCT was quite prevalent in STEMI after primary PCI with DES implantation and SES has especially higher rates of malapposition compared to other DESs.
Key Words: Malapposition, drug eluting stent, coherence tomography, optical, myocardial infarction
Received: February 18, 2009 Revised: July 27, 2009 Accepted: August 21, 2009
Corresponding author: Dr. Jung-Sun Kim, Division of Cardiology, Yonsei Cardiovascular Center, Yonsei University College of Medicine, 250 Seongsan-ro, Seodaemun-gu,
Seoul 120-752, Korea.
Tel: 82-2-2228-8460, Fax: 82-2-393-20414 E-mail: [email protected]
∙The authors have no financial conflicts of interest.
© Copyright:
Yonsei University College of Medicine 2010 This is an Open Access article distributed under the terms of the Creative Commons Attribution Non- Commercial License (http://creativecommons.org/
licenses/by-nc/3.0) which permits unrestricted non- commercial use, distribution, and reproduction in any medium, provided the original work is properly cited.
INTRODUCTION
such as malapposition using OCT in STEMI treated with DES. The aim of this study is to identify the extent of initial malapposition using OCT in STEMI treated with DES and to compare the results between different stent types.
Study population and protocol
Twenty four patients (20 males, 83%) who were diagnosed with STEMI and underwent primary percutaneous coro- nary intervention (PCI) were enrolled from Aug. 2007 to Mar. 2008 in the Cardiovascular Hospital of Yonsei Uni- versity Medical Center. The study protocols were approved by the institutional ethics committee of Yonsei University College of Medicine, and written consent was obtained from all patients before the procedure. Emergency coronary angiography and primary PCI were performed by the femoral approach according to standard techniques in each of the patients. Using a guiding catheter for magnification and calibration, quantitative coronary angiography was performed immediately after the procedure. OCT was per- formed in infarct-related arteries treated with DES at the second stage within 72 hours of the primary PCI. STEMI was defined as continuous chest pain lasting > 30 min, with arrival at our hospital within 12 hours from the onset of the symptom, with ST-segment elevation ≥ 0.1 mV in two or more contiguous leads on 12-lead electrocardiogram and elevation of serum cardiac enzymes such as troponin and/or creatine kinase-MB (CK-MB). The luminal diameter proximal to the culprit lesion was required to be between 2.5 mm and 4.0 mm due to the maximal diameter of the currently available occlusion balloon. Exclusion criteria were poor left ventricular function (< 30% of ejection fraction), hemodynamic instability, significant left main coronary artery disease, renal insufficiency with baseline serum creatinine > 1.5 mg/dL, a single remaining vessel, highly tortuous vessels, and ostial or very proximal lesions (< 15 mm from ostium).
Adjunctive medication
All patients received an intravenous bolus injection of 5,000 U of heparin. In primary PCI in STEMI, 200 mg of aspirin was given before the procedure and 600 mg of clopidogrel was given during the surgery. After the PCI, both drugs were continuously administered for at least 12 months. The use of glycoprotein IIb/IIIa inhibitors was left to the discre- tion of the operator.
Intravascular ultrasound examination
An intravascular ultrasound (IVUS) was performed during primary PCI if needed. However, it was done concurrently
with OCT within 72 hours and the data was analyzed.
IVUS assessment was performed using a commercially available IVUS system (Boston Scientific/Scimed, Natick, MA, USA) with automatic motorized 0.5 mm/s pullback.
All IVUS procedures were performed after intracoronary administration of nitroglycerin 200 µg. Studies were record- ed on a compact disk for offline analysis using Index (Echo- plaque 2; INDEC System, Inc., Mountain View, CA, USA).
Proximal reference cross-sectional area (CSA, mm
2) and distal reference CSA (mm
2) were measured at the most visually normal area (largest lumen with the least plaque burden) within 10 mm of the proximal or distal ends of the lesion. Malapposition was defined as the separation of at least 1 stent strut from the intimal surface of the arterial wall that was not overlapping a side branch and had evi- dence of blood flow (speckling) behind the strut.
9OCT examination
The OCT system used in this study consisted of a computer, a monitor display, an interface unit (Model M2 Cardiology Imaging System, LightLab Imaging, Inc., Westford, MA, USA), and a 0.014-inch wire-type imaging catheter (Image- Wire, LightLab Imaging, Inc., Westford, MA, USA). A motorized pull-back system at 1.0 mm/s was used, and OCT images were acquired at 15 frames/s. The axial resolution capacity of this system was 15 µm. All patients were given 5,000 IU of heparin intravenously before their respective procedures. A 6Fr or 7Fr guiding catheter was introduced into the coronary artery by a femoral approach, and nitrogly- cerin (200 µg) was administered through the guiding catheter. To remove the blood from the field of view and allow for clear images, an occlusion balloon catheter (Helios, Avantec Vascular Corp., Sunnyvale, CA, USA) and flush- ing with warm lac was used in an over-the-wire type method with the flush lumen and the lumen for crossing the imag- ing catheter. There were two metal markers at the tip and at the center of the occlusion balloon. The occlusion catheter was positioned proximal to the stent and the image catheter was positioned distal to the stent. During image acquisition, the occlusion balloon was inflated at 0.4 to 0.6 atm and Ringer lactate was infused at 0.5 to 1.0 mL/s. The image wire was pulled from distal to proximal, and continuous images were stored digitally for subsequent analysis.
OCT analysis
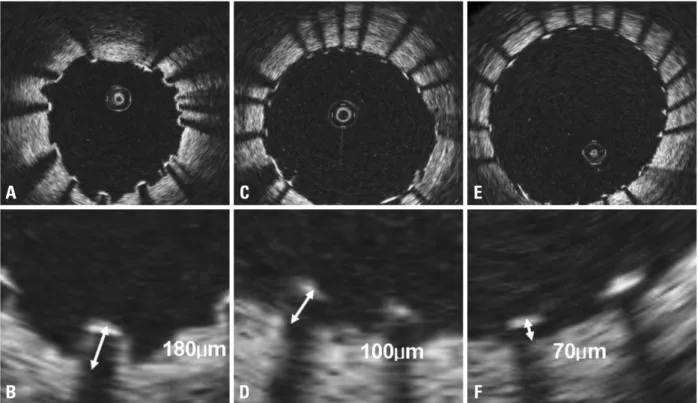
Cross-sectional OCT images were analyzed at 1-mm inter- vals (every 15 frames). Stent struts appeared as highly reflective surfaces that cast shadows on the vessel wall behind. The distances between the endo-luminal surface of the strut reflection and the vessel wall were measured by prolonging and joining the contours of the wall on either side of the strut shadow with a measurement line as perpen-
MATERIALS AND METHODS
dicular as possible to the strut and vessel wall (Fig. 1).
When the strut was not fully attached to the vessel wall by visual estimation, the position of the stent strut to the vessel wall was measured by magnifying the individual stent strut to maximize accuracy. Malapposed stent struts were defin- ed as struts with detachment from the vessel wall ≥ 160 µm for sirolimus-eluting stents (SES; Cypher select, Cordis, J&J, East Bridgewater, NJ, USA), ≥ 130 µm for paclitaxel- eluting stents (PES; Taxus Liberte, Boston Scientific, Natick, MA, USA), and ≥ 110 µm for zotaroliums-eluting stents (ZES; Endeavor, Medtronic, Minneapolis, MN, USA).
10Stent overlapping segments and bifurcation lesions with major side branches were excluded from this analysis.
Inter-observer and intra-observer variabilities in measured distances were assessed by the evaluation of 20 random cross-sectional images by two independent readers and by the same reader at two separate time points, respectively.
The variations between measurements were calculated using the linear mixed model (one-way mixed and two- way mixed models).
Statistical analysis
Results are expressed as a mean ± SD or number (%).
Comparisons of categorical variables were made using the Chi-square test and the student’s t-test while one way ANOVA were used to compare continuous variables. The intra-observer and inter-observer agreements (reproduci-
bility) were assessed by determining the mean ± SD of differences between observations and between observers, respectively. If the distributions were skewed, a non-para- metric test was used. Because the observation of struts in the same stent is not independent of each other and the hierarchical nature of the data, mixed effect multiple logis- tic regression with malapposition as the outcome variable was applied to address random and fixed effects at the strut, lesion and patient levels. At the lesion level, stent type (SES versus non-SES), stent diameter, stent length, reference vessel diameter, minimal luminal diameter and maximum inflation pressure were considered. At the patient level, age, sex and diabetes mellitus were considered.
11All analyses were performed using the Statistical Analysis System software (SAS 9.1.3., SAS Institute, Cary, NC, USA; and R 2.8.1., R Foundation, Vienna, Austria) and p < 0.05 was considered statistically significant.
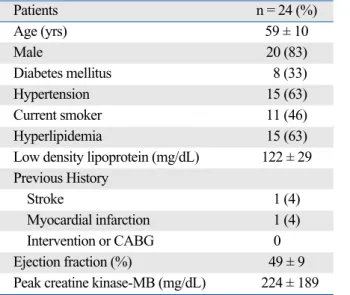
Baseline characteristics and angiographic findings Baseline characteristics of patients are presented in Table 1.
The patients’ mean age was 59 ± 10 years and they were predominantly male. Seventy percent of patients (16, 66%) had multi-vessel disease, with culprit lesions predomina- tely in the left descending artery (14, 58%). SES was
RESULTS
Fig. 1. Measurements of strut apposition. The distances between the endo-luminal surface of the strut reflection and the vessel wall were measured. (A and B) shows OCT image of SES and strut measurements and represents malapposition. (C and D) shows OCT image of PES and strut measurement shows normal stent apposition.
(E and F) represents OCT image of ZES and its measurement shows normal stent apposition. Definition of malapposition: ≥ 160 µm for SES, ≥ 130 µm for PES, ≥ 110 µm for ZES.7OCT, optical coherence tomography; SES, sirolimus-eluting stent; PES, paclitaxel-eluting stent; ZES, zotarolimus-eluting stent.
A C E
B D F
implanted in 7 patients (29%), PES in 7 patients (29%), and ZES in 10 patients (42%). Angiographic results are shown in Table 2. A pre-stenting balloon was applied in all patients. High pressures (15.0 ± 2.0 atm) were applied in all implanted stents but it was not statistically significant (Table 3). The quantitative angiographic analysis in each
Table 1. Baseline Characteristics of Patients
Patients n = 24 (%)
Age (yrs) 59 ± 10
Male 20 (83)
Diabetes mellitus 8 (33)
Hypertension 15 (63)
Current smoker 11 (46)
Hyperlipidemia 15 (63)
Low density lipoprotein (mg/dL) 122 ± 29 Previous History
Stroke 1 (4)
Myocardial infarction 1 (4)
Intervention or CABG 0
Ejection fraction (%) 49 ± 9
Peak creatine kinase-MB (mg/dL) 224 ± 189
CABG, coronary artery bypass graft.Values are presented as means ± SD or percentages.
Table 2. Angiographic Results of Patients
Patient n = 24 (%)
Pre TIMI 0 11 (46)
Lesion length, mm 25 ± 6
Types of lesion
A 2 (8)
B1 9 (38)
B2 8 (33)
C 5 (21)
Diseased vessel, n (%)
1 vessel 8 (34)
2 vessel 14 (58)
3 vessel 2 (8)
Culprit lesion, n (%)
RCA 7 (29)
LAD 14 (58)
LCX 3 (13)
Drug eluting stent, n (%)
Sirolimus eluting stent 7 (29) Paclitaxel eluting stent 7 (29) Zotarolimus eluting stent 10 (42)
RCA, right coronary artery; LAD, left anterior descending artery; LCX, left circumflex artery.Values are presented as mean ± SD or percentages.
Table 3. Procedural Results, Quantitative Coronary Angiographic Analysis and IVUS Measurements Among Stents Total (n = 24) SES (n = 7) PES (n = 7) ZES (n = 10) p value Pre-stenting ballooning (n, %) 24 (100%) 7 (100%) 7 (100%) 10 (100%) 1.00
Stent size (mm) 3.0 ± 0.2 2.9 ± 0.1 3.0 ± 0.2 3.1 ± 0.3 0.32
Stent length (mm) 25.8 ± 6.8 27.3 ± 5.3 28.0 ± 8.5 23.3 ± 6.1 0.31
Maximal pressure (atm) 15.3 ± 2.1 15.7 ± 2.4 14.8 ± 2.3 15.4 ± 1.9 0.76 Stent to artery ratio 1.10 ± 0.09 1.13 ± 0.09 1.05 ± 0.11 1.11 ± 0.08 0.31 Proximal reference diameter (mm) 3.0 ± 0.4 2.9 ± 0.2 3.0 ± 0.4 3.1 ± 0.4 0.57 Distal reference diameter (mm) 2.5 ± 0.4 2.3 ± 0.4 2.7 ± 0.4 2.5 ± 0.5 0.33 Pre-intervention
Minimal lumen diameter (mm) 0.4 ± 0.4 0.2 ± 0.3 0.3 ± 0.5 0.5 ± 0.4 0.31 Diameter stenosis (%) 85.6 ± 16.3 90.1 ± 16.1 88.9 ± 16.5 79.4 ± 15.8 0.30 Post-intervention
Minimal lumen diameter (mm) 2.8 ± 0.3 2.6 ± 0.1 2.9 ± 0.3 2.8 ± 0.3 0.17
Diameter stenosis (%) 6.6 ± 6.5 9.2 ± 4.9 3.6 ± 5.1 6.8 ± 8.1 0.30
Post-intervention IVUS parameters (mm
2)
Proximal reference EEM CSA 15.3 ± 3.6 15.3 ± 4.0 15.3 ± 2.3 15.3 ± 4.4 0.99 Proximal reference lumen CSA 7.7 ± 2.1 6.9 ± 2.0 7.4 ± 1.8 8.6 ± 2.1 0.25 Lesion-segment EEM CSA 13.1 ± 3.3 12.1 ± 3.5 13.7 ± 3.6 13.4 ± 2.9 0.65 Lesion-segment lumen CSA 5.4 ± 1.4 4.4 ± 1.1 5.1 ± 0.8 6.5 ± 1.3 0.00 Distal reference EEM CSA 10.1 ± 3.1 9.2 ± 2.4 10.8 ± 3.3 10.2 ± 3.6 0.64 Distal reference lumen CSA 6.4 ± 1.7 6.4 ± 2.1 5.9 ± 0.6 6.8 ± 2.1 0.62
IVUS, intravascular ultrasound; SES, sirolimus-eluting stent; PES, paclitaxel-eluting stent; ZES, zotarolimus-eluting stent; EEM, external elastic membrane; CSA, cross sectional area.Values are presented as means ± SD or percentages.
group is shown in Table 3.
IVUS measurements
Post-intervention IVUS measurements are represented in Table 3. Among the groups, IVUS parameters were not significantly different except for minimal stent CSA. The initial rate of malapposition measured by IVUS was 21%, and had a higher trend toward to SES.
OCT measurements
The total number of measured struts was 4951, including
1463 (30%) in SES, 1522 (31%) in PES, and 1966 (39%) in ZES. The average distances between the lumen and stent were different, and the SES was significantly longer than the other stents (188 ± 46 in SES, 144 ± 18 in PES, 127 ± 34 in ZES, p = 0.00) (Fig. 2). The numbers of malap- position struts were 28% in SES, but only 11% in PES and 10% in ZES; the malapposition rates of SES were signi- ficantly higher than those of the other two stents (Fig. 3).
The rate of malapposition of 5 patients who had malap- position in IVUS showed 32% in strut level by OCT but, 12% in 19 patients who had not and this is statistically
Table 4. Malapposition Rates in Optical Coherence Tomography (OCT) according to the Results of Intravascular Ultrasound (IVUS)
Parameters Malapposition in IVUS No malapposition in IVUS
p value
(n = 5) (n = 19)
Total struts by OCT, n 233 ± 44 199 ± 77 0.36
Number of malapposition struts, n 73 ± 16 26 ± 16 0.00
Malapposition rate, % 32 ± 5 12 ± 6 0.00
OCT, optical coherence tomography; IVUS, intravascular ultrasonography.
Values are presented as means ± SD or percentages.
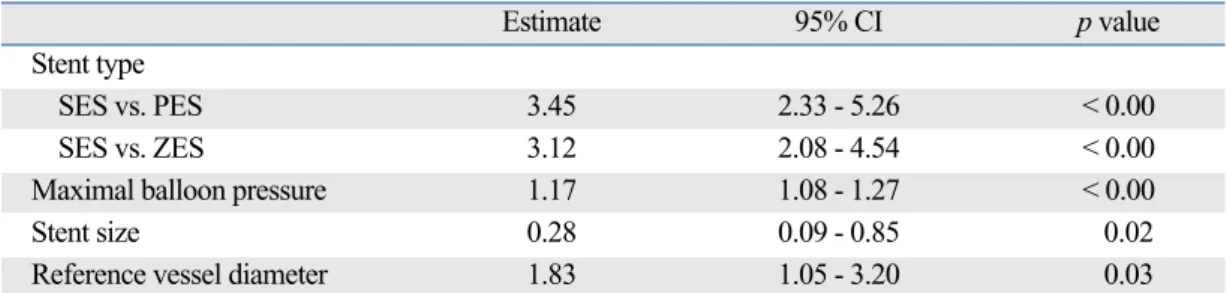
Table 5. Multivariate Predictors of Malapposed Struts
Estimate 95% CI p value
Stent type
SES vs. PES 3.45 2.33 - 5.26 < 0.00
SES vs. ZES 3.12 2.08 - 4.54 < 0.00
Maximal balloon pressure 1.17 1.08 - 1.27 < 0.00
Stent size 0.28 0.09 - 0.85 0.02
Reference vessel diameter 1.83 1.05 - 3.20 0.03
ZES, zotarolimus-eluting stent; MLD, minimal luminal diameter; PCI, percutaneous coronary intervention; SES, sirolimus-eluting stent.
Independent predictors of malapposed strut was identified using mixed effect multivariate logistic analysis after controlling age, gender, diabetes, stent type (SES versus non-SES), stent size, stent length, reference vessel diameter, minimal luminal diameter and maximum inflation pressure.
Fig. 2. Average distances between lumen and stent. *Represents statistical significance (p = 0.00). Definition of incomplete stent apposition: ≥ 160 µm for SES, ≥ 130 µm for PES, ≥ 110 µm for ZES. SES, sirolimus-eluting stent; PES, paclitaxel-eluting stent; ZES, zotarolimus-eluting stent.7
Fig. 3. Comparison of malapposition strut numbers according to stent.
*Represents statistical significance (p = 0.00), �indicates non-significant results (p = 0.81). Definition of malapposition: ≥ 160 µm for SES, ≥ 130 µm for PES, ≥ 110 µm for ZES.7SES, sirolimus-eluting stent; PES, paclitaxel-eluting stent; ZES, zotarolimus-eluting stent.
significant (32 ± 5% vs. 12 ± 6%, p = 0.00) (Table 4).
If we consider the definition of stent malapposition in OCT as having malapposed struts over 10% in all struts, the malapposition rate was 67% (16/24) or if over 5%, 83%
(20/24) or if any malapposition, 100% (24/24). Regarding sensitivity of OCT as 100%, that of IVUS could be calcul- ated as 33%.
The intra-observer correlation coefficient between varia- bility of observer1 was 0.981 (95% CI: 0.975-0.985) using the one-way mixed model, where patient effects are random.
The inter-observer correlation coefficient between the variability of two observers using the two-way mixed mo- del, where patient effects are random and observers effects are fixed, were 0.982 (95% CI: 0.977-0.986) and 0.983 (95% CI: 0.978-0.987), respectively. Multivariate predic- tors of malapposed stent struts on mixed effect logistic regression analysis are shown in Table 5. The use of SES was an independent predictor of malapposed struts toge- ther with large reference vessel diameter, small stent size and high maximal pressure.
This may be the first report assessing initial malapposition in STEMI patients undergoing primary PCI by OCT. The major findings of this paper indicate that the considerable rates of malapposition using OCT were detected during primary PCI in STEMI patients treated with DES and total malapposition rates were 17% but malapposition rates in SES were significantly higher than those of other DESs (28% in SES vs. 11% in PES vs. 10% in ZES, p = 0.00).
SES was also an independent predictor of a malapposed strut after controlling the patients and lesion factors.
The frequency of initial stent malapposition by IVUS was previously reported and the rates from the results had such a wide range that one study showed the rates were as low as 8.7% in SES and 2.4% in PES, but another studies showed 16% in SES, 19% in SES and 12.6% in ZES.
9,12,13However, previous reports have a heterogeneous study population from stable angina to acute myocardial infarc- tion. We performed IVUS before OCT in all patients performing primary PCI diagnosed as STEMI, therefore, the initial rates of malapposition on IVUS seemed to be relatively higher than those of the above mentioned report (21% vs. 11 to 19%). Also these variable rates of malappo- sition might be affected due to unique characteristics of each stent like strut thickness. This malapposition rate on IVUS was comparable with OCT findings although there was somewhat different method of measurement (21% in IVUS vs. 16% in OCT). But, IVUS cannot measure stent struts more accurately than OCT, because the IVUS resolu-
tion to evaluate each strut of a stent compared to OCT is limited.
OCT can accurately measure the intima-media thickness and identify fine abnormal structures such as detailed components of coronary atherosclerotic plaques, hema- toma, dissection, intra-stent tissue prolapse, stent fracture, and stent malapposition.
14-17The present study implies specific subsets of patients with STEMI after primary PCI with OCT. Although SES is effective in preventing reste- nosis, currently their safety has been questioned and many defects such as stent fractures and malapposition have been challenging. Therefore, initial malapposition might be possible to be relate to late clinical outcomes of SES.
Although we do not know the clinical implication of initial malapposition, it is certain that this finding is too signifi- cant to pass over and could not exclude the association with late clinical adverse events such as stent thrombosis through the inhibition of healthy endothelial cell growth and neointimal coverage of stent strut. Given that SES has a relatively stronger and thicker stent strut body than other stents, malapposition may occur more often; nevertheless, high pressure is applied. This finding suggests that malap- position might have a role to retard the neointimal growth addition to the effects of the immunosuppressant drug and polymer because SES have been know to reduced the significantly neointima than other DESs. These concepts were also evidenced by Tanigawa, et al.
11They showed that despite angiographic optimization with high pressures and adequately sized balloons, malapposed stent struts are frequently found in implantation of Cypher Select stents which have a thicker stent strut and closed cell design.
Therefore, the present study suggests that a close clinical follow-up and strict dual anti-platelet therapy may be necessary to prevent the cardiac events after DES implan- tation in STEMI because vulnerability could remain even in successful treatment with DES.
One limitations of this study is that only the initial period after the stent was evaluated. Therefore, the follow-up OCT and clinical finding are needed to investigate and although this was not performed in the current study it is now in progress. Another limitation is the number of pa- tients, which was fairly small and there is the possibility of selection bias, although the measured strut number was quite large. However, we believe that this study is valuable because it is the first report about the initial extent of malapposition of DES using OCT during primary PCI.
Another limitation is that this malapposition observed within 72 hours after stenting may be associated with procedural issues. However, we performed a primary PCI by one fully experienced operator and the procedures including balloon- ing or high pressure before and after stenting were also standardized in all patients to reduce errors.
DISCUSSION
In conclusion, considerable rates of malapposition were detected in STEMI after primary PCI with DES implan- tation and OCT can be a useful tool for finding an initial malapposition.
Furthermore, follow-up clinical, angiographic, and OCT findings of stent malapposition are needed to evaluate the clinical implications and fate of initial stent malapposition in STEMI after primary PCI.
The authors thank to Dr. Masamichi Takano (Nippon Medi- cal Center) for special support of the data measurement and analysis. This study was supported by a faculty research grant of Yonsei University College of Medicine for 2007 and by Yonsei University Research Fund of 2007.
.
1. Takano M, Inami S, Jang IK, Yamamoto M, Murakami D, Seimiya K, et al. Evaluation by optical coherence tomography of neointimal coverage of sirolimus-eluting stent three months after implantation. Am J Cardiol 2007;99:1033-8.
2. Bouma BE, Tearney GJ, Yabushita H, Shishkov M, Kauffman CR, DeJoseph Gauthier D, et al. Evaluation of intracoronary stenting by intravascular optical coherence tomography. Heart 2003;89:317-20.
3. Yabushita H, Bouma BE, Houser SL, Aretz HT, Jang IK, Schlendorf KH, et al. Characterization of human atherosclerosis by optical coherence tomography. Circulation 2002;106:1640-5.
4. Jang IK, Tearney GJ, MacNeill B, Takano M, Moselewski F, Iftima N, et al. In vivo characterization of coronary atherosclero- tic plaque by use of optical coherence tomography. Circulation 2005;111:1551-5.
5. Diaz-Sandoval LJ, Bouma BE, Tearney GJ, Jang IK. Optical coherence tomography as a tool for percutaneous coronary inter- ventions. Catheter Cardiovasc Interv 2005;65:492-6.
6. Uren NG, Schwarzacher SP, Metz JA, Lee DP, Honda Y, Yeung AC, et al. Predictors and outcomes of stent thrombosis: an intra-
vascular ultrasound registry. Eur Heart J 2002;23:124-32.
7. Cutlip DE, Baim DS, Ho KK, Popma JJ, Lansky AJ, Cohen DJ, et al. Stent thrombosis in the modern era: a pooled analysis of multicenter coronary stent clinical trials. Circulation 2001;103:
1967-71.
8. Cheneau E, Leborgne L, Mintz GS, Kotani J, Pichard AD, Satler LF, et al. Predictors of subacute stent thrombosis: results of a systematic intravascular ultrasound study. Circulation 2003;108:
43-7.
9. Hong MK, Mintz GS, Lee CW, Park DW, Park KM, Lee BK, et al. Late stent malapposition after drug-eluting stent implantation:
an intravascular ultrasound analysis with long-term follow-up.
Circulation 2006;113:414-9.
10. Tanigawa J, Barlis P, Di Mario C. Intravascular optical coherence tomography: optimisation of image acquisition and quantitative assessment of stent strut apposition. Euro Intervention 2007;
3:128-36.
11. Tanigawa J, Barlis P, Dimopoulos K, Dalby M, Moore P, Di Mario C. The influence of strut thickness and cell design on immediate apposition of drug-eluting stents assessed by optical coherence tomography. Int J Cardiol 2009;134:180-8.
12. Miyazawa A, Ako J, Hongo Y, Hur SH, Tsujino I, Courtney BK, et al. Comparison of vascular response to zotarolimus-eluting stent versus sirolimus-eluting stent: intravascular ultrasound results from ENDEAVOR III. Am Heart J 2008;155:108-13.
13. Ako J, Morino Y, Honda Y, Hassan A, Sonoda S, Yock PG, et al.
Late incomplete stent apposition after sirolimus-eluting stent implantation: a serial intravascular ultrasound analysis. J Am Coll Cardiol 2005;46:1002-5.
14. Kume T, Akasaka T, Kawamoto T, Watanabe N, Toyota E, Neishi Y, et al. Assessment of coronary intima--media thickness by optical coherence tomography: comparison with intravascular ultrasound. Circ J 2005;69:903-7.
15. Shite J, Matsumoto D, Yokoyama M. Sirolimus-eluting stent fracture with thrombus, visualization by optical coherence tomo- graphy. Eur Heart J 2006;27:1389.
16. Jang IK, Bouma BE, Kang DH, Park SJ, Park SW, Seung KB, et al. Visualization of coronary atherosclerotic plaques in patients using optical coherence tomography: comparison with intravas- cular ultrasound. J Am Coll Cardiol 2002;39:604-9.
17. Sawada T, Shite J, Shinke T, Watanabe S, Otake H, Matsumoto D, et al. Persistent malapposition after implantation of sirolimus- eluting stent into intramural coronary hematoma: optical coherence tomography observations. Circ J 2006;70:1515-9.