Apical hypertrophic cardiomyopathy was first reported by Sakamoto of Japan in 1976.1 As one of the hypertrophic cardiomyopathies, it is char- acterized by myocardial hypertrophy limited to the left ventricular apex, a giant T wave inversion
(T wave inversion ≥ 10 mm) in precordial leads, and a spade shape at the end of diastolic phase of left ventricle due to severe hypertrophy of the left ventricle.2 According to recent guidelines, it is indicated by a myocardial thickness greater than Original Article
The association between T wave inversion and apical hypertrophic cardiomyopathy
Cheol Byoung Chae1, Ju Hee Ha1, Jun Ho Kim1, Jae Joon Lee1, Han Il Choi1, Ki Beom Park1, Jin Hee Kim1, Jung Hyun Choi2
1Division of Cardiology, Department of Internal Medicine, Busan medical center, Busan, Korea
2Division of Cardiology, Department of Internal Medicine, Pusan National University Hospital, Busan, Korea
Objectives: Electrocardiograhy (ECG) is the first step in hypertrophic cardiomyopathy (HCMP) diagnosis. For various reasons, the T wave inversion (TWI) and ECG change with time and HCMP is not easy to diagnosis.
The aim of this retrospective study was to investigate the association between TWI on ECG and apical HCMP.
Methods: A total of 4,730 ECGs presenting TWI from January 2011 to March 2013 in Pusan National University Hospital were enrolled. 133 patients who were examined by both echocardiography and coronary angiogram were analyzed. Patients were divided into two groups: Group A (TWI ≥ 10 mm) and Group B (5 mm ≤ TWI
< 10 mm). HCMP is defined by a wall thickness ≥ 15mm in one or more LV myocardial segments. Apical HCMP is defined to be hypertrophy that is confined to LV apex. The patients who had ECGs with at least one month interval were divided 3 groups: Normal T wave, Abnormal T wave, and Persistent TWI. The prevalence of Apical HCMP and coronary artery disease (CAD) was reviewed among the three groups.
Results: In this study there were a total 133 patients, with patients divided into Group A which had 15 patients and Group B which had 118 patients. Among the 23 patients with apical HCMP, three patients were Group A and twenty patients were Group B (P = 0.769). Regarding constancy of TWI, persistent TWI group was higher in apical HCMP than in other groups (P = 0.038). CAD had no difference between groups (P = 0.889).
Conclusions: T wave negativity was not associated with incidence of apical HCMP. However, apical HCMP was diagnosed more frequently in patients with persistent TWI. Further follow up echocardiographic study is needed to evaluate the progression of apical HCMP in patients with TWI.
Key Words: Coronary artery disease, Echocardiography, Electrocardiography, Hypertrophic cardiomyopathy, T wave inversion
Corresponding Author: Jung Hyun Choi, Department of Internal Medicine, Pusan National University Hespital, 179, Gudeok-ro, Seo-gu, Busan 49241, Korea
Tel: +82-51-240-7514 Fax: +82-51-240-7765 E-mail: [email protected]
Received:
Revised:
Accepted:
Sep. 21, 2016 Oct. 16, 2016 Oct. 25, 2016
Articles published in Kosin Medical Journal are open-access, distributed under the terms of the Creative Commons Attribution Non-Commercial License (http://creativecommons.org/licenses/by-nc/4.0/) which permits unrestricted non-commercial use, distribution, and reproduction in any medium, provided the original work is properly cited.
15 mm on any imaging tests and is indescribable with other underlying disease.3
Apical hypertrophic cardiomyopathy has been reported to have a relatively positive prognosis.
However, according to recent studies, clinical complications such as atrial fibrillation, ven- tricular arrhythmia,4,5 myocardial infarction and stroke may occur.6 Therefore, the importance of early diagnosis and active treatment of apical hyper- trophic cardiomyopathy is increasingly evident.
T wave inversion on electrocardiography is a characteristic finding of apical hypertrophic car- diomyopathy but T wave inversion can be caused by cardiac or non-cardiac causes.7 In addition, T wave inversion may not occur in all apical hyper- trophic cardiomyopathy.8 The purpose of this study was to investigate the role of electro- cardiography in the diagnosis of patients with ap- ical hypertrophic cardiomyopathy by examining the association between T wave inversion and ap- ical hypertrophic cardiomyopathy.
MATERIALS AND METHODS
Among the electrocardiographs (ECGs) per- formed at the Pusan National University Hospital from January 2011 to March 2013, 4730 ECGs showing T wave inversion from 292 patients were reviewed retrospectively. T wave inversion was defined as the deepest area of the T wave ampli- tudes with 5 mm or more inversion in the JT seg-
mentioned, there were 292 patients who had T wave measurements meeting the above conditions.
Among them, 224 patients (76%) underwent echo- cardiography and 151 patients (51.5%) underwent angiocardiography. 133 patients had both tests and this group were selected in this study.
Patients in this group were divided into two groups depending on the degree of T wave in- version: Group A (T wave inversion ≥ 10 mm) and Group B (T wave inversion ≥ 5 mm). For all 133 patients, the current ECG was compared with pre- vious ECG patterns. Previous ECGs had an interval of at least one month and were divided into:
Normal T wave (Normal), Abnormal T wave (Not a T wave inversion of 5 mm or more but abnor- mal), Persistent TWI (With the same T wave in- version), and 30 cases where no previous ECG was performed (Fig. 1).
Arrhythmia is defined as ventricular and atrial arrhythmia, and valvular disease is defined as moderate to severe reflux or stricture. Non-car- diac disease is defined as any disease other than cardiac disease for main treatment at the time of ECG. In addition, the association between T wave inversion and coronary artery disease, which is one of the common causes of T wave inversion, was analyzed. Coronary artery disease was defined as the presence of more than 50%
of coronary stenosis on the angiocardiography or tomographic images.
Transthoracic Echocardiography
trophic cardiomyopathy was defined as when my- ocardial hypertrophy was limited to the cardiac apex and the end-diastolic thickness was 15 mm.
For echocardiography an iE33 (Phillips Medical System, Andover, MA, USA) or an ACUSON SC 2000 (Siemens Medical Solutions USA Inc., Mountain View CA) were used.
Statistical Analysis
Continuous variables were expressed as mean
± SD and categorical variables were expressed as percentage (%). For statistics, the chi square test or fisher’s exact test was used. A p-value of
≤ 0.05 was considered as statistically significant.
SPSS 18.0 (IBM Corp. Armonk, NY, USA) was used for statistical analysis.
RESULTS
Basic Clinical Characteristics (Table 1).
Of the 133 patients, 81 patients were male and the mean age was 67.62 ± 9.91 years. Of them, there were 15 patients with 10 mm or greater T wave inversion, 10 patients with 5 mm or greater, and 118 patients with 10 mm or less. Arrhythmia was observed in 11 patients, including atrial fi- brillation (9 patients), complete atrioventricular block (1 patient) and sick sinus syndrome (1 pa- tient). Valvular disease was observed in 13 pa- tients, including aortic valve regurgitation (3 pa- tients), aortic stenosis due to a bicuspid aortic valve (2 patients), tricuspid valve regurgitation (3 patients), mechanical valve (1 patient), or mitral regurgitation (4 patients).
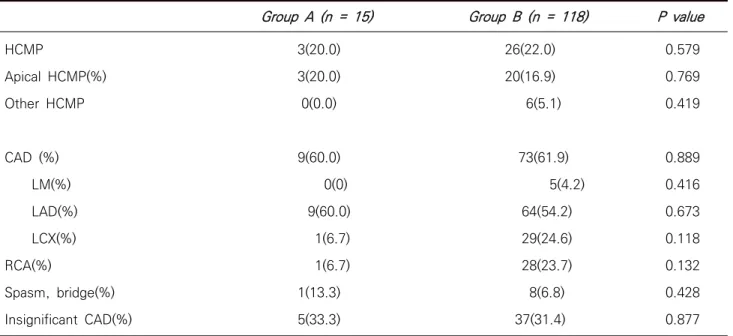
T Wave Inversion and Apical Hypertrophic Cardiomyopathy and Coronary Artery Disease (Table 2).
Patients who showed apical hypertrophic car- diomyopathy on transthoracic echocardiography consisted of 3 patients (20%) in Group A and 20 Fig. 1. Persistent TWI
patients (16.9%) in Group B (P = 0.769). Patients with coronary artery disease on angiocardiog- raphy consisted of 9 patients (60%) in Group A and 73 patients (61.9%) in Group B (P = 0.889).
The prevalence of apical hypertrophic car-
continuous ECG changes (Table 3).
Of 23 patients with apical hypertrophic car- diomyopathy, three patients (13%) showed Normal T wave and three patients (13%) showed abnormal T wave. Eleven patients (47.8%) showed Persistent TWI, which was statistically significant Group A (n = 15) Group B (n = 118) P value
Age (years) Male (%) DM (%) HTN (%) Arrhythmia (%) VHD (%)
Vascular disease (%) Non cardiac disease (%)
67.9 ± 9.7 10(66.7) 3(20) 5(33.3) 0(0) 0(0) 2(13.3)
5(33.3)
65.8 ± 11.9 71(60.2) 25(21.2) 53(44.9) 11(9.3) 13(11.0) 11(9.3) 31(26.3)
0.451 0.630 0.916 0.398 0.220 0.179 0.625 0.565 DM ; diabetes mellitus, HTN ; hypertension, VHD ; valvular heart disease
Table 1. Basic characteristics
Group A (n = 15) Group B (n = 118) P value
HCMP
Apical HCMP(%) Other HCMP
CAD (%) LM(%) LAD(%) LCX(%) RCA(%)
Spasm, bridge(%) Insignificant CAD(%)
3(20.0) 3(20.0) 0(0.0)
9(60.0) 0(0) 9(60.0) 1(6.7) 1(6.7) 1(13.3) 5(33.3)
26(22.0) 20(16.9) 6(5.1)
73(61.9) 5(4.2)
64(54.2) 29(24.6) 28(23.7) 8(6.8) 37(31.4)
0.579 0.769 0.419
0.889 0.416 0.673 0.118 0.132 0.428 0.877 HCMP ; hypertrophic cardiomyopathy, CAD ; coronary artery disease, LCA ; left coronary artery, LM ; left main, LAD ; left anterior descending artery, LCX ; left circumflex artery, RCA ; right coronary artery
Table 2. The prevalence of apical HCMP and CAD in patients with TWI
diomyopathy (P = 0.038).
Of the 133 patients, 36 patients were not diag- nosed with either apical hypertrophic cardiomy- opathy or coronary artery disease and among them, 9 patients (25%) showed persistent TWI.
The median follow-up period of ECG was 29
± 38.4 months.
DISCUSSION
Apical hypertrophic cardiomyopathy is a type of hypertrophic cardiomyopathy, in which my- ocardial hypertrophy is limited to the cardiac apex. On ECG, giant T wave inversion in pre- cordial leads and high voltage QRS waves were observed, and it was characterized by a spade shape in left ventriculography.1 In many studies, the giant T wave inversion is defined as ≥ 10 mm of the inverted T wave in any leads.9
Since some of the patient’s symptoms include chest pain, dyspnea and palpitation which are similar to angina pectoris, this sometimes causes confusion in the diagnosis. In these patients, my-
ocardial ischemia may occur, although coronary angiography may be normal. Myocardial ischemia is a small vessel disorder with reduced ability for vasodilation, and it is also explained as an im- balance of demand and supply, delayed relaxation of myocardium, reduction of coronary perfusion pressure, and a reduced ratio of capillary and my- ocardial fibers.10,11
Of the hypertrophic cardiomyopathies, apical hypertrophic cardiomyopathy exhibits relatively positive prognosis, but the risk of acute cardiac arrest, fatal arrhythmia, heart failure and ische- mia is increased.6 In Japan, there is a concern that fatal arrhythmia such as ventricular tachy- cardia is also more likely to occur.5
Many diagnostic tools have been used to avoid these risks, but there is no optimal standard diag- nostic method. Echocardiography is widely used for all kinds of hypertrophic cardiomyopathy in- cluding apical hypertrophic cardiomyopathy.12 Apical hypertrophic cardiomyopathy is diagnosed when the thickness of cardiac apex is > 15 mm on any type of imaging tests.3 Recently, it has been shown that the thickness of the myocardium can Apical HCMP (n = 23) No apical HCMP (n = 110) P value
Previous ECG
Normal ECG (%) Abnormal ECG (%) Same T inversion (%) No previous exam (%)
3(13.0) 3(13.0) 11(47.8)
6(26.1)
31(28.2) 31(28.2) 24(21.8) 24(21.8)
0.038
ECG ; electrocardiogram, HCMP ; hypertrophic cardiomyopathy Table 3. The serial change of ECGs in patients with apical HCMP
be accurately measured by cardiac magnetic reso- nance imaging, and even if there is fibrosis of the myocardium, it accurately represents the ana- tomical features.13 It has also been reported that the use of contrast enhanced echocardiography can improve the diagnostic accuracy of patients with apical hypertrophic cardiomyopathy.11
Although there are diagnostic methods avail- able using these various imaging techniques, sometimes ECG abnormalities may be the first and only diagnostic method.8 However, the diseases associated with T wave inversion are many and diverse such as: left ventricular anterior wall is- chemia, acute central nervous system diseases,7 stress myocardial infarction,14 pulmonary ede- ma,15 antiarrhythmics,16 pulmonary embolism,17 cardiac memory due to temporary tachycardia, after pacing,9 and use of cocaine.18 Therefore, it is necessary to analyze the T wave inversion which is the main characteristic of apical hypertrophic cardiomyopathy.
The mechanism by which T wave inversion oc- curs on electrocardiogram is uncertain in apical hypertrophic cardiomyopathy. However, its cause may be attributed to secondary repolarization due to myocardial hypertrophy, myocardial ischemia and metabolic demands due to the hyperdynamic left ventricle.19
There are several studies on the relationship between T wave inversion of ECG and apical hy- pertrophic cardiomyopathy, but the relation is unclear. There was a study reported that the abso-
termines the degree of T wave inversion.20 Another study showed that the ratio of left ven- tricular apex/septal wall thickness and cardiac apex/basal myocardial mass ratio were higher in apical hypertrophic cardiomyopathy with giant T wave inversion.21 According to a study published by Morimoto et al., 43.9% of patients with giant T wave inversion showed the spade shape on ven- triculography, and in patients with no T wave in- version, only 7% had apical hypertrophic cardiomyopathy.22 However, in another recent study, T wave inversion was not found to be an absolute factor in the diagnosis of apical hyper- trophic cardiomyopathy.8
Because it is important to diagnose apical hy- pertrophic cardiomyopathy in a noninvasive and easy was, this study was designed using electro- cardiogram and echocardiography. Patients with suspected apical hypertrophic cardiomyopathy were screened by electrocardiogram and this was compared with the echocardiographic findings.
Since clinically the most commonly considered cause of T wave inversion is coronary artery dis- ease, its incidence was also analyzed.
The absolute value of T wave inversion was not a significant index for diagnosing apical hyper- trophic cardiomyopathy, but the prevalence of apical hypertrophic cardiomyopathy was higher in patients group with T wave inversion.
In addition, ECG changes according to various clinical conditions, but there is a lack of analysis on continuous ECG changes. Most previous stud-
version was lost or not seen in apical hypertrophic cardiomyopathy. As shown in Table 3, among 23 patients with hypertrophic cardiomyopathy, there were 6 patients with normal T wave and abnormal T wave in the previous ECG results. In all of these cases, the echocardiogram showed hy- pertrophic cardiomyopathy from the time of ob- servation, and there was no case of newly devel- oped hypertrophic cardiomyopathy following a previously diagnosed normal condition. Among them, one patient had flat T wave, which showed severe stenosis in three coronary arteries and left ventricular systolic dysfunction. Two patients had right heart failure and right atrial enlargement ac- companied by severe tricuspid regurgitation. One patient had a bicuspid aortic valve which looked like severe aortic stenosis. In other studies, the long-term follow-up showed that the absolute value of the giant T wave inversion was decreased with the occurrence of accompanying disease such as loss of giant T wave inversion, ischemic heart disease, dilated cardiomyopathy and de- creased cardiac contractility,23 and follow-up studies using magnetic resonance imaging showed a decrease in the absolute value of the T wave inversion when myocardial hypertrophy was moved from cardiac apex to base.24
In patients with T wave inversion, 36 patients had neither apical hypertrophic cardiomyopathy nor coronary artery disease, and 9 of those pa- tients had continuous T wave inversion. These pa- tients may have developed an apical hypertrophic cardiomyopathy, so close follow-up is needed.
For T wave inversion, persistence was related to the prevalence of apical hypertrophic car- diomyopathy, not severity. However, change to the T wave inversion is also significant because it has the possibility of developing into apical hy- pertrophic cardiomyopathy. Therefore, for pa- tients with T wave inversion on ECG, an echo- cardiography follow-up should be required and performed consecutively.
The limitations of this study include the follow- ing: repeat tests were not performed in consid- eration of the variability of ECG over time; in the comparison of multiple electrocardiograms, echocardiography was not performed repeatedly;
data on other characteristics such as symptoms according to retrospective studies was not ob- tained; ECG readout was carried out by one inves- tigator; and the study did not consider the con- sistency of interobservers and intraobservers.
REFERENCES
1. Sakamoto T, Tei C, Murayama M, Ichiyasu H, Hada Y. Giant T wave inversion as a manifestation of asymmetrical apical hypertrophy (AAH) of the left ventricle. Echocardiographic and ultra- sono-cardiotomographic study. Jpn Heart J 1976;17:611–29.
2. Yamaguchi H, Ishimura T, Nishiyama S, Nagasaki F, Nakanishi S, Takatsu F, et al. Hypertrophic nonobstructive cardiomyopathy with giant neg- ative T waves (apical hypertrophy): ventriculo-
graphic and echocardiographic features in 30 patients. Am J Cardiol 1979;44:401–12.
3. Authors/Task Force members, Elliott PM, Anastasakis A, Borger MA, Borggrefe M, Cecchi F, et al. 2014 ESC Guidelines on diagnosis andma- nagement of hypertrophic cardiomyopathy: the Task Force for the Diagnosis and Management of Hypertrophic Cardiomyopathy of the European Society of Cardiology (ESC). Eur Heart J 2014;35:2733-79.
4. Chaturvedi H. Apical hypertrophic cardiomyop- athy with hemodynamically unstable ventricular arrhythmia – atypical presensation EC cardiology 2015;2:106-10.
5. Okishige K, Sasano T, Yano K, Azegami K, Suzuki K, Itoh K. Serious arrhythmias in patients with apical hypertrophic cardiomyopathy. Intern Med 2001;40:396-402.
6. Eriksson MJ, Sonnenberg B, Woo A, Rakowski P, Parker TG, Wigle ED, et al. Long-term out- come in patients with apical hypertrophic cardiomyopathy. J Am Coll Cardiol 2002;39:638–
45.
7. Said SA, Bloo R, de Nooijer R, Slootweg A. Cardiac and non-cardiac causes of T-wave inversion in the precordial leads in adult subjects: A Dutch case series and review of the literature. World J Cardiol 2015;7:86-100.
8. Flett AS, Maestrini V, Milliken D, Fontana M, Treibel TA, Harb R, et al. Diagnosis of apical hypertrophic cardiomyopathy: T-wave inversion and relative but not absolute apical left ventricular
9. Hanna EB, Glancy DL. ST-segment depression and T-wave inversion: classification, differential diagnosis, and caveats. Cleve Clin J Med 2011;78:404-14.
10. Koga Y, Itaya K, Toshima H. Prognosis in hy- pertrophic cardiomyopathy. Am Heart J 1984;108:351-9.
11. Moon J, Cho IJ, Shim CY, Ha JW, Jang Y, Chung N, et al. Abnormal myocardial capillary density in apical hypertrophic cardiomyopathy can be as- sessed by myocardial contrast echocardiography.
Circ J 2010;74:2166-72.
12. Maron BJ, Olivotto I, Spirito P, Casey SA, Bellone P, Gohman TE, et al. Epidemiology of hyper- trophic cardiomyopathy-related death: revisited in a large non-referral-based patient population.
Circulation 2000;102:858–64.
13. Noureldin RA, Liu S, Nacif MS, Judge DP, Halushka MK, Abraham TP, et al. The diagnosis of hyper- trophic cardiomyopathy by cardiovascular mag- netic resonance. J Cardiovasc Magn Reson 2012;14:17.
14. Wittstein IS, Thiemann DR, Lima JA, Baughman KL, Schulman SP, Gerstenblith G, et al.
Neurohumoral features of myocardial stunning due to sudden emotional stress. N Engl J Med 2005;352:539-48.
15. Pascale P, Quartenoud B, Stauffer JC. Isolated large inverted T wave in pulmonary edema due to hypertensive crisis: a novel electrocardio- graphic phenomenon mimicking ischemia? Clin Res Cardiol 2007;96:288-94.
agent. Am J Crit care 2002;11:395-6.
17. Pillarisetti J, Gupta K. Giant Inverted T waves in the emergency department: case report and review of differential diagnoses. J Electrocardiol 2010;43:40-2.
18. Dhawan SS. Pseudo-Wellens’ syndrome after crack cocaine use. Can J Cardiol 2008;24:404.
19. Satoh H, Matoh F, Shiraki K, Saitoh T, Odagiri K, Saotome M, et al. Delayed enhancement on cardiac magnetic resonance and clinical, mor- phological, and electrocardiographical features in hypertrophic cardiomyopathy. J Card Fail 2009;15:419–27.
20. Nishiyama S, Shiratori K, Nishimura S, Araki R, Takeda K, Nagasaki F, et al. [Correlation between left ventricular wall thickness and the depth of negative T waves in apical hypertrophic car- diomyopathy]. J Cardiogr 1984;14:281-8.
21. Anzai T. [A study on the pattern of myocardial distribution and its relationship to the genesis
of giant negative T wave in patients with hyper- trophic cardiomyopathy]. Hokkaido Igaku Zasshi 1990;65:170–7.
22. Morimoto S, Sekiguchi M, Hasumi M, Inagaki Y, Takimoto H, Ohtsubo K, et al. [Do giant negative T waves represent apical hypertrophic cardiomy- opathy? Left ventriculographic and cardiac biop- sy studies]. J Cardiogr Suppl 1985;6:35-51.
23. Horita Y, Konishi K, Osato K, Nakao T, Namura M, Kanaya H, et al. [Regression of giant negative T waves in hypertrophic cardiomyopathy: cases simulating either dilated cardiomyopathy or se- vere coronary artery stenosis.] J Cardiol 1988;18:875-85.
24. Usui M, Inoue M, Suzuki J, Watanabe F, Sugimoto T, Nishikawa J. Relationship between distribution of hypertrophy and electrocardiographic changes in hypertrophic cardiomyopathy. Am Heart J 1993;126:177.