Original Article
Received: Jun 20, 2015; Revised: Jun 28, 2015; Accepted: Jun 29, 2015 Correspondence to: Kang Su Cho
Department of Urology, Gangnam Severance Hospital, Yonsei University College of Medicine, 211 Eonju-ro, Gangnam-gu, Seoul 06273, Korea.
Tel: +82-2-2019-3471, Fax: +82-2-3462-8887, E-mail: [email protected] Copyright © 2015 Korean Society for Sexual Medicine and Andrology
This is an Open Access article distributed under the terms of the Creative Commons Attribution Non-Commercial License (http://creativecommons.
org/licenses/by-nc/4.0) which permits unrestricted non-commercial use, distribution, and reproduction in any medium, provided the original work is properly cited.
Seasonal Variation of Urinary Symptoms in Korean Men with Lower Urinary Tract Symptoms and Benign Prostatic Hyperplasia
Ho Chul Choi1,3, Jong Kyu Kwon2,3, Joo Yong Lee2,3, Jang Hee Han1,3, Hae Do Jung2,3, Kang Su Cho1,3
1Department of Urology, Gangnam Severance Hospital, 2Department of Urology, Severance Hospital, 3Urological Science Institute, Yonsei University College of Medicine, Seoul, Korea
Purpose: To examine seasonal variations in urinary symptoms in Korean men with lower urinary tract symptoms and benign prostatic hyperplasia (LUTS/BPH).
Materials and Methods: Records were obtained from a consecutive database of LUTS/BPH patients from March 2010 to February 2014. A total of 1,185 patients were suitable for analysis. The International Prostate Symptom Score (IPSS), uroflowmetric parameters, prostate volume-related parameters, and serum prostate-specific antigen levels were evaluated.
Results: Based on the month during which they were examined, patients were categorized into cold, hot, or intermediate season groups. The IPSS score was significantly different between the cold and the hot season groups (17.3±6.9 vs. 16.1±7.4, respectively; p=0.020). Storage symptom scores were significantly aggravated in the cold (6.8±3.3; p=0.030) and intermediate groups (6.9±3.5; p=0.032) compared with the hot season group (6.3±3.4), with this observation primarily driven by the individual scores for frequency and urgency. Quality of life (QOL) scores were worse in the cold compared with the hot season group (4.0±1.1 vs. 3.8±1.1, respectively; p=0.012). There were also significant differences between the cold and hot season groups in voided volume (278.7±148.5 vs. 255.9±145.1, respectively; p=0.034) and postvoid residual volume (26.4±37.6 vs.
32.2±41.0, respectively; p=0.039).
Conclusions: Different urinary symptoms and uroflowmetric parameters were associated with changes in seasons. QOL and IPSS parameters might be worse in cold weather seasons compared with hot weather seasons.
Key Words: Lower urinary tract symptoms; Prostatic hyperplasia; Seasons
INTRODUCTION
Lower urinary tract symptoms and benign prostatic hy- perplasia (LUTS/BPH) are common conditions, partic- ularly in elderly men, that negatively impact patients’
quality of life (QOL) [1-3]. Various factors including sen- sory bladder disorders, detrusor overactivity, and sphinc- teric weakness can provoke LUTS [4,5]. Many urologists and physicians believe that LUTS can also be affected by seasonal variation and, in particular, get worse in cold
http://dx.doi.org/10.5534/wjmh.2015.33.2.81
weather. This phenomenon has several explanations. The increased sympathetic activity caused by cold stress can stimulate the contraction of smooth muscle within the prostate [6,7]. In addition, cold stress detrusor overactivity and causes a decrease in the voiding interval and voiding volume [8,9].
However, there have been only a few clinical studies that have addressed the relationship between seasonal var- iation and LUTS/BPH symptoms, and their results are con- tradictory [10-12]. A community-based study designed by Yoshimura et al [10] revealed that winter was an in- dependent risk factor for urinary frequency and urgency and nocturia. However, Cartwright et al [12] reported no sig- nificant variation in urinary symptom scores and uro- flowmetric parameters with changes in season. Meanwhile, Watanabe et al [11] demonstrated that maximum urine flow rate (Qmax) could be influenced by seasonal changes in temperature but reported no seasonal difference in uri- nary symptom scores. To further elucidate the impact of seasonal variation on urinary symptom scores and uro- flowmetric parameters, we report the results of an analysis of seasonal effects in Korean men with LUTS/BPH who were selected from a large population database.
MATERIALS AND METHODS
1. Patients
A retrospective analysis was performed using a database of 1,392 consecutive patients with LUTS/BPH who visited the outpatient clinic at Severance Hospital from March 2010 to February 2014. The patients’ records were re- viewed and individual medical histories were obtained.
We excluded patients who had the following conditions:
(1) neurologic disease that could affect voiding symptoms, (2) current urinary tract infection, (3) previous history of ra- diotherapy of the pelvis, (4) clinically apparent bladder or prostate cancer, and (5) uncontrolled diabetes mellitus. A total of 1,185 patients were suitable for the final analysis.
Gangnam Severance Hospital Institutional Review Board approved this study protocol.
2. Lower urinary tract symptoms and uroflowmetry The urinary symptoms of the patients were assessed based on the International Prostate Symptom Score (IPSS)
and QOL scores. The total IPSS score was subcategorized into voiding and storage symptom subscores [13].
Uroflowmetry (Urodyn+; Mediwatch UK, Ltd., Ruby, UK) was performed, and postvoid residual volume (PVR) was measured using a bladder scanner (BioSon-500;
MCube Tech, Seoul, Korea). These measurements were repeated if the voided volume was <125 mL.
3. Transrectal ultrasonography
All the subjects underwent transrectal ultrasonography using a Prosound Alpha 5 SV (Hitachi Aloka, Tokyo, Japan) between April 2010 and November 2012 or a Pro Focus 2202 Ultrasound System (BK-Medical, Herlev, Denmark) between December 2012 and February 2014.
The total prostate volume (TPV) and transitional zone vol- ume (TZV) were calculated using the prostate ellipsoid for- mula (height×width×length×π/6). The transitional zone index (TZI) was calculated according to the formula TZI=TZV/TPV. Prostate-specific antigen (PSA) was meas- ured using a chemiluminescent enzyme immune assay.
4. Climate data
Climate data from the study period in South Korea (38oN, 127o 30' E) were extracted from the Korea Meteorological Administration, and mean monthly tem- peratures for South Korea were calculated.
5. Statistical analysis
Statistical comparisons of the clinical features of the sub- jects were carried out using one-way analysis of variance (ANOVA) followed by two-sided Tukey’s and Student’s t-tests. All statistical analyses were performed using IBM SPSS ver. 20.0.0.2 (IBM Co., Armonk, NY, USA). A p value of <0.050 was considered statistically significant.
RESULTS
Mean values for patient age, Qmax, PVR, TPV, PSA, and total IPSS are shown in Table 1 along with details of the IPSS score and other patient characteristics. The mean monthly temperatures were obtained between March 2010 and February 2014 (Table 2). The four coldest months were January, February, March and December, the four hottest months were June, July, August, and
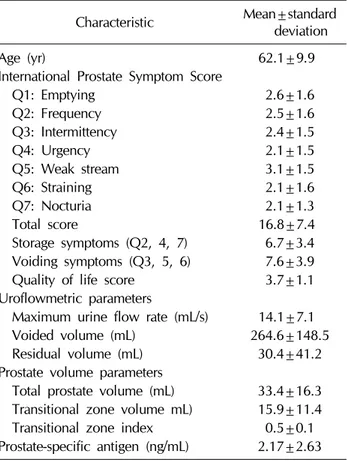
www.wjmh.org Table 1. Patient characteristics (n=1,185)
Characteristic Mean±standard deviation
Age (yr) 62.1±9.9
International Prostate Symptom Score
Q1: Emptying 2.6±1.6
Q2: Frequency 2.5±1.6
Q3: Intermittency 2.4±1.5
Q4: Urgency 2.1±1.5
Q5: Weak stream 3.1±1.5
Q6: Straining 2.1±1.6
Q7: Nocturia 2.1±1.3
Total score 16.8±7.4
Storage symptoms (Q2, 4, 7) 6.7±3.4 Voiding symptoms (Q3, 5, 6) 7.6±3.9
Quality of life score 3.7±1.1
Uroflowmetric parameters
Maximum urine flow rate (mL/s) 14.1±7.1
Voided volume (mL) 264.6±148.5
Residual volume (mL) 30.4±41.2
Prostate volume parameters
Total prostate volume (mL) 33.4±16.3 Transitional zone volume mL) 15.9±11.4 Transitional zone index 0.5±0.1 Prostate-specific antigen (ng/mL) 2.17±2.63
Table 2. Monthly average temperatures in South Korea from March 2010 to February 2014
Year Temperature (oC)
January February March April May June July August September October November December
2010 - - 4.5 10.0 17.3 23.2 26.1 26.8 22.1 14.5 6.3 –1.5
2011 –4.8 1.9 4.6 11.2 17.2 21.9 25.1 25.2 21.1 13.8 11.0 0.7
2012 –1.2 –0.8 5.7 12.6 18.3 22.1 25.5 26.4 20.2 14.3 6.6 –1.7
2013 –1.2 0.7 6.6 10.3 17.8 22.6 26.3 27.3 21.2 15.4 7.1 1.5
2014 –0.7 1.9 - - - -
Average –2.0 0.9 5.4 11.0 17.7 22.5 25.8 26.5 21.2 14.5 7.8 –0.3
Patient (n) 79 99 80 102 80 107 114 105 114 96 90 119
September, and the intermediate months were April, May, October, and November. Patients were categorized into one of these three seasonal groups depending on the mean temperature of the month during which the patient first visited our outpatient clinic. There were 377, 440, and 369 patients in the cold, hot, and intermediate season groups, respectively. There was no statistically significant difference in patient age among the three groups.
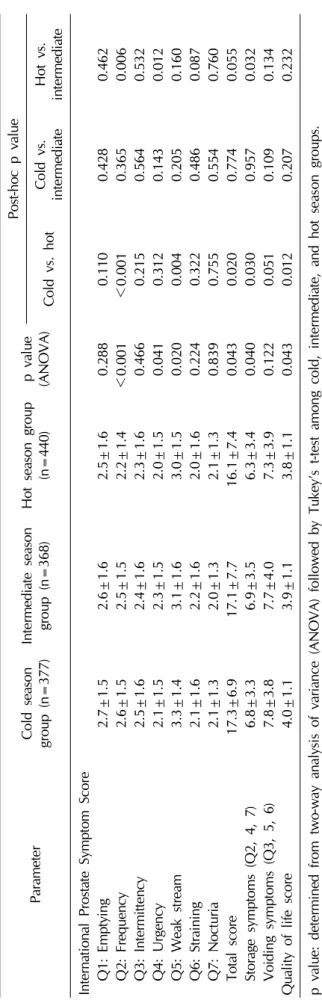
The comparisons of symptom scores are shown in Table 3.
A significant difference in total IPSS score (p=0.020) was noted only between the cold (17.3±6.9) and hot season groups (16.1±7.4). Significant differences between the cold and hot season groups were noted in the IPSS sub- categories of frequency (2.6±1.5 vs. 2.2±1.4, respec- tively; p<0.001) and weak stream (3.3±1.4 vs. 3.0±1.5, respectively; p=0.004), with the symptoms worse in the cold season group. Significant differences were also noted between the intermediate and the hot season groups in the IPSS subcategories of frequency (2.5±1.5 vs. 2.2±1.4, re- spectively; p=0.006) and urgency (2.3±1.5 vs. 2.0±1.5, respectively; p=0.012), with the symptoms worse in the intermediate season group. Storage symptom scores were significantly worse in the cold (6.8±3.3, p=0.030) and in- termediate season groups (6.9±3.5, p=0.032) compared with those in the hot season group (6.3±3.4). There was no difference in voiding symptom scores between the three season groups. The QOL score showed a significant difference only between the cold and the hot season groups (4.0±1.1 vs. 3.8±1.1, respectively; p=0.012).
When comparing the uroflowmetric parameters (Table 4), there was no significant variation in Qmax between the three season groups. However, a significant difference (p=0.034) in voided volume between the cold season (278.7±148.5 mL) and the hot season group (255.9±
145.1 mL) was noted. Similarly, there was a significant dif- ference (p=0.039) in residual volume between the cold sea- son group (26.4±37.6 mL) and the hot season group (32.2±41.0 mL). Prostate volume parameters showed no significant variation between the three season groups (Table 4).
Table 3.Comparison of symptom scores according to season group ParameterCold season group (n=377)Intermediate season group (n=368)Hot season group (n=440)p value (ANOVA)
Post-hoc p value Cold vs. hotCold vs. intermediateHot vs. intermediate International Prostate Symptom Score Q1: Emptying 2.7±1.52.6±1.62.5±1.60.2880.1100.4280.462 Q2: Frequency2.6±1.52.5±1.52.2±1.4<0.001<0.0010.3650.006 Q3: Intermittency2.5±1.62.4±1.62.3±1.60.4660.2150.5640.532 Q4: Urgency2.1±1.52.3±1.52.0±1.50.0410.3120.1430.012 Q5: Weak stream3.3±1.43.1±1.63.0±1.50.0200.0040.2050.160 Q6: Straining2.1±1.62.2±1.62.0±1.60.2240.3220.4860.087 Q7: Nocturia2.1±1.32.0±1.32.1±1.30.8390.7550.5540.760 Total score17.3±6.917.1±7.716.1±7.40.0430.0200.7740.055 Storage symptoms (Q2, 4, 7)6.8±3.36.9±3.56.3±3.40.0400.0300.9570.032 Voiding symptoms (Q3, 5, 6)7.8±3.87.7±4.07.3±3.90.1220.0510.1090.134 Quality of life score4.0±1.13.9±1.13.8±1.10.0430.0120.2070.232 p value: determined from two-way analysis of variance (ANOVA) followed by Tukey’s t-test among cold, intermediate, and hot season groups. Table 4.Comparison of uroflowmetric parameters, prostate volume-related parameters, and prostate-specific antigen levels according to season group ParameterCold season group (n=377)Intermediate season group (n=368)Hot season group (n=440)p value (ANOVA)
Post-hoc p value Cold vs. hotCold vs. intermediateHot vs. intermediate Age (yr)61.6±9.861.8±10.162.9±9.90.1190.0550.7540.118 Uroflowmetric parameter Maximum urine flow rate (mL/s)14.1±7.114.3±7.413.8±6.60.5090.3780.8410.269 Voided volume (mL)278.7±148.5260.8±144.2255.9±145.10.0820.0340.1090.637 Residual volume (mL)26.4±37.632.3±44.732.2±41.00.0790.0390.0530.964 Prostate volume parameter Total prostate volume (mL)32.9±16.333.1±15.634.2±16.70.4810.2820.9020.336 Adenoma volume (mL)15.9±11.715.8±10.716.1±11.80.9440.7900.9740.758 Transitional zone index0.5±0.10.5±0.10.4±0.10.1680.0640.5550.231 Prostate-specific antigen (ng/mL)1.92±2.322.21±2.672.35±2.820.0590.0160.1130.475 p value: determined from two-way analysis of variance (ANOVA) followed by Tukey’s t-test among cold, intermediate, and hot season groups.
www.wjmh.org
DISCUSSION
Our study revealed that seasonal variation might be as- sociated with the severity of symptoms in LUTS/BPH patients. Several explanations have been offered for sim- ilar results in previous studies. For example, due to the re- duced diuresis resulting from insensible fluid loss from sweating in hot weather, urinary frequency could be in- creased in cold seasons compared to hot seasons [14].
Similarly, peripheral vasoconstriction provoked by body cooling inhibits the secretion of vasopressin and leads to diuresis [15]. Another reason could be that cold stress in- creases sympathetic nervous system activity, which could cause the contraction of smooth muscle in the prostate, which in turn could lead to an aggravation of LUTS [6,7].
Furthermore, cold exposure stimulates the secretion of plasma atrial natriuretic peptide, which might contribute to the diuresis frequently observed in the cold [16]. In support of this idea, cold stress is known to provoke detrusor over- activity and cause a decrease in the voiding interval and voiding volume in many animal models [8,9,17].
Despite these possible, yet variable reasons, the etiol- ogy of seasonal variation of LUTS/BPH symptoms is not yet fully understood and there are only a few clinical stud- ies that have reported results on the relationship between seasonal variation and symptoms in LUTS/BPH patients. A large cohort study performed in Japanese patients to un- cover the relationship between climate and LUTS demon- strated that frequency, urgency, and nocturia were sig- nificantly different between summer and winter groups [10].
However, despite the large study population, this study was only questionnaire-based, and the authors focused mainly on storage symptoms instead of all LUTS. Another study, conducted in the UK, examined the effect of season- al variation on IPSS scores and uroflowmetry parameters in 296 men with LUTS [12]. With the exception of an in- crease in the median actual nightly voids over the summer months, there was no significant association between IPSS and uroflowmetric parameters and seasonal or mean monthly temperatures. A similar smaller study, performed to examine seasonal changes in IPSS and uroflowmetric parameters in 31 LUTS patients in Japan, showed that there were no significant seasonal differences in IPSS.
However, among uroflowmetric parameters, the Qmax
was significantly higher in the winter than in the summer months [11].
In our study, we collected data from a large pool of LUTS/BPH patients and used both objective and sub- jective measurements of urinary symptoms, including IPSS and uroflowmetric parameters. As expected, the se- verity of symptoms as measured by the IPSS was worse in the cold season group compared with the hot season group. This result was mainly driven by the differences in the storage symptoms, especially the frequency and the weak stream categories, which showed significantly high- er scores in the cold season group compared with the hot season group. There are some subcategory results that we cannot entirely explain. For example, the urgency was highest in the intermediate season group rather than in the cold season group, and was significantly different only be- tween the hot and intermediate season groups. The QOL score was higher in the cold season group compared with the hot season group, which could lead to the assumption that cold weather creates a negative impact on the pa- tient’s lifestyle. Uroflowmetric parameters showed sig- nificant differences only between the cold and the hot sea- son groups.
Before designing our study, we assumed that we would observe a lower voided volume in the cold season due to the aggravation of frequency. Interestingly, however, voided volume was significantly higher in the cold season group. A possible explanation for this result is that in- creased insensible fluid loss, including massive sweating, in the hot season group might have influenced the amount of urine formation and resulted in a decrease in voided volume. On the other hand, the residual volume was high- er in the hot season group. This result might be explained by the assumption that during colder seasons, frequent void- ing due to detrusor overactivity and increased diuresis plays a greater role in the voiding mechanism than does the con- traction of smooth muscle tone within the prostate.
In our study, serum PSA levels showed seasonal varia- tion and were higher in the hot season group. Previous re- ports suggest that seasonal variation can affect the serum PSA level, although the results are somewhat contro- versial. Simşek et al [18] showed that the mean serum PSA level in the spring showed a higher value when compared with winter, fall, and summer mean levels. However,
some studies show that seasonal variation is not correlated with the serum PSA level [19,20]. Because of these contra- dictory results and the unknown etiology of variations in PSA levels, a more careful approach and follow-up should be considered when treating LUTS/BPH patients.
Our study had several limitations. Each patient was as- sessed only once, at different times of the year, and the re- sults were obtained from a heterogeneous cohort. It is pos- sible that repeated assessments of the same patient during different seasons would have shown more reliable outo- comes. In addition, we made our assessment using only the monthly average temperature instead of using the tem- peratures corresponding to the exact date of the patients’
first visit and the actual location of their residence. Despite its limitations, our study was able to demonstrate that sea- sonal variation could be associated with the severity of symptoms in the LUTS/BPH patients and that the cold sea- son could worsen subjective symptoms as measured by the IPSS.
CONCLUSIONS
Our study and a review of other studies show that sea- sonal variation has a meaningful association with the symptoms in LUTS/BPH patients, especially urine storage.
In addition, serum PSA levels could be influenced by sea- sonal variation, despite contradictory results in previous studies. Seasonal variation should be considered as an im- portant factor when treating LUTS/BPH patients, and a prospective and longitudinal follow-up study is needed to validate the results.
CONFLICT OF INTEREST
No potential conflict of interest relevant to this article was reported.
REFERENCES
1. Coyne KS, Wein AJ, Tubaro A, Sexton CC, Thompson CL, Kopp ZS, et al. The burden of lower urinary tract symptoms:
evaluating the effect of LUTS on health-related quality of life, anxiety and depression: EpiLUTS. BJU Int 2009;103 Suppl 3:4-11.
2. Schulman CC, Asplund R, Desgrandchamps F, Jonas U. The
impact of nocturia on health status and quality of life in pa- tients with lower urinary tract symptoms suggestive of be- nign prostatic hyperplasia (LUTS/BPH). Eur Urol Suppl 2005;4:1-8.
3. Thorpe A, Neal D. Benign prostatic hyperplasia. Lancet 2003;361:1359-67.
4. Roosen A, Chapple CR, Dmochowski RR, Fowler CJ, Gratzke C, Roehrborn CG, et al. A refocus on the bladder as the originator of storage lower urinary tract symptoms: a systematic review of the latest literature. Eur Urol 2009;56:810-9.
5. Coyne KS, Sexton CC, Thompson CL, Milsom I, Irwin D, Kopp ZS, et al. The prevalence of lower urinary tract symp- toms (LUTS) in the USA, the UK and Sweden: results from the Epidemiology of LUTS (EpiLUTS) study. BJU Int 2009;104:352-60.
6. Roehrborn CG, Schwinn DA. Alpha1-adrenergic receptors and their inhibitors in lower urinary tract symptoms and be- nign prostatic hyperplasia. J Urol 2004;171:1029-35.
7. LeBlanc J. Mechanisms of adaptation to cold. Int J Sports Med 1992;13 Suppl 1:S169-72.
8. Imamura T, Ishizuka O, Nishizawa O. Cold stress induces lower urinary tract symptoms. Int J Urol 2013;20:661-9.
9. Geirsson G, Lindström S, Fall M. The bladder cooling reflex and the use of cooling as stimulus to the lower urinary tract.
J Urol 1999;162:1890-6.
10. Yoshimura K, Kamoto T, Tsukamoto T, Oshiro K, Kinukawa N, Ogawa O. Seasonal alterations in nocturia and other storage symptoms in three Japanese communities. Urology 2007;69:864-70.
11. Watanabe T, Maruyama S, Maruyama Y, Kageyama S, Shinbo H, Otsuka A, et al. Seasonal changes in symptom score and uroflowmetry in patients with lower urinary tract symptoms.
Scand J Urol Nephrol 2007;41:521-6.
12. Cartwright R, Mariappan P, Turner KJ, Stewart LH, Rajan P.
Is there seasonal variation in symptom severity, uro- flowmetry and frequency-volume chart parameters in men with lower urinary tract symptoms? Scott Med J 2014;59:
162-6.
13. Abrams P, Cardozo L, Fall M, Griffiths D, Rosier P, Ulmsten U, et al; Standardisation Sub-committee of the International Continence Society. The standardisation of terminology of lower urinary tract function: report from the Standardisation Sub-committee of the International Continence Society.
Neurourol Urodyn 2002;21:167-78.
14. Kohn D, Flatau E. Why does cold weather cause frequency of micturition in some elderly people. Br Med J 1980;281:
875.
15. Stocks JM, Taylor NA, Tipton MJ, Greenleaf JE. Human physiological responses to cold exposure. Aviat Space Environ Med 2004;75:444-57.
16. Hassi J, Rintamäki H, Ruskoaho H, Leppäluoto J, Vuolteenaho O. Plasma levels of endothelin-1 and atrial natriuretic pep- tide in men during a 2-hour stay in a cold room. Acta Physiol Scand 1991;142:481-5.
www.wjmh.org 17. Imamura T, Ishizuka O, Aizawa N, Zhong C, Ogawa T,
Nakayama T, et al. Cold environmental stress induces de- trusor overactivity via resiniferatoxin-sensitive nerves in conscious rats. Neurourol Urodyn 2008;27:348-52.
18. Simşek U, Kutlu S, Yavaşçaouğlu I, Oktay B, Ozyurt M.
Seasonal variation of prostatic acid phosphate and prostate- specific antigen in patients without prostatic malignancy.
Eur Urol 1992;21 Suppl 1:111-4.
19. Down L, Metcalfe C, Martin RM, Neal DE, Hamdy FC, Donovan JL, et al. Seasonal variation in prostate-specific an- tigen levels: a large cross-sectional study of men in the UK.
BJU Int 2011;108:1409-14.
20. Connolly D, van Leeuwen PJ, Bailie J, Black A, Murray LJ, Keane PF, et al. Daily, monthly and seasonal variation in PSA levels and the association with weather parameters.
Prostate Cancer Prostatic Dis 2011;14:58-62.