서 언
수수는 아시아와 아프리카의 여러 나라에서 빵과 죽 같은 음 식의 목적으로 55%가 소비되고 있으며, 밀(Triticum aestivum L), 쌀(Oryza sativa L.), 옥수수(Zea mays L.), 보리(Hordeum vulgare L.)에 이어서 세계에서 다섯 번째로 중요한 곡물 중의 하나이다(Yoon et al., 2016). 수수는 고온, 다조를 좋아하고 내 건성이 강하여 열대와 그에 준하는 건조지대에서 가장 많이 재
배될 뿐만 아니라 흑조위축병에 강한 특성을 가지고 있다. 최근 우리나라 밭작물의 논 재배면적 수요는 증가하고 있다. 동시에 밭작물의 주요 생육 기간인 여름철에 강수량이 집중되는 등, 이 상기상에 따라 특정 기간의 강수량이 증가하면서 밭작물의 습 해 발생 빈도가 높아지고 있는 상황이다. 현재 여러 연구를 통하 여 여러 가지 작물들에 대한 작물재배적지에서의 기준이 정립 된 바 있지만, 재배적지 이외의 재배지의 작물의 수량 증수 및 품질 향상 재배에 관한 연구는 미미한 수준이며, 습해의 발생기 작 분석 분야의 연구 또한 상대적으로 부족한 실정이다.
프로테오믹스는 기능성 단백질 해석, 단백질의 구조변화 게 놈의 기능, 생물기능을 해명하는 연구 분야로, 최근의 프로테옴
토양 과습 조건하에서 수수 잎의 단백질 양상
윤민헌
1
, 정해룡1
, 유장환1
, Swapan Kumar Roy1
, 권수정1
, 김주호2
, 전현정3
, 정기열3
, 조성우4
, 우선희1
*1
충북대학교 식물자원학과,
2농협케미컬 연구소,
3국립식량과학원 남부작물부,
4전북대학교 작물생명과학과
Proteome Characterization of Sorghum (Sorghum bicolor L.) at Vegetative Stage under Waterlogging Stress
Min Heon Yun
1
, Hae-Ryong Jeong1
, Jang-Hwan Yoo1
, Swapan Kumar Roy1
, Soo-Jeong Kwon1
, Joo-Ho Kim2
, Hyen Chung Chun3
, Ki Yuol Jung3
, Seong-Woo Cho4
and Sun-Hee Woo1
*1
Department of Crop Science, Chungbuk National University, Cheong-ju 28644, Korea
2
Biological Research Team, NongHyup Chemical Research Institute, Okcheon 29008, Korea
3
Crop Production Technology Research Division, National Institute of Crop Science, RDA, Miryang 50424, Korea
4
Department of Crop Science and Biotechnology, Chonbuk National University, Jeon-ju 54896, Korea
Abstract - The study was performed to explore the molecular changes in the vegetative stage (3-and 5-leaf) of sorghum under waterlogging stress. A total of 74 differentially expressed protein spots were analyzed using LTQ-FT-ICR MS.
Among them, 12 proteins were up-regulated and 3 proteins were down-regulated. Mass spectrometry (MS) results showed that about 50% of the proteins involved in various metabolic processes. The level of protein expression of malate dehydrogenase and glyceraldehyde-3-phosphate dehydrogenase related to carbohydrate metabolic process increased in both 3 and 5-leaf stage under waterlogging stress. These proteins are known to function as antistress agents against waterlogging stress. The expression of oxygen-evolving enhancer protein 1 protein related to photosynthesis was slightly increased in the treated group than in the control group, however the expression level was increased in the 5-leaf stage compared to the 3-leaf stage. Probable phospholipid hydroperoxide glutathione peroxidase protein and superoxide dismutase protein related to response to oxidative stress showed the highest expression level in 5-leaf stage treatment. This suggests that the production of reactive oxygen species by the waterlogging stress was the most abundant in the 5-leaf treatment group, and the expression of the antioxidant defense protein was increased.
Key words –
Functional characterization, Proteome, Sorghum, Waterlogging stress
*교신저자: [email protected] Tel. +82-43-261-2515
ⓒ 본 학회지의 저작권은 (사)한국자원식물학회지에 있으며, 이의 무단전재나 복제를 금합니다.
Original Research Article
(proteome)이라는 용어는 특정 기관 혹은 조직에서 특정 스트 레스에 발현되는 모든 단백질의 발현에도 적용되고 있다(Woo et al., 2003). 프로테오믹스는 단백질 수준에서 유전자 발현에 대한 특성을 파악하고, 외부환경의 변화에 따른 단백질 발현에 대한 정보를 획득할 수 있는 새로운 기술로서 단백질 발현, 발현 후 수식 및 발현단백질의 기능 해명에 유용한 기술이라 할 수 있 다(Pandey and Mann, 2000). 이러한 프로테옴 분석은 이차원 전기영동을 통하여 특정 조건에 따라 다르게 발현되는 단백질 을 전하와 분자량에 따라 분리한 후 각각의 단백질을 질량분석 기로 분석하여 아미노산 서열을 결정하고 이를 바탕으로 단백 질 또는 유전체 데이터베이스를 생물정보학 툴로 찾아 단백질 의 정체를 확인하는 과정으로 구성된다(Rabilloud, 2002).
2000년대에 들어서 복합단백질의 질량분석이 가능한 다차 원 단백질 동정기술(MudPIT)과 구축되어 있는 데이터베이스 및 생물정보 관련 프로그램을 이용하는 생물정보학을 접목하는 방향으로 많은 연구가 수행되고 있다(Kim et al., 2010). 최근 기기의 발달로 2-DE에서 분리된 단백질을 효소로 절단하여 펩 티드 질량을 정확히 측정할 수 있으며, peptide mapping에 의 한 단백질 동정의 성공률도 높아졌다(Kim, 2014). 대량의 동정 된 단백질의 생물정보를 바탕으로 단백질 사이에서의 네트 워크 분석을 통해 식물체에 미치는 스트레스의 메커니즘을 분자 수준에서 해석하기 위한 연구가 활발히 진행 중에 있다 (Komatsu et al., 2013). 식물에서는 애기장대(The Arabidopsis Genome Initiative, 2000)와 벼의 genome에 대한 정보해석 (International Rice Genome Sequencing Project, 2005)이 완 성됨에 따라, 이 2가지 모델의 식물을 중심으로 하는 단백질에 대한 연구가 가장 활발하게 진행되고 있다(Kim, 2014).
따라서, 본 연구에서는 과습스트레스에 따른 수수의 논 재배 를 과학적으로 판별하기 위하여 수수의 초기생육시기인 3엽기 와 5엽기에 논 및 과습 논에서의 단백질 발현양상의 차이를 밝히 고자 연구를 수행하였다.
재료 및 방법
실험재료 및 처리방법
본 시험은 2016년 농촌진흥청에서 분양 받은 남풍찰 수수를 이용하여 수수 과습 스트레스 관련 단백질 분석을 위한 재료로 이용하였다. 수수 재배를 위해 종자는 수도용 상토와 충북대학 교 부속 농장 밭토양과 1:2 비율로 섞어서 만든 토양을 2.5 ㎏씩 채운 Wagner pot (1/10000단보, 한진)에 pot당 4립씩 직파하였
다. 파종이 완료된 pot는 충북대학교 부속 농장 온실에서 재배 하였다. 수수 발아 후 5일 뒤, 3엽기에 도달하여 3엽기 과습 처 리 실험을 10일간 진행하였다. 또한, 발아 후 10일 뒤에 5엽기에 도달하여 5엽기 과습 처리 실험을 10일간 진행하였다. 각각의 처리구에 따른 대조구를 나누어 처리하였다. 처리구의 경우 수 수가 심어져 있는 Wagner pot를 더 큰 통에 넣은 후에 pot 밑면 이 급수구로부터 수분이 공급되어 토양 표면 10 ㎝ 깊이까지 포 화 되도록 처리하였다. 처리기간 10일 동안 매일 토양수분량 측 정을 실시하여 대조구에서는 토양수분함량을 평균 25%로 유지 하였고, 처리구에서는 평균 58%로 유지하였다. 실험 재료는 과 습 처리 10일 후에 각각의 대조구와 처리구에서 수수 잎을 채취 하였으며, 채취 후 즉시 액체 질소에 담가 두었던 50 ㎖ 튜브에 넣은 후 곧바로 액체 질소에 동결시켜 시료의 변성을 최소화시 켰다.
단백질 추출
단백질 추출에서 효과적인 액체질소를 이용한 세포벽 파쇄 그리고 불순물 제거를 위한 TCA 침전법을 이용하여 수수 잎에 서의 단백질 추출을 시행하였다. 50 ㎖ 튜브에 10% TCA와 0.07% 2-Mercaptoethanol을 섞어 만든 용액을 10 ㎖ 채운 후 곱게 갈린 sample 시료를 넣은 후 수 초간 voltexing해 주었다.
1시간 동안 15분마다 voltexing한 후 원심분리(12,000g, 4℃, 20분)하여 상등액을 제거하였다.
상등액 제거 후 acetone으로 희석한 0.07% 2-Mercap- toethanol 용액을 1.5 ㎖ 첨가 후 다시 voltexing, 원심분리 (20,000 g, 4℃, 5분)를 실시하였으며 세척 후 speed vacuum centrifuge를 사용하여 잔여 에탄올이 모두 증발되어 제거될 때 까지 10분 정도 건조 시켰다. 건조된 시료에 lysis buffer [8M Urea, 2% NP-40, 2% Ampholine (pH 3-10), 5% 2-Mercap- toethanol, 5% Polyvinylpyrrolidone (PVP-40)]를 추가하여 1 시간 동안 상온에서 voltexing하여 반응시켜 준 후 원심분리 (20,000 g, 25℃, 20분)하여 상층액을 취한 후 Brad Ford 분석 을 이용하여 단백질 농도를 결정하였다.
이차원 전기영동
일차원 전기영동(one-dimentional electrophoresis : 1-DE) 은 pI (isoelectric point)를 이용한 전기영동으로, 11 ㎝ straw gel [Urea, 30% acrylamide, 10% NP-40, Ampholine (pH 3-10), 10% APS, TEMED] 위에 시료를 주입하여 전기영동 하였 다. 전압은 150V에서 1시간, 300V에서 1시간, 500V에서 16시간
으로 전압을 증가 조정한 후 전기영동 하였다.
2차 전기영동 분석을 위해서 12% separating gel [1.5M Tris (pH6-8), 30% acrylamide, 10% APS, 10% SDS, TEMED]과 5%
Staking gel [0.5M Tris (pH6-8), 30% acrylamide, 10% APS, 10% SDS, TEMED]에 loading 시킨 후 Coomassie brilliant blue (CBB G-250)로 염색해주었다. 모든 실험은 3반복으로 실행되 었으며, 염색 후 각각의 gel은 스캐너(HP Scanjet G4010, USA) 를 이용하여 스캔했다. 또한, 각각의 2D-gel image analysis는 Progenesis samespot program (Nonlinear Dynamics, Newcastle-upon-Tyne, UK)을 사용하여 분석하였다.
In-gel Digestion
이미지 분석 결과를 바탕으로 하여 각각의 gel에서 단백질 스팟들을 선정하였다. In-gel digestion은 In-Gel Tryptic Digestion Kit (Thermo SCIENTIFIC)을 사용하여 시행하였다.
각각의 gel에서 선정된 단백질 스팟들을 2-D gel에서 메스를 이 용하여 추출해 내어 band를 1×1 ㎜ 크기로 절단한 후 600 ㎕ tube에 옮겨주었다. 겔이 옮겨진 튜브에 샘플의 탈색을 위해 destaining buffer [50% ACN/20 mM ammonium bicarbonate]
를 200 ㎕ 채운 후 37℃에서 30분간 shaking하였으며 염색 된 부분이 겔에서 완전히 사라질 때까지 2∼3번 실시하였다.
색이 완전히 빠진 튜브에 reduction buffer {Digestion buffer [ultrapure water/25mM ammonium bicarbonate]/50 mM TCEP (Tris[2-carboxyethyl]phosphine)}을 30 ㎕ 첨가한 후, 60℃에서 10분간 반응시켜준 다음 alkylation buffer [10%
iodoacetoamide/5X digestion buffer] 30 ㎕를 tube에 첨가한 후 상온에서 1시간 반응시켜주었다. Alkylation buffer를 튜브에 서 완전히 제거해준 후 washing을 위해 destaining buffer 200 ㎕ 를 튜브에 첨가 후 37℃에서 15분간 shaking incubation 하였다.
각각의 튜브에 100% ACN 50 ㎕를 첨가한 후 15분간 반응시킨 후 15분 정도 건조시켰다. 튜브에 activated trypsin {Working trypsin[trypsin stock (1 ㎍/㎕-Trypsin/Trypsin Storage Solution)/10X ultrapure water]/10X digestion buffer} 10 ㎕ 를 첨가한 후 상온에서 15분간 배양하여 겔 조각을 swell 시켜주 었다. 그 후 digestion buffer 25 ㎕를 첨가한 후, 30℃에서 overnight시켜 shaking incubation하였다. 새로 준비한 600 ㎕ 튜브에 겔 조각을 제외한 상등액 만을 조심스럽게 옮겨준 다음 speed vacuum centrifuge을 이용하여 완전히 건조 시켜 최종 질량 분석을 위한 시료로 사용하였다.
질량 분석 및 생물정보를 이용한 단백질 동정
단백질 질량 분석은 surveyor HPLC system과 nano-ESI 소스가 장착된 Finningan LTQ-FT-ICR 질량 분석기(Therm Electon, Bremen, Germany)로 구성된 Nano-LC/MS 시스템으 로 수행되었다. 샘플들의 염을 모두 제거한 후 각각의 샘플 10
㎕를 auto sampler (Surveyor)를 사용하여 C18 trap column (I.D., 300 ㎕, length 5 ㎜, particle size 5 ㎕, LC Packings)에 주입한 후 20 ㎕/min의 flow rate로 농축하였다. 이후 MS와 MS/MS acquisition을 반복하며 data-dependent mode로 작동 하였고, 실험 조건은 2.2kV spray voltage, 220℃ ion transfer tube temperature, 1.3 millitors collision gas pressure로 모두 세팅하였다. MS/MS auquisition에서 ion 검출은 500 counts를 한계점으로, 활성화는 q=0.25, 활성화시간은 30 ms로 설정하 였다. LTQ- FT-ICR MS를 이용하여 알아낸 단백질 펩티드의 MS spectra data값은 먼저 MASCOT ver 2.0 (Matrix Science, UK)의 데이터베이스에서 검색하였으며, 펩티드 오차범위는 50 ppm, fragment ion 오차 범위는 0.5 DA로 설정하였다. 그 결과를 토대로 수집한 protein description과 peptide sequence 정보를 PIR (http://pir.georgetown.edu)을 이용하여 protein sequence를 검색하였다. 최종 확인된 수수 잎의 단백질은 분자 량과 pI 2가지 항목을 통해 각각의 특성에 따라 분류하여 정리 하였다.
결과 및 고찰
과습 처리에 따른 수수 잎의 단백질 발현양상
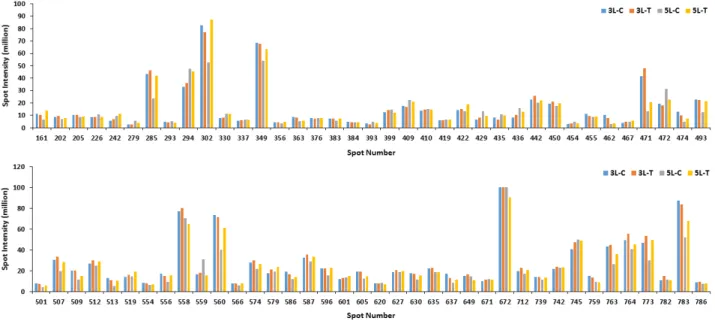
수수의 3엽기에 토양의 과습 처리 10일 후 잎에서부터 추출한 단백질 발현 양상은 Fig. 1과 같고, 5엽기에서의 단백질 발현 양 상은 Fig. 2와 같다. 발현된 수많은 단백질 스팟을 Progenesis samespot software program을 이용하여 이미지 분석을 통해 375개의 단백질 스팟으로 구분했다. 구분된 375개의 단백질 스팟 중 서로 다른 양상을 보이며 비교 가능한 단백질 스팟 74 개를 선택하여 동정한 결과 실험구 중 토양 과습 처리구에서 20개의 단백질 스팟들에서 up-regulated 된 반면에, 5개의 단 백질 스팟들에서는 down-regulated 된 것을 확인할 수 있었 다(Fig. 3). Khatoon et al. (2012)은 콩 묘목을 과습처리 후 동 정한 결과 과습처리에서 무처리에 비해 4개의 단백질 스팟들에 서 down-regulated 된 것을 확인하였다. 이미지 분석 시 기준이 된 reference gel을 질량 분석기로 분석, 동정하였고, 동정결과 각각의 스팟은 구획을 나누어 numbering하여 표시하였다(Fig. 4).
분자 크기 별로 단백질들을 비교한 결과 모두 분자량이 20 kDa∼80 kDa에 속하는 것을 확인하였고, 그 중에 무게가 20 kDa∼40 kDa 크기에 속한 단백질들이 64%를 차지하였으며, 중 분자 범위(50 kDa∼80 kDa)의 경우에는 약 10% 정도 분포하는 것으로 나타났다(Fig. 5).
등전점(pI) 또한 배수성에 관계없이 pI 6∼7 사이에서 약 50%
로 가장 많은 분포를 보였으며, pI 5∼6 에서도 약 31%로 두 번째 로 많은 단백질 분포를 보여 pI 5∼7 사이의 단백질들이 약 81%
이상을 차지하였다. 이것으로 보아 약산성에서 중성을 띈 단백 질들이 염기성을 띈 단백질 보다 수수 잎에 많이 존재함을 알 수 Fig. 1. 2-DE gel map after 10 days waterlogging conditions cultured leaves of Sorghum bicolor L. visualized by CBB staining at 3-leaf stage (C: Control; T: Treatment; Number: Replication).
Fig. 2. 2-DE gel map after 10 days waterlogging conditions cultured leaves of Sorghum bicolor L. visualized by CBB staining at 5-leaf stage (C: Control; T: Treatment; Number: Replication).
있었다(Fig. 6). 애기 장대는 대부분 10 kDa∼50 kDa의 작은 분자 량을 가진 단백질이 가장 많았으며, 염기성 단백질이 많이 포함 되어 있다고 보고하여(Millar et al., 2005) 수수 잎의 분자량에 따른 분포와는 유사한 결과를 보였으나 등전점에 따른 분포는 염 기성 보다 산성 단백질이 많이 포함되어 차이가 있음을 나타냈다.
과습 처리에 따른 수수 잎의 Proteome 동정
LTQ-FT-ICR MS를 이용하여 토양의 과습 처리 10일 후 수 수 잎에서 추출된 단백질들을 동정하였다. 총 74개의 단백질을 동정하였으며, 이렇게 동정된 단백질들을 식별하여 분류한 것
Fig. 3. Relative protein intensity of differentially expressed proteins from leaves of Sorghum bicolor L. under waterlogging stress (3L-C: 3-leaf stage, Control; 3L-T: 3-leaf stage, Treatment; 5L-C: 5-leaf stage, Control; 5L-T: 5-leaf stage, Treatment).
Fig. 4. Reference 2-DE gel map after 10 days waterlogging conditions cultured leaves of Sorghum bicolor L. Proteins were extracted from sorghum leaf, separated by 2-DE, and visualized by progenesis samespot program.
Fig. 5. Differential molecular weight (kDa) of identified proteins from 10 days waterlogging conditions cultured leaves of Sorghum bicolor L.
Fig. 6. Differential iso-electric point (pI) of identified proteins from 10 days waterlogging conditions cultured leaves of Sorghum bicolor L.
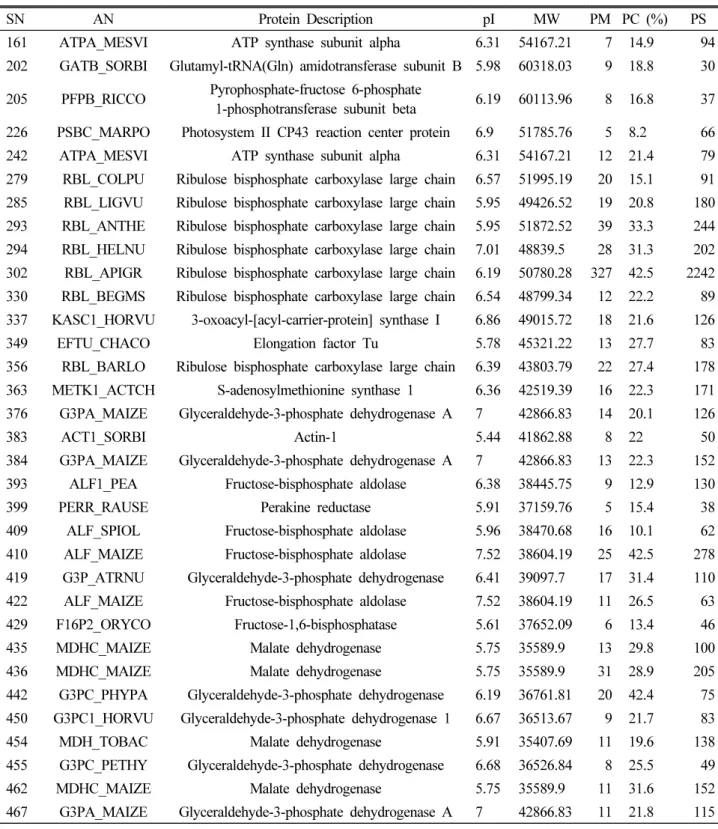
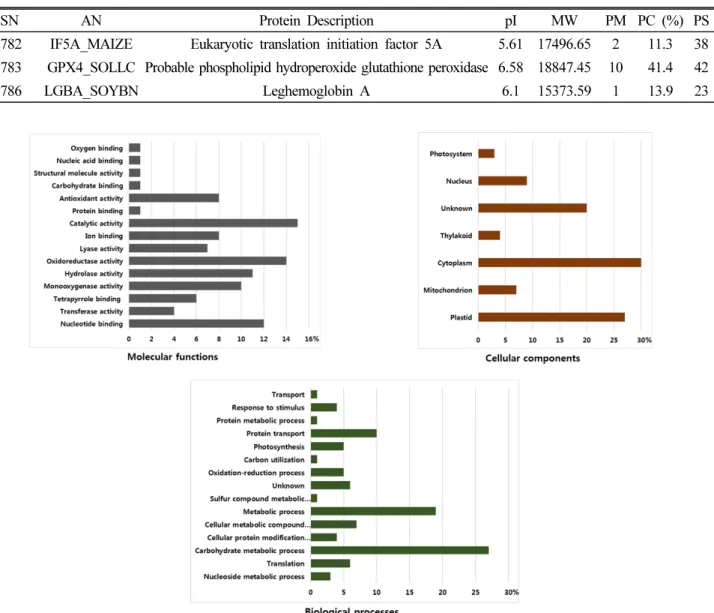
은 Table 1과 같다. 그리고 확인된 74개의 단백질들을 molecular function, cellular component, biological process를 기준으 로 분류한 것이 Fig. 7이다. Molecular function에서는 촉매
활성(catalytic activity)와 산화환원효소활성(oxidoreductase activity)가 각각 15%, 14%로 가장 많이 확인 되었으며 cellular component에서는 세포질, 색소체가 각각 30%, 27%로 가장 많
Table 1. List of identified differentially expressed proteins from leaves of Sorghum bicolor L. using LTQ-FTICR MS
SN AN Protein Description pI MW PM PC (%) PS
161 ATPA_MESVI ATP synthase subunit alpha 6.31 54167.21 7 14.9 94 202 GATB_SORBI Glutamyl-tRNA(Gln) amidotransferase subunit B 5.98 60318.03 9 18.8 30 205 PFPB_RICCO Pyrophosphate-fructose 6-phosphate
1-phosphotransferase subunit beta 6.19 60113.96 8 16.8 37 226 PSBC_MARPO Photosystem II CP43 reaction center protein 6.9 51785.76 5 8.2 66 242 ATPA_MESVI ATP synthase subunit alpha 6.31 54167.21 12 21.4 79 279 RBL_COLPU Ribulose bisphosphate carboxylase large chain 6.57 51995.19 20 15.1 91 285 RBL_LIGVU Ribulose bisphosphate carboxylase large chain 5.95 49426.52 19 20.8 180 293 RBL_ANTHE Ribulose bisphosphate carboxylase large chain 5.95 51872.52 39 33.3 244 294 RBL_HELNU Ribulose bisphosphate carboxylase large chain 7.01 48839.5 28 31.3 202 302 RBL_APIGR Ribulose bisphosphate carboxylase large chain 6.19 50780.28 327 42.5 2242 330 RBL_BEGMS Ribulose bisphosphate carboxylase large chain 6.54 48799.34 12 22.2 89 337 KASC1_HORVU 3-oxoacyl-[acyl-carrier-protein] synthase I 6.86 49015.72 18 21.6 126 349 EFTU_CHACO Elongation factor Tu 5.78 45321.22 13 27.7 83 356 RBL_BARLO Ribulose bisphosphate carboxylase large chain 6.39 43803.79 22 27.4 178 363 METK1_ACTCH S-adenosylmethionine synthase 1 6.36 42519.39 16 22.3 171 376 G3PA_MAIZE Glyceraldehyde-3-phosphate dehydrogenase A 7 42866.83 14 20.1 126
383 ACT1_SORBI Actin-1 5.44 41862.88 8 22 50
384 G3PA_MAIZE Glyceraldehyde-3-phosphate dehydrogenase A 7 42866.83 13 22.3 152 393 ALF1_PEA Fructose-bisphosphate aldolase 6.38 38445.75 9 12.9 130
399 PERR_RAUSE Perakine reductase 5.91 37159.76 5 15.4 38
409 ALF_SPIOL Fructose-bisphosphate aldolase 5.96 38470.68 16 10.1 62 410 ALF_MAIZE Fructose-bisphosphate aldolase 7.52 38604.19 25 42.5 278 419 G3P_ATRNU Glyceraldehyde-3-phosphate dehydrogenase 6.41 39097.7 17 31.4 110 422 ALF_MAIZE Fructose-bisphosphate aldolase 7.52 38604.19 11 26.5 63 429 F16P2_ORYCO Fructose-1,6-bisphosphatase 5.61 37652.09 6 13.4 46 435 MDHC_MAIZE Malate dehydrogenase 5.75 35589.9 13 29.8 100 436 MDHC_MAIZE Malate dehydrogenase 5.75 35589.9 31 28.9 205 442 G3PC_PHYPA Glyceraldehyde-3-phosphate dehydrogenase 6.19 36761.81 20 42.4 75 450 G3PC1_HORVU Glyceraldehyde-3-phosphate dehydrogenase 1 6.67 36513.67 9 21.7 83 454 MDH_TOBAC Malate dehydrogenase 5.91 35407.69 11 19.6 138 455 G3PC_PETHY Glyceraldehyde-3-phosphate dehydrogenase 6.68 36526.84 8 25.5 49 462 MDHC_MAIZE Malate dehydrogenase 5.75 35589.9 11 31.6 152 467 G3PA_MAIZE Glyceraldehyde-3-phosphate dehydrogenase A 7 42866.83 11 21.8 115
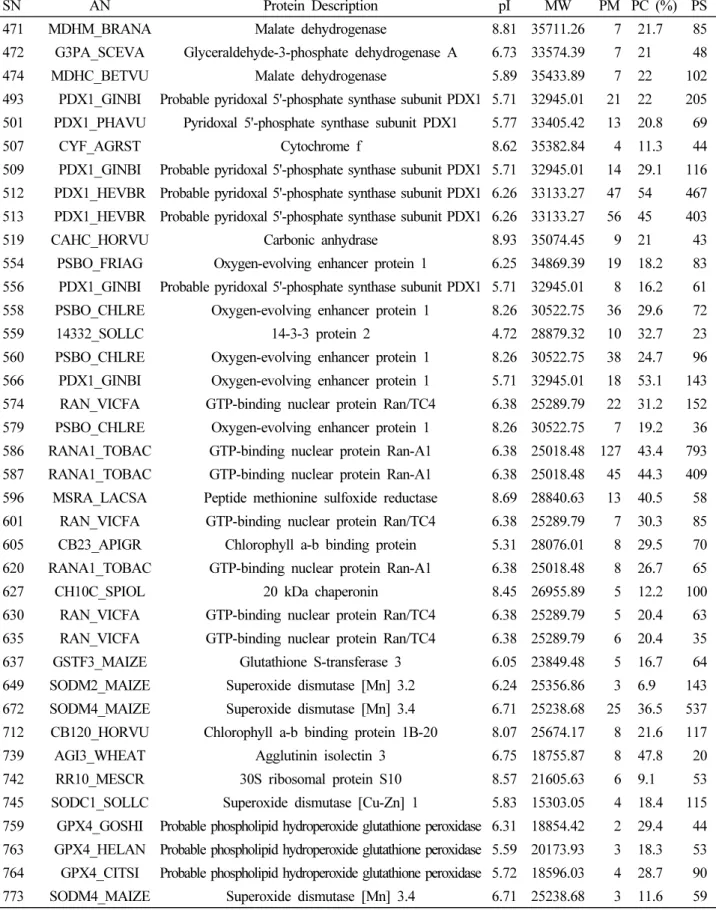
Table 1. Continued
SN AN Protein Description pI MW PM PC (%) PS
471 MDHM_BRANA Malate dehydrogenase 8.81 35711.26 7 21.7 85 472 G3PA_SCEVA Glyceraldehyde-3-phosphate dehydrogenase A 6.73 33574.39 7 21 48 474 MDHC_BETVU Malate dehydrogenase 5.89 35433.89 7 22 102 493 PDX1_GINBI Probable pyridoxal 5'-phosphate synthase subunit PDX1 5.71 32945.01 21 22 205 501 PDX1_PHAVU Pyridoxal 5'-phosphate synthase subunit PDX1 5.77 33405.42 13 20.8 69
507 CYF_AGRST Cytochrome f 8.62 35382.84 4 11.3 44
509 PDX1_GINBI Probable pyridoxal 5'-phosphate synthase subunit PDX1 5.71 32945.01 14 29.1 116 512 PDX1_HEVBR Probable pyridoxal 5'-phosphate synthase subunit PDX1 6.26 33133.27 47 54 467 513 PDX1_HEVBR Probable pyridoxal 5'-phosphate synthase subunit PDX1 6.26 33133.27 56 45 403
519 CAHC_HORVU Carbonic anhydrase 8.93 35074.45 9 21 43
554 PSBO_FRIAG Oxygen-evolving enhancer protein 1 6.25 34869.39 19 18.2 83 556 PDX1_GINBI Probable pyridoxal 5'-phosphate synthase subunit PDX1 5.71 32945.01 8 16.2 61 558 PSBO_CHLRE Oxygen-evolving enhancer protein 1 8.26 30522.75 36 29.6 72
559 14332_SOLLC 14-3-3 protein 2 4.72 28879.32 10 32.7 23
560 PSBO_CHLRE Oxygen-evolving enhancer protein 1 8.26 30522.75 38 24.7 96 566 PDX1_GINBI Oxygen-evolving enhancer protein 1 5.71 32945.01 18 53.1 143 574 RAN_VICFA GTP-binding nuclear protein Ran/TC4 6.38 25289.79 22 31.2 152 579 PSBO_CHLRE Oxygen-evolving enhancer protein 1 8.26 30522.75 7 19.2 36 586 RANA1_TOBAC GTP-binding nuclear protein Ran-A1 6.38 25018.48 127 43.4 793 587 RANA1_TOBAC GTP-binding nuclear protein Ran-A1 6.38 25018.48 45 44.3 409 596 MSRA_LACSA Peptide methionine sulfoxide reductase 8.69 28840.63 13 40.5 58 601 RAN_VICFA GTP-binding nuclear protein Ran/TC4 6.38 25289.79 7 30.3 85 605 CB23_APIGR Chlorophyll a-b binding protein 5.31 28076.01 8 29.5 70 620 RANA1_TOBAC GTP-binding nuclear protein Ran-A1 6.38 25018.48 8 26.7 65 627 CH10C_SPIOL 20 kDa chaperonin 8.45 26955.89 5 12.2 100 630 RAN_VICFA GTP-binding nuclear protein Ran/TC4 6.38 25289.79 5 20.4 63 635 RAN_VICFA GTP-binding nuclear protein Ran/TC4 6.38 25289.79 6 20.4 35 637 GSTF3_MAIZE Glutathione S-transferase 3 6.05 23849.48 5 16.7 64 649 SODM2_MAIZE Superoxide dismutase [Mn] 3.2 6.24 25356.86 3 6.9 143 672 SODM4_MAIZE Superoxide dismutase [Mn] 3.4 6.71 25238.68 25 36.5 537 712 CB120_HORVU Chlorophyll a-b binding protein 1B-20 8.07 25674.17 8 21.6 117 739 AGI3_WHEAT Agglutinin isolectin 3 6.75 18755.87 8 47.8 20 742 RR10_MESCR 30S ribosomal protein S10 8.57 21605.63 6 9.1 53 745 SODC1_SOLLC Superoxide dismutase [Cu-Zn] 1 5.83 15303.05 4 18.4 115 759 GPX4_GOSHI Probable phospholipid hydroperoxide glutathione peroxidase 6.31 18854.42 2 29.4 44 763 GPX4_HELAN Probable phospholipid hydroperoxide glutathione peroxidase 5.59 20173.93 3 18.3 53 764 GPX4_CITSI Probable phospholipid hydroperoxide glutathione peroxidase 5.72 18596.03 4 28.7 90 773 SODM4_MAIZE Superoxide dismutase [Mn] 3.4 6.71 25238.68 3 11.6 59
이 확인되었고, biological process에서는 탄수화물 대사과정 (carbohydrate metabolic process), 대사과정(metabolic process) 가 각각 27%, 19%로 가장 많은 양을 차지하였다. 탄수화물 대사 과정에 작용되는 단백질들이 가장 많이 발견되는 것으로 보아 수수의 3엽기와 5엽기에 과습 스트레스가 탄수화물 대사과정에 많은 영향을 주는 것으로 판단되었으며, 이 외에도 아직 그 기능 이 밝혀지지 않은 단백질이 5%가 나타나는 등 여전히 기능 해석 이 필요한 단백질이 존재하는 것으로 생각되었다.
스팟 번호 471인 Malate dehydrogenase는 MDH gene을 가지는 단백질로 Malate dehydrogenase의 활성 변화 정도
(Crawford, 1978)는 과습 상태에 따라 극적으로 변화하기 때문 에 malate dehydrogenase는 과습 스트레스에 대한 식물 반응 의 지표로 사용되어왔다(Daugherty and Musgrave, 1994). 효 소학적으로 이 단백질은 Glucose가 EMP, TCA를 거쳐 산화되는 전 과정 중에 하나인 L-말산(Malate)을 NAD+에 의해 가역적으 로 탈수소하여 옥살로아세트산(Oxaloacetate)과 NADH를 생 성하는 반응을 촉매하는 효소이다((S)-malate + NAD+ = oxaloacetate + NADH). 즉, Malate dehydrogenase가 glucose 의 전체 산화과정에서 마지막 NADH2를 생성하는데 촉매 역할 을 하는 것이다(Rocha et al., 2010). 생물계에 널리 분포하고, Table 1. Continued
SN AN Protein Description pI MW PM PC (%) PS
782 IF5A_MAIZE Eukaryotic translation initiation factor 5A 5.61 17496.65 2 11.3 38 783 GPX4_SOLLC Probable phospholipid hydroperoxide glutathione peroxidase 6.58 18847.45 10 41.4 42
786 LGBA_SOYBN Leghemoglobin A 6.1 15373.59 1 13.9 23
Fig. 7. Frequency distribution of identified proteins from sorghum leaves within functional categories based on molecular functions, cellular components and biological processes.
고등동물에서는 미토콘드리아와 세포질에 같은 기능을 하는 다른 종류의 효소가 존재하는데 주로 미토콘드리아에 존재하 면서 molecular function으로는 미토콘드리아탈수소 효소 활성 (L-malate dehydrogenase activity)를 하는 역할을 가지고 있 으며, 세포기작으로는 탄수화물 대사과정, 말산염 대사과정 (malate metabolic process), 트리카르복시산회로(tricarboxylic acid cycle) 과정에서 이용되는 단백질이다.
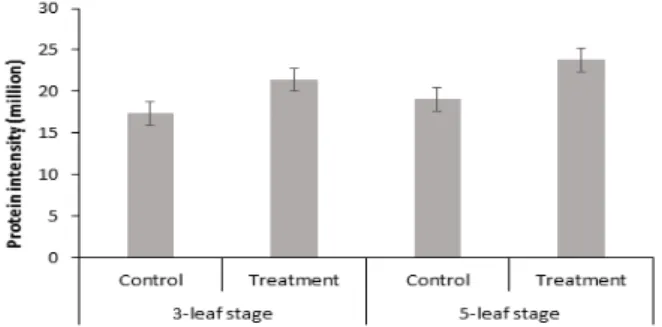
이 단백질을 대조구와 처리구 별로 비교한 그림은 Fig. 8과 같다. 3엽기와 5엽기 모두에서 대조구보다 실험구에서 더 많이 발현되는 양상을 보였는데, 이는 과습 스트레스를 받았을 때, antistress 기능을 하는 단백질로 발현함으로써 그 피해를 줄이 려는 경향을 보였다고 사료된다. 또한, 5엽기에서보다 3엽기에 서의 발현 양이 대폭 증가되어 있는 것을 보아 어린 시기에 작물 에서 말산탈수소효소(malate dehydrogenase)가 더 많이 발현 되는 양상을 보임을 확인할 수 있었다.
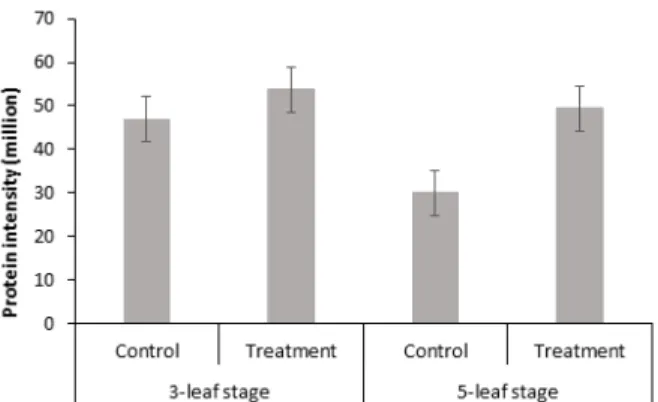
스팟 번호 579인 Oxygen-evolving enhancer protein 1은 (산소전개증폭단백질) PSBO 유전자를 가지는 단백질로서 물 분해의 주요 사이트인 망간 클러스터를 안정화 하는 역할을 하 는 단백질로 알려져 있다. 이 단백질들은 물의 분해에서 기능하 는 네 개의 Mn2+ 이온들을 결합시키고 높은 산소 발생률을 위한 환경을 유지하는 기능을 가지고 있다(Hoganson and Babcock, 1997). 엽록체 틸라코이드막(Chloroplast thylakoid membrane), 막의 외인성 성분(extrinsic component of membrane), 막의 필 수구성요소(integral component of membrane), 광화학계 Ⅱ 산소 발생 복합체(photosystem Ⅱ oxygen evolving complex) 에 주로 존재한다. Molecular function으로는 칼슘이온 결합 역 할을 하며, biological process에서는 광합성, 광화학계 Ⅱ 안정 화(photosystem Ⅱ stabilization) 과정에서 이용된다. 광합성 에 주된 작용을 하는 단백질로서 과습 스트레스에 의하여 영향
을 받는 것으로 생각되었다. 이 단백질의 발현양의 비교는 Fig.
9와 같다. 대조구에서보다 실험구에서 많이 발현되는 것으로 보 아, 과습 스트레스에 의해서 광합성에 부정적인 영향을 받아 부족 한 광합성 양을 채우기 위해 실험구에서 이 단백질이 더 많이 발현 된 것으로 사료된다.
또한, oxygen-evolving enhancer protein 1은 oxygen- evolving complex 중의 하나이기도하다. 물분해복합체(the water-splitting complex)라고도 알려져 있는 산소전개복합체 (the oxygen-evolving complex)는 광합성의 명반응 동안 물의 광산화와 관련된 수산화 효소이다. Oxygen-evolving complex 의 도움으로 photosystem II의 반응 중심의 엽록소에서 물 분자 를 산화시켜 전자를 제거하고, 결과적으로 총 2개의 물 분자가 4개의 양성자와 4개의 전자 그리고 하나의 산소 분자로 분열된 다(Yachandra et al., 1993). 이것은 membrane-lumen interface 에서 photosystem II의 핵심 단백질의 4가지 핵심 단백질로 둘 러싸여 있다. 1970년부터 Kok에 의하여 널리 인정받은 이론을 바탕으로, 이 복합체는 S0∼S4까지 5가지 상태로 존재할 수 있 으며, 광화학계(photosystem) Ⅱ에 의해 포획된 광자(photons) 는 system을 S0에서 S4로 이동시킨다. 이 중 S4는 불안정하며 물 속에서 발생하는 산소와 반응한다. 현재, 이 복합체의 메커니즘 은 완전히 밝혀진 상태가 아니기 때문에 더 많은 연구가 필요한 실정이다.
스팟 번호 442인 Glyceraldehyde-3-phosphate dehydrogenase 은 GAPC 유전자를 가지고 있는 단백질로서, 해당과정경로의 첫 번째 단계에서 D-glyceraldehyde 3-phosphate를 3-phospho- D-glyceroyl phosphate로 변환시킬 때(D-glyceraldehyde 3-phosphate + phosphate + NAD+ = 3-phospho-D-glyceroyl phosphate + NADH) 촉매로 작용하는 주요 효소이다(Ahsan et al., 2007). 이러한 반응에는 보조 효소Ⅰ(DPN) 또는 Ⅱ (TPN)
Fig. 8. Relative protein intensity patterns of malate dehydrogenase. Vertical bar represents standard error (SE) of the mean of 3 replicates.
Fig. 9. Relative protein intensity patterns of oxygen-evolving enhancer protein 1. Vertical bar represents standard error (SE) of the mean of 3 replicates.
및 무기 인산을 필요로 하는데, 식물의 효소인 경우에는 보조 효 소 Ⅱ를 필요로 한다. 세포 내 ATP level과 탄수화물 대사의 유지 관리를 위한 필수적인 key enzyme이다. 세포질에 존재하 면서 molecular function으로는 glyceraldehyde-3-phosphate dehydrogenase (NAD+) (phosphorylating) activity, NAD binding, NADP binding이 있으며, biological process로는 포도당 대사 과정, 당분해 과정에서 이용된다.
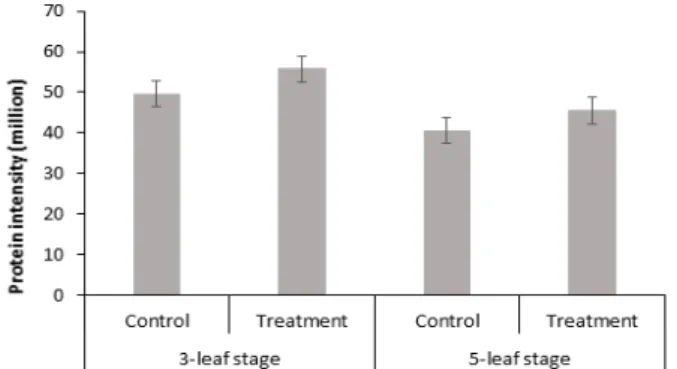
Glyceraldehyde-3-phosphate dehydrogenase의 경우 대 조구와 과습 처리구의 단백질 발현양 비교는 Fig. 10과 같다. 그 림에서 보듯이 대조구에 비해서 과습 처리구에서 발현양이 다 소 증가한 것을 볼 수 있다. 이를 토대로 과습 스트레스가 세포 내 탄수화물 대사과정에 영향을 미친다는 것을 확인할 수 있었다.
스팟 번호 773인 Superoxide dismutase [Mn] 3.4 단백질의 Gene은 SODA.3 이다. Superoxide dismutase (SOD)는 초과산 화이온을 산소와 과산화수소로 바꿔 주는 불균등화 반응을 촉 매 하는 효소로(2 superoxide + 2H+ = O2 + H2O2) 산소에 노출 되는 거의 모든 세포에서 항산화방어기작을 하는 것으로 알려 져 있다. Cofactor로 Mn2+ 이 있으며, 세포 내에서 활성 산소가 과량으로 생산되면 세포장해, 조직장해 등을 일으키는데, 이러 한 원인 중 하나인 활성 산소(activated oxygens: AO)의 불균등 화 반응을 촉매 하는 효소이다. 세포 내인성 보호 메커니즘은 superoxide dismutase와 같은 여러 효소를 포함하는데 이러한 효소들은 독성 산소 종을 효과적으로 제거할 수 있다(Ahmed et al., 2002). 미토콘드리아에 존재하면서 molecular function으 로는 금속이온 결합, 과산화물 디스뮤타아제 활성이 있으며, biological process로는 ABA (abscisic acid)에 대한 반응, 삼투 압 스트레스에 대한 반응이 있다.
Superoxide dismutase 활성의 증가는 과습 스트레스에 의한
산화 손상으로부터 식물의 보호에 필수적이다(Bowler et al., 1992). 이 단백질의 경우 무처리보다 과습 처리에서 더 많은 양 이 발현된 것으로 보아(Fig. 11) SOD가 과습 스트레스에 대해서 도 반응을 하는 것으로 보인다. 다시 말해 과습 스트레스를 받은 처리구의 식물체 내에서 활성 산소에 대한 항산화 기능을 하는 효소의 활성이 더 많아진다는 것을 의미한다. 따라서 과습 스트 레스가 식물체 내 활성 산소 발생 증가의 원인 중 하나로 작용하 는 것으로 사료된다.
스팟 번호 764인 probable phospholipid hydroperoxide glutathione peroxidase는 CSA 유전자를 가지며, glutathione 에 의해서 과산화수소, 지질 과산화물, 유기계 히드록시 과산화 물의 감소를 촉매(2 glutathione + a hydroperoxy-fatty- acyl-[lipid] = glutathione disulfide + a hydroxy-fatty- acyl-[lipid] + H2O)함으로써 산화 손상으로부터 세포와 세포 의 효소를 보호하는 역할을 하는 단백질로 알려져 있다(Sugimoto and Takeda, 2003). 세포 내 세포질 속에서 존재하며 molecular function으로는 glutathione peroxidase activity, phospholipid- hydroperoxide glutathione peroxidase activity가 있으며, biological process로는 산화 스트레스에 대한 반응이 있다.
이 단백질 역시 3엽기와 5엽기에서 모두 무처리보다 과습 처 리에서 더 많이 발현되는 양상을 확인할 수 있었다(Fig. 12). 따 라서 과습 스트레스로 인해서 세포에 손상이 유발됨을 알 수 있 었고, 이에 반응하여 과습 처리구에서 해당 단백질의 발현양이 증가된 것으로 사료된다.
적 요
밭작물 중의 하나인 수수의 재배기간 중 장기간 지속되는 토
Fig 10. Relative protein intensity patterns of glyceraldehyde- 3-phosphate dehydrogenase. Vertical bar represents standard error (SE) of the mean of 3 replicates.
Fig. 11. Relative protein intensity patterns of superoxide dismutase. Vertical bar represents standard error (SE) of the mean of 3 replicates.
양의 과습 상태는 수수의 생장 저하를 야기하는 요소로서 작용 한다. 수수 잎을 이용한 수수의 3엽기, 5엽기 과습 처리시의 단백 질을 동정한 결과 74개의 단백질들을 동정하였다. LTQ-FI-ICR MS로 분석한 결과 carbohydrate metabolic process, metabolic process, cellular metabolic compound salvage와 관련된 단백 질들이 약 50% 정도를 차지하며, 과습 스트레스를 받을 때 영향 을 미치는 것으로 보였다. Carbohydrate metabolic process와 관련된 malate dehydrogenase 단백질과 glyceraldehyde-3- phosphate dehydrogenase 단백질은 과습 스트레스를 받았을 경우 3엽기와 5엽기 모두 단백질 발현양이 증가하였다. 이러한 단백질들은 과습 스트레스에 대한 antistress 기능을 하는 단백 질로 알려져 있는데, 과습 스트레스에 반응하여 해당 단백질들 의 발현양이 증가한 것으로 사료된다. 광합성과 관련된 oxygen- evolving enhancer protein 1 단백질은 대조구에서 보다 처리 구에서 발현양이 다소 증가한 것을 볼 수 있었다. 또한, 3엽기 에 비해서 5엽기에서 발현양이 증가한 것을 확인할 수 있었다.
Response to oxidative stress와 관련된 probable phospholipid hydroperoxide glutathione peroxidase 단백질과 superoxide dismutase 단백질 모두 5엽기 처리구에서 가장 많은 발현량을 보였다. 이는 과습 스트레스에 의한 활성산소 발생이 5엽기 처 리구에서 가장 많았고, 이에 따라 항산화방어기작을 하는 단백 질의 발현이 증가한 것으로 여겨졌다.
사 사
본 논문은 농촌진흥청 연구사업(과제번호:PJ012286052017) 의 지원에 의해 이루어진 것이며, 이의 지원에 감사드립니다.
References
Ahmed, S., E. Nawata, M. Hosokawa, Y. Domae and T.
Sakuratani. 2002. Alterations in photosynthesis and some antioxidant enzymatic activities of mungbean subjected to waterlogging. Plant Sci. 163(1):117 –123.
Ahsan, N., D.G. Lee, S.H. Lee, K.Y. Kang, J.D. Bahk, M.S.
Choi and B.H. Lee. 2007. A comparative proteomic analysis of tomato leaves in response to waterlogging stress. Physiol.
Plant. 131(4):555–570.
Bowler, C., M.V. Montagu and D. Inze. 1992. Superoxide dismutase and stress tolerance. Annu. Rev. Plant Biol.
43(1):83–116.
Crawford, R.M.M. 1978. Metabolic adaptation to anoxia: In Hook, D.D. and R.M.M. Crawford (eds.), Plant Life in Anaerobic Environments. Ann Arbor, MI: Ann Arbor Science pp. 119-136.
Daugherty, C.J. and M.E. Musgrave. 1994. Characterization of populations of rapid-cycling Brassica rapa L. selected for differential waterlogging tolerance. J Exp. Bot. 8(3):385- 392.
Hoganson, C.W. and G.T. Babcock. 1997. A metalloradical mechanism for the generation of oxygen from water in photosynthesis. Science 277(5334):1953-1956.
Kim, H.R. 2014. Differential Expression of Proteins from Diploid and Tetraploid Tissue Culture of Platycodon grandiflorum. Department of Agronomy, MS Thesis, Chungbuk National Univ., Korea. pp. 3-8 (in Korean).
Kim, K.A., H.M. Kamal, K.H. Shin, J.S. Choi, H.Y. Heo and S.H. Woo. 2010. Large-scale proteomics investigation in wild relatives (A, B, D genomes) of wheat. Acta Biochim.
Biophys. Sin. 42(10):709-716.
Komatsu, S., Y. Nanjo and M. Nishimura. 2013. Proteomic analysis of the flooding tolerance mechanism in mutant soybean. J Proteomics 79:231-250.
Pandey, A. and M. Mann. 2000. Proteomics to study genes and genomes. Nature 10(6788):837-846.
Rabilloud, T. 2002. Two-dimensional gel electrophoresis in proteomics: Old, old fashioned, but it still climbs up the mountains. Proteomics 8(1):3-10.
Rocha, M., F. Licausi, W.L. Araújo, A. Nunes-Nesi, L. Sodek, A.R Fernie and J.T. van Dongen. 2010. Glycolysis and the tricarboxylic acid cycle are linked by alanine amino- transferase during hypoxia induced by waterlogging of Lotus japonicus. Plant Physiol. 152(3):1501-1513.
Fig. 12. Relative protein intensity patterns of probable phospholipid hydroperoxide glutathione peroxidase. Vertical bar represents standard error (SE) of the mean of 3 replicates.