Citation: Zhang JY, Hu J, Kim IH. 2018. Effects of γ-aminobutyric acid (GABA) on growth performance, nutrient digestibility, blood profiles, meat quality, and backfat in finishing pigs. Korean Journal of Agricultural Science 45:105-113.
DOI: https://doi.org/10.7744/kjoas.20170060
Editor: Jung Min Heo, Chungnam National University, Korea
Received: August 22, 2017
Revised: October 24, 2017
Accepted: November 20, 2017 Copyright: © 2018 Korean Journal of Agricultural Science.
This is an Open Access article distributed under the terms of the Creative Com- mons Attribution Non-Commercial License (http:
//creativecommons.org/licenses/by-nc/4.0/) which permits unrestricted non-commercial use, distribution, and reproduction in any medium, provided the original work is properly cited.
OPEN ACCESS
FOOD & CHEMISTRY
Effects of γ-aminobutyric acid (GABA) on growth performance, nutrient digestibility, blood profiles, meat quality, and backfat in finishing pigs
Jian Ying Zhang, Jing Hu, In Ho Kim
*Department of Animal Resource & Science, Dankook University, Cheonan 31116, Korea
*Corresponding author: [email protected]
Abstract
This experiment was conducted to estimate the influence of γ-aminobutyric acid (GABA) on growth performance, nutrient digestibility, blood profiles, meat quality, and backfat in finishing pigs. A total of 100 mixed finisher pigs [(Landrace × Yorkshire) × Duroc] were randomly allotted to two dietary treatments for 10 weeks, the average initial body weight was 52.03 ± 1.08 kg. Dietary treatments consisted of supplementation of GABA to 0.05%
of the basal diet (GAB) and a CON (basal diet) without supplementation . Each treatment had 10 replicates with 5 pigs per pen (three gilts and two barrows). Measurements were made at three time period: weeks 1 - 5, weeks 5 - 10 and overall experimental period.
Compared to CON, the pigs fed GABA had average daily gain (ADG) increases among phases (p < 0.05). Average Daily Feed Intake ADFI increased during the overall experimental period (p < 0.05). The digestibility of Dry Matter (DM) increased. The concentration of epinephrine decreased at 5th and 10th weeks (p < 0.05), meanwhile, cortisol decreased at 10th week (p < 0.05) in GAB treatment. Otherwise, the pigs’ GABA supplementation had no effect on meat quality and backfat thickness (p > 0.05). We conclude that a dietary supplementation of GABA at 0.05% improves growth performance and the digestibility of dry matter, while reducing the stress response of finishing pigs.
Keywords: finishing pigs, growth performance, nutrient digestibility, γ-aminobutyric acid
Introduction
Gamma-aminobutyric acid (GABA) is a primary inhibitory neurotransmitter of the central nervous system (CNS). It has been found in high concentrations in the brain (Dalvi and Rodgers, 2001). It controls of ingestive behavior by acting through GABA receptors and relieves the intensity of stress in human beings and animals (Shekhar et al., 2006). It was shown to function as a neurotransmitter not only in the CNS, but also in the peripheral nervous system, and to act as a local hormone or nutrition factor (Xu et al., 2000). In previous studies, Zou et al. (2009) found that the dietary supplementation of GABA can improve the growth performance of finishing pigs.
Baldwin (1990) found that GABA injections can improve the Average Daily Feed Intake (ADFI)
of pigs. meanwhile, the GABA was beneficial for other animals such as sheep (Girard et al.,
1985), turkey (Michael, 1991), mice (Dalvi and Rodgers, 2001), chicken (Chen et al., 2013), and sow (Fan et al., 2015a).
The inclusion of GABA in injections for mammals and avians has been studied for decades with both negative and positive results during veterinary procedures (Morteza et al., 2008; Zendehdel et al., 2009; Wang et al., 2013).
However, little research has been conducted to evaluate the effects of GABA in the diet, especially in finishing pig.
This study was conducted to investigate the effect of GABA on feed intake, nutrient digestibility, blood profiles, meat quality, and backfat thickness in finishing pigs.
Materials and Methods
The experiment was conducted at the swine experimental unit of Dankook University (Anseodong, Cheonan, Chungnam, Korea). The protocol for the current experiment was approved by the Animal Care and Use Committee of Dankook University. The γ-aminobutyric acid used in the current experiment was provided by a commercial company (Milae Resources ML Co., Ltd., Korea).
Animals and diets
A total of 100 mixed sex pigs [(Landrace × Yorkshire) × Duroc] with initial body weight (52.03 ± 1.08 kg) were used in a 10 weeks trial. Dietary treatments consisted of 0.05% of GABA in the basal diet (GAB) and a control treatment without supplementation (CON). Each treatment consisted of 10 replications per treatment and 5 pigs (3 barrows and 2 gilts) per pen. The diets were formulated to meet or exceed the nutrient requirements recommended by NRC (2012). A corn-soybean meal-based diet was formulated as a control diet (Table 1). Pigs were housed in environmentally controlled rooms at 24 ± 1 ℃ and were allowed ad libitum access to feed and water throughout the experimental period, through a self-feeder and nipple drinker, respectively.
Sampling and chemical analysis
Body weight was measured individually at the beginning, middle (5th wk), and the end (10th wk) of the experimental period. Feed consumption was recorded on a pen basis during the experiment to calculate the average daily gain (ADG), average daily feed intake (ADFI), and gain/feed ratio (G : F) (Jeong et al., 2017; Yun et al., 2017).
Chromium oxide (Cr
2O
3) was added to the diet at 0.2% of the diet as an indigestible marker for 7 days prior to fecal collection on weeks 5 and 10 to calculate dry matter (DM), nitrogen (N) and energy. Fecal grab samples were collected randomly from at least two pigs in each pen (1 gilt and 1 barrow) at weeks 6 and 12 of the experiment. All feed and fecal samples were immediately stored at - 20 ℃ until analysis. Feces samples was dried 72 hours in the dryer at 60℃ and finely ground to allow for passage through a 1 mm screen for analyzing apparent total tract digestibility of dry matter (DM) (AOAC method 930.15), nitrogen (AOAC method 990.03) and energy (using a bomb colorimeter, Parr 61.00;
Parr Instruments Co. Moline, IL), following the procedures outlined by AOAC (2000). Chromium was analyzed via UV absorption spectrophotometry (Shimadzu, UV-1201, Kyoto, Japan), following the method described by (Williams et al., 1962). Gross energy in the feces was also determined using a calorimeter (Mode 1241, Parr Instrument Co.
USA). The digestibility was then calculated using the following formula: digestibility (%) = {1 - [(Nf × Cd) / (Nd ×
Cf)]} × 100, where Nf = nutrient concentration in feces (% DM), Cd = chromium concentration in diet (% DM), Nd =
nutrient concentration in diet (% DM), and Cf = chromium concentration in feces (% DM) (Stein et al., 2006).
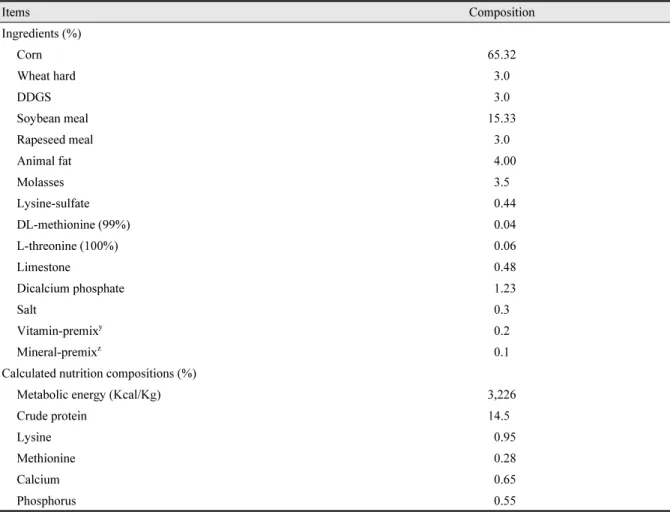
Table 1. Formula and chemical composition of experimental diet (as-fed basis).
Items Composition
Ingredients (%)
Corn 65.32
Wheat hard 3.0
DDGS 3.0
Soybean meal 15.33
Rapeseed meal 3.0
Animal fat 4.00
Molasses 3.5
Lysine-sulfate 0.44
DL-methionine (99%) 0.04
L-threonine (100%) 0.06
Limestone 0.48
Dicalcium phosphate 1.23
Salt 0.3
Vitamin-premix
y0.2
Mineral-premix
z0.1
Calculated nutrition compositions (%)
Metabolic energy (Kcal/Kg) 3,226
Crude protein 14.5
Lysine 0.95
Methionine 0.28
Calcium 0.65
Phosphorus 0.55
DDGS, Distillers dried grains with solubles.
y
Provided per kg of complete diet: 4,000 IU of vitamin A; 800 IU of vitamin D
3; 17 IU of vitamin E; 2 mg of vitamin K; 4 mg of vitamin B
2; 1 mg of vitamin B
6; 16 microgramme of vitamin B
12; 11 mg of pantothenic acid; 20 mg of niacin; 0.02 mg of biotin.
z
Provided per Kg of complete diet: 220 mg of Cu (as CuSO
4․ 5H
2O); 175mg of Fe (FeSo
4․ H
2O); 191mg of Zn (as ZnSO
4․ H
2O);
89 mg of Mn (as MnO
2); 0.3mg of I (as CaI); 0.5mg of Co (CoSo
4․ 7H
2O); 0.3 mg of Se (as Na
2SeO
3․ 5H
2O).
Two pigs were selected randomly from each pen and bled via jugular venipuncture at the beginning of the experiment. The same pigs were also bled on weeks 5 and 10 of the experiment. Blood samples were collected into 5 mL vacuum tubes with K3EDTA (Becton Dickinson Vacutainer Systems, Franklin Lakes, NJ, USA) and placed on ice until analysis. Whole blood samples were subsequently centrifuged for 15 min at 3,000 × g at 4 ℃ and the harvested serum was used to determine blood profiles. The concentration of cortisol, epinephrine, norepinephrine, glucose and erythropoietin was determined using an automatic biochemistry analyzer (HITACHI 747, Tokyo, Japan).
At the end of the experiment, the pigs were slaughtered at a local commercial slaughterhouse. After chilling at 2 ℃
for at least 24 h, two 2.54 cm thick longissimus muscle (LM) samples were removed at the 10th rib (right side of the
carcass). Meat color, sensory evaluation, pH and water holding capacity (WHC) were then measured. Meat color of
the longissimus muscle as lightness (L*), redness (a*), and yellowness (b*) was determined using a Minolta
Chromameter (CR-210, Minolta, Japan) to evaluate the freshly cut surface after 30 min of blooming at 4 ℃. Sensory
evaluation was conducted by 6 trained panelists to evaluate the color, firmness and marbling of fresh loin samples
using a three-point assessment scheme according to the procedures established by the NPPC (1991). The pH values
were measured directly at 3 points of the LM using a combined pH electrode (Nwkbinar, pH, K-21, Landsberg, Germany). The water holding capacity (WHC) was measured according to the methods described by (Kauffman et al., 1986). Briefly, a 0.3 g sample was pressed at 3,000 psi for 3 min on a 125 mm diameter piece of filter paper. The areas of the pressed sample and the expressed moisture were delineated and then determined using a digitizing area-line sensor (MT-10S; M.T. Precision Co. Ltd. Tokyo, Japan). The ratio of water: meat area was calculated, giving a measure of WHC (a smaller ratio indicates increased WHC). The longissimus muscle (LM) area was measured by tracing the LM surface at the 10th rib, which was conducted using the aforementioned digitizing area-line sensor. Drip loss was measured using approximately 2 g of meat sample at d 1, 3, 5 and 7 after slaughter according to the plastic bag method described by (Honikel et al., 1986) ,cook loss was determined as described by (Sullivan et al., 2007). The backfat of pigs was measured 6 cm off the midline at the 10th rib using a real-time ultrasound instrument (Piglot 105, SFK Technology, Herlev, Denmark).
Statistical analysis
Data were statistically analyzed by ANOVA, using general linear model (GLM) procedure of the SAS program (SAS Inst. Inc. Cary, NC, USA), for a randomized complete block design. Mean values and standard error of means (SEM) are reported. Statements of statistical significance are based on p < 0.05.
Results
Growth performance
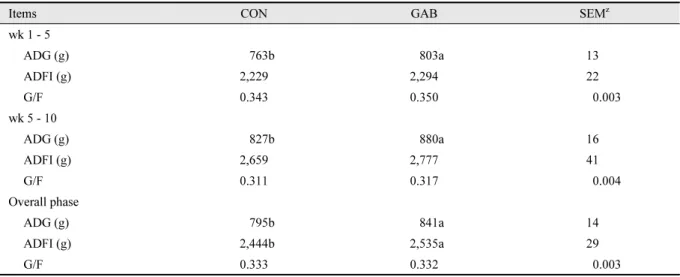
Table 2 shows, the effect of dietary supplement of GABA on the growth performance in finishing pigs. During weeks 1 - 6, 6 - 12, and the overall experimental period, ADG of the pigs in GAB treatment group was higher (p <
0.05) than that of pigs in the CON group. The ADFI of the pigs of was increased in GAB treatment group compared with CON treatment group for the overall experimental period.
Table 2. Effect of dietary supplementation of GABA on growth performance in finishing pigs.
Items CON GAB SEM
zwk 1 - 5
ADG (g) 763b 803a 13
ADFI (g) 2,229 2,294 22
G/F 0.343 0.350 0.003
wk 5 - 10
ADG (g) 827b 880a 16
ADFI (g) 2,659 2,777 41
G/F 0.311 0.317 0.004
Overall phase
ADG (g) 795b 841a 14
ADFI (g) 2,444b 2,535a 29
G/F 0.333 0.332 0.003
CON, basal diet; GAB, basal + 0.05% GABA.
z
Standard error of means.
a, b: Means in the same row with different superscript differ significantly (p < 0.05).
Nutrient digestibility
Table 3 shows the digestibility of nutrient in finishing pigs. DM digestibility was greater in GAB treatment than CON treatment (p < 0.05). The GABA supplemented diet did not affect the N and energy digestibility during experimental period (p > 0.05).
Table 3. Effect of dietary supplementation of GABA on nutrient digestibility in finishing pigs.
Items (%) CON GAB SEM
zwk 10
Dry matter 72.23b 75.72a 0.91
Nitrogen 71.78 74.18 0.86
Energy 73.18 75.31 0.83
CON, basal diet; GAB, basal diet + 0.05% GABA.
z
Standard error of means.
a, b: Means in the same row with different superscript differ significantly (p < 0.05).
Blood profiles
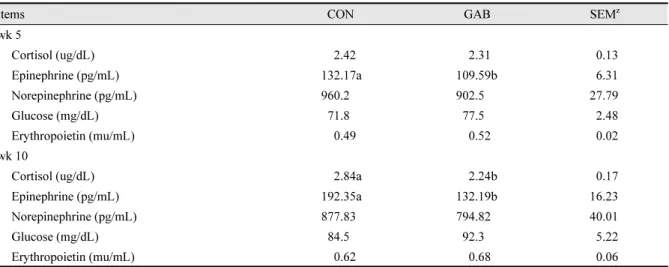
Table 4 shows, the effect of dietary supplement of GABA on blood profiles throughout experiment. Epinephrine was decreased in GAB treatment compared with CON at 5th and 10th weeks (p < 0.05). Also, cortisol was lower than CON treatment at 10th week in GAB treatment (p < 0.05). There was no effect on norepinephrine, glucose, and erythropoietin during the experiment (p > 0.05).
Table 4. Effect of dietary supplementation of GABA on blood profiles in finishing pigs.
Items CON GAB SEM
zwk 5
Cortisol (ug/dL) 2.42 2.31 0.13
Epinephrine (pg/mL) 132.17a 109.59b 6.31
Norepinephrine (pg/mL) 960.2 902.5 27.79
Glucose (mg/dL) 71.8 77.5 2.48
Erythropoietin (mu/mL) 0.49 0.52 0.02
wk 10
Cortisol (ug/dL) 2.84a 2.24b 0.17
Epinephrine (pg/mL) 192.35a 132.19b 16.23
Norepinephrine (pg/mL) 877.83 794.82 40.01
Glucose (mg/dL) 84.5 92.3 5.22
Erythropoietin (mu/mL) 0.62 0.68 0.06
CON, basal diet; GAB, basal diet + 0.05% GABA.
z
Standard error of means.
a, b: Means in the same row with different superscript differ significantly (p < 0.05).
Meat quality
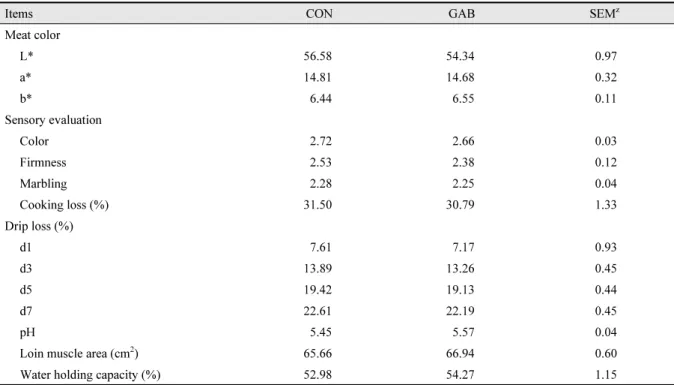
Table 5 shows the effects of dietary supplementation of GABA on meat quality throughout the experiment. The
activity of meat color, sensory evaluation, cooking loss, drip loss, pH, loin muscle area and water holding capacity did
not change during the experimental period (p > 0.05).
Table 5. Effect of dietary supplementation of GABA on meat quality in finishing pigs.
Items CON GAB SEM
zMeat color
L* 56.58 54.34 0.97
a* 14.81 14.68 0.32
b* 6.44 6.55 0.11
Sensory evaluation
Color 2.72 2.66 0.03
Firmness 2.53 2.38 0.12
Marbling 2.28 2.25 0.04
Cooking loss (%) 31.50 30.79 1.33
Drip loss (%)
d1 7.61 7.17 0.93
d3 13.89 13.26 0.45
d5 19.42 19.13 0.44
d7 22.61 22.19 0.45
pH 5.45 5.57 0.04
Loin muscle area (cm
2) 65.66 66.94 0.60
Water holding capacity (%) 52.98 54.27 1.15
CON, basal diet; GAB, basal diet + 0.05% GABA.
z
Standard error of means.
Backfat thickness
Table 6 shows the effects of dietary supplementation of GABA on backfat thickness. As compared with CON, the GABA supplementation treatment had no effect during experiment period (p > 0.05).
Table 6. Effect of dietary supplementation of GABA on backfat thickness in finishing pigs.
Items CON GAB SEM
zBackfat thickness (mm)
Initial 11.7 11.7 0.25
wk 5 15.0 15.5 0.34
wk 10 19.3 20.0 0.2
CON, basal diet; GAB, basal diet + 0.05% GABA.
z