A Study on the Analysis of Market Efficiency of Agricultural Products in E-Commerce B2C Platform
-Based on the Consumers' Price Fairness Perceptions- Xiu-Na Bai1, Gi-Young Chung2, Hyung-Ho Kim3*
1Professor, Faculty of Management, Jilin Engineering Normal University
2Professor, Dept. of Business Management, Sehan University
3Professor, Dept. of Air Transport and Logistics, Sehan University
전자상거래 B2C 플랫폼 농산물 시장효율성 분석에 관한 연구
-소비자의 가격공정성 관점 기준으로-백수나1, 정기영2, 김형호3*
1길림공정기술사범학원 공상관리학원 교수, 2세한대학교 경영학과 교수, 3세한대학교 항공교통물류학과 교수
Abstract The purpose of this study is to measure the agricultural product market efficiency of the three e-commerce platforms from the perspective of consumer price fairness perception, analyze the quality and price gap of invalid brands, and help agricultural products enterprises to formulate reasonable price strategies. The characteristics of farm products sold in e-commerce platforms(quality, origin, taste, safety level) were selected as output indicators and the prices of products were selected as input indicators to evaluate the efficiency of the market through DEA analysis. According to the analysis, JD mall has the largest proportion of effective brands, while YHD.com has the highest average market efficiency, and northeast rice has the largest difference in average efficiency among the three platforms.
The results show that price inefficiencies still exist in the electronic market. The development of online market for agricultural products should pay attention to consumer price fairness and pay attention to the coordination between price and quality. The limitation of this paper is that it does not focus on the influence of words of mouth marketing in internet market and consumer experience, which can be the future research direction.
Key Words : Market efficiency, Consumer price fairness perception, Agricultural products, B2C e-commerce platform, DEA efficiency analysis
요 약 본 연구의 목적은 중국 3대 전자상거래 플랫폼의 농산물 시장 효율성을 소비자 가격 공정성 인식의 관점에서 측정하고, 비효율적 브랜드의 품질과 가격 차이를 분석하여 농산물 판매 기업이 합리적인 가격 전략을 수립할 수 있도 록 하기 위함이다. 본 연구에서는 전자상거래 플랫폼에서 판매되는 농산물의 특성(품질, 원산지, 맛, 안전성 수준)을 산출 지표로 하고, 제품 가격을 투입 지표로 선정하여 DEA 분석을 통해 시장의 효율성을 평가하였다. 분석 결과 효율 적 브랜드의 비중은 JD몰이 가장 높고, YHD.com은 평균 시장 효율이 가장 높았으며, 동북 쌀은 3개 플랫폼에서 평균 효율성 차이가 가장 큰 것으로 나타났다. 이러한 결과는 가격 비효율성이 여전히 전자 시장에 존재한다는 것을 보여준 다. 농산물 온라인 시장의 발전을 위해서는 소비자 가격공정성에 주의하고 가격과 품질의 조화를 중시해야 한다. 이 논문의 한계점은 인터넷 시장에서 소비자 경험에 의한 입소문 마케팅의 영향력에 초점을 맞추지 않았다는 점이며, 이는 향후 연구 과제이다.
주제어 : 시장 효율성, 소비자 가격 공정성 인식, 농산물, B2C 전자상거래 플랫폼, DEA 효율성 분석
*Corresponding Author : Hyung-Ho Kim([email protected]) Received March 11, 2020
Accepted June 20, 2020 Revised May 29, 2020
Published June 28, 2020
1. Introduction
With the commercial application of Internet technology, the business volume of electronic market expands rapidly. In 2018, China's e-commerce transactions totaled 31.63 trillion yuan with a year-on-year increase of 8.5%. The transaction scale of online retail market reached 9.0 trillion yuan with a year-on-year increase of 3.9%. The total online retail sales of physical goods totaled 7.0 trillion yuan with a year-on-year increase of 25.4 percent. Its share of total retail sales of consumer goods rose from 10.8% in 2015 to 18.4% in 2018[1]. The number of Chinese agricultural products online users has maintained rapid growth. China's online retail sales of agricultural products reached 230.5 billion yuan in 2018, up 33.8 percent year-on-year, according to an analysis report on the market competition trend and investment strategy of e-commerce industry in 2018-2019 released by the Ministry of Commerce. Among them, leisure food, tea and tonic food sales ranked the top three, accounting for 24.2%, 12.5% and 12.0% respectively. Fruits, condiments, soybean products and other agricultural products showed the fastest year-on-year growth, with 45.6 percent, 41.9 percent and 41.3 percent respectively.
The continuous expansion of online retail transaction volume of food products shows that consumers' living expenses have begun to shift to the electronic market. The research on the traditional market shows that the market plays an important role in the development of human economy. An effective market can match the resources and services according to the needs of consumers, so that consumers can get more benefits with less investment and provide the maximum utility for consumers on the premise of satisfying the needs. Price dispersion is an important index to measure market efficiency, there is a significant price dispersion in the
traditional market[2,3]. How efficient is the electronic market? Some scholars have suggested theoretically that with the convergence of information technologies such as the Internet and the popularization and use of tools such as search engines, the electronic market will improve the quality of price information, form price convergence, increase efficiency, and consumers will get lower prices and more consumer surplus[4]. However, the research on market efficiency and price dispersion has not stopped because of the emergence of the electronic market, and the price difference still exists in the electronic market[5]. Therefore, it is of great significance to promote the development of the electronic market of agricultural products by combining with the multi-platform competitive environment, studying the efficiency of the electronic market of agricultural products from the perspective of consumer price fairness.
2. Literature review
The research on market efficiency mainly focuses on the price-quality relationship and price dispersion, especially on the consumer market efficiency. The so-called price dispersion refers to the price distribution of identical goods sold by different sellers in the same market at the same time. The homogeneous commodities mentioned here can be products of the same brand, products of the same model or products with the same functions[6]. It is generally believed that if the commodity price of the same quality level is the same or close to each other, the correlation between price and quality will be high and the dispersion of price will be low.
Many studies have found that price quality is weakly correlated and price dispersion is significant [7]. A market with a large degree of price dispersion, quality value can not be reflected in the price, the market is inefficient.
Hjorth-andersen believes that quality research should be based on the multiple characteristics of various products, and quality evaluation is meaningful only when all product characteristics are strongly collinear[8]. An effective brand should be independent of other brands in all attributes. Kamakura believes that a brand is efficient if it provides the highest value for every dollar consumers spend on a set of product attributes[9]. Any brand that does not meet this standard is likely to be considered inefficient.
Nagle believes that consumers can only be sensitive to product prices if they have a lot of brand information. The reason why consumers choose "inefficient brands" in the market is information asymmetry[10]. Stigler also attributed the price difference to information asymmetry.
Due to the high market search cost, some consumers gave up looking for the lowest price goods of the same quality, resulting in the dispersion of market prices.
According to economics, market efficiency plays an important role in influencing China's social and ecBased on the fact that the online market has significantly reduced the searching cost of consumers and greatly improved the transparency of price information, the academic circle has restarted the discussion on price dispersion. Bailey was the first to conduct empirical test. Through price tracking and statistical analysis of books, CDS and computer software in the online market and the traditional market, he proposed that price dispersion still exists in the online market and is not less than that in the traditional market[11]. Kauffman and Wood put forward that the emergence of the Internet market brings an opportunity for sellers to diversify[12]. Online market allows merchants to more easily pursue market segments and more easily lead or follow prices, making it more difficult for product prices to fall to an equilibrium position close to marginal cost compared with traditional market. Therefore, the
differentiation strategy of merchants increases the degree of market price dispersion. Some studies have pointed out that differences in e-commerce platforms are the driving factors for price differences[13]. Some people also believe that product type difference is the main reason for network price dispersion[14]. Thus, manufacturers and sellers can easily combine different products and services to achieve the goal of price discrimination and profit maximization. Therefore, the price dispersion in the market will not disappear because of the development of the network market, and consumers still need to make great efforts to identify various products. For a purchase decision, maximizing utility becomes more difficult. Only an efficient market can allocate the limited resources to the enterprises and industries with the best benefits, thus creating the maximum output and maximizing social Fairness. Some scholars have studied the efficiency of e-commerce platform from the perspective of enterprises. Some scholars made an empirical analysis of the efficiency of 45 e-commerce platforms from the perspective of input and output, and concluded that most platforms with low efficiency were caused by the small scale. Zhang tijun and wang tielianalyzed the operational efficiency of Chinese e-commerce platform enterprises with dea-malmquist research method, but did not consider the interests of consumers[15].
With consumer value becoming the core of enterprise marketing research, consumer Fairness is becoming more and more important, and the research on consumer Fairness is gradually carried out. Based on the perspective of consumer price Fairness, Fu-Ming used the regression analysis method to study the influencing factors of online international air ticket prices[16]. It is pointed out that from the perspective of airlines, the main factors affecting ticket prices include service quality and product strategy, while from
the perspective of consumers, the main factors affecting ticket prices include time factor and environment factor. Esteves & Resende by comparing the results under customized advertising/personalized pricing decision, and large-scale advertising/results under uniform pricing, to examine personalized pricing and targeted advertising competition and Fairness effect[17]. The research indicates that under the personalized ads with personalized pricing strategy, all segments of consumers need to pay a higher average prices. Esteves & Resende Targeted advertising with price discrimination may increase the company's profits, however, consumers' benefits may suffer.
Some relevant literatures have provided important references for this study. Compared with the existing research literature, this paper may have some marginal contribution in the aspects of research object, research Angle and research method. This paper selects the agricultural products electronic market as the object to analyze the market efficiency of the three major e-commerce platforms in China. Try to measure consumer price Fairness from the perspective of multi-dimensional quality of agricultural products, According to the cost-benefit evaluation method of consumer Fairness, the DEA research method is used to analyze the price efficiency.
3. Research methods
Economists often assume that consumers are rational when they make decisions, and that they are the best judges of how much they get from what they buy. The most basic starting point for customers to measure the purchase value is the measurement of quality and price. From the perspective of consumers' price Fairness, the price of goods belongs to consumers' capital input, and a series of quality characteristics of
corresponding goods belong to consumers' income (output), and consumers' different preferences of quality characteristics should also be respected. Based on the previous studies of Kamakura and Jiang & Balasubramanian, this paper proposes to use data envelope-analysis (DEA) to measure the market efficiency of five types of agricultural products on three e-commerce platforms from the perspective of consumer price Fairness[4,9].
3.1 DEA Analysis
Data envelopment-analysis is an evaluation model based on the principle of mathematical programming, which is mainly used to evaluate the relative efficiency between decision units with multiple inputs and outputs, referred to as
"DEA". There are two kinds of basic models : CCR model and BCC model.
CCR model is the evaluation of the comprehensive efficiency of dmu under the assumption that the return on scale remains unchanged. CCR model is divided into input oriented model(CCR-I) and output oriented model(CCR-O). The constraint condition
is added into the CCR model, that is, the hypothesis of variable return on scale is added, and the BCC model is obtained. The BCC model includes input-oriented model (BCC-I) and output-oriented model (BCC-O).
The following is an example of input-oriented BCC model (BCC-I), which can be expressed as:
min
≥ ≥ ≥
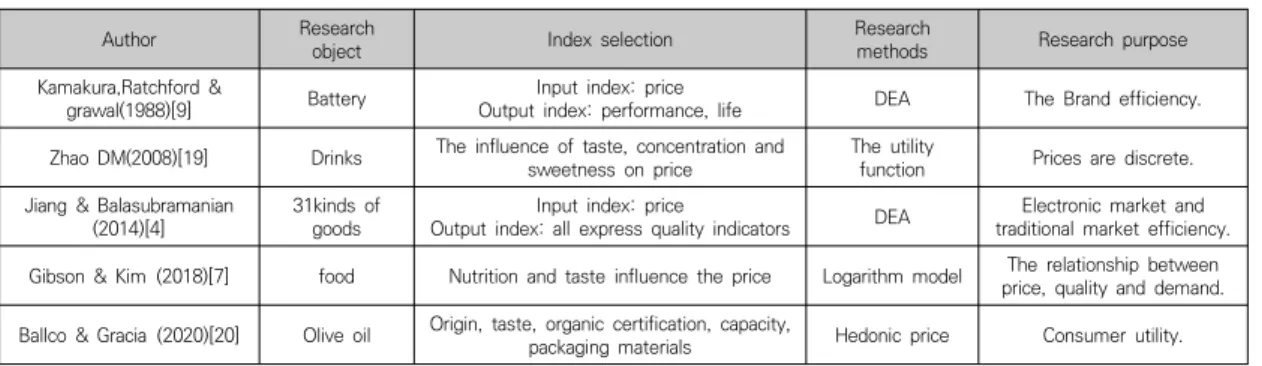
Author Research
object Index selection Research
methods Research purpose Kamakura,Ratchford &
grawal(1988)[9] Battery Input index: price
Output index: performance, life DEA The Brand efficiency.
Zhao DM(2008)[19] Drinks The influence of taste, concentration and
sweetness on price The utility
function Prices are discrete.
Jiang & Balasubramanian
(2014)[4] 31kinds of
goods Input index: price
Output index: all express quality indicators DEA Electronic market and traditional market efficiency.
Gibson & Kim(2018)[7] food Nutrition and taste influence the price Logarithm model The relationship between price, quality and demand.
Ballco & Gracia(2020)[20] Olive oil Origin, taste, organic certification, capacity,
packaging materials Hedonic price Consumer utility.
Table 1. Index selection references
The input-oriented BCC model evaluates the input of each decision making unit while keeping the output constant.
If , and , ,then is technically valid.
If < 1, it indicates that the input resource allocation level needs to be improved, and the
is invalid as A pure technology.
The pure scale efficiency can be calculated by dividing the comprehensive efficiency by the pure technical efficiency. The pure scale efficiency represents the gap between the current scale and the optimal scale of the decision-making unit under the constraints of production technology.
Papers using Input-oriented model have Jiang and Balasubramanian, Y. H. Liu's thesis etc.
[4,18].
For this study, we use DEA model to compare the price efficiency of selected agricultural product brands' price and quality indicators through linear combination. If the efficiency value is less than 1, it means that the selling price of this brand exceeds that of other brands with the same attributes , then it belongs to ineffective price or low price efficiency. From the perspective of output quality, it can also be understood that if the efficiency value is less than 1, it indicates that compared with other brands with the same price, this brand has a lower quality level. It is a Fairness loss for consumers whether they pay a high price for the same quality or get a low quality product at the
same price. In this study, we use the BCC-I model because the scale return of price input and quality output is variable, and the price Fairness of consumers is a comparison of price efficiency of homogeneous goods. DEA model can more directly reflect the relationship between quality and price in consumer market. It helps us measure the loss of consumer Fairness according to the price efficiency of agricultural products brands on different e-commerce platforms. Indicate the extent to which certain brands have strayed from the efficiency frontier.
Through the analysis of data results, it can provide Suggestions to transform inefficient brands into the forefront of efficiency.
3.2 Selection of indexes
In the selection of input-output index, this paper refers to the existing literature on quality price measurement, as shown in Table 1.
Kamakura, Ratchford & grawal used DEA method to measure the traditional market efficiency from the perspective of price dispersion, and selected price and product quality as the input-output index in its research[9]. Jiang & Balasubramanian also adopted DEA method when comparing the efficiency of traditional market and electronic market, and selected price and product quality as input-output index[4]. Zhao dongmei mentioned that the taste, concentration and sweetness of drinks had an impact on the price when he used the utility function to measure the discrete price
product category Input index Output index
Organic pure milk(5) price Protein content, calcium content, place of origin, packaging specification.
Pressed peanut oil(6) price Product level, pressing process, raw material quality, flavor level, packaging specification.
The northeast rice(8) price Energy content, protein content, carbohydrate content, place of origin, taste level, safety label level, packaging specification.
Fresh beef flank meat(6) price Refrigerating method, place of origin, feeding method, safety mark level, packing specification.
Yanbian apple-pear(3) price single fruit weight, taste.
Table 2. The choice of input-output index
in the market[19]. Gibson & Kim analyzed the relationship between price, quality and demand of food commodities by using a logarithmic model, and discussed the influence of quality attributes such as nutrition and taste of food on price[7]. Ballco & Gracia in analyzing olive oil quality characteristics and consumer utility, quality attributes such as origin, taste, organic certification, capacity and packaging materials are taken into account[20]. The above literature is the main reference for the selection of input-output indicators in this paper.
In addition, we need to consider whether the index can be obtained. The advantage of electronic market over traditional market is that product quality information can be easily inquired and compared. The main purpose of merchants to display product quality information through e-commerce platforms is to highlight product quality characteristics and form product differences, prove the matching between quality and price, and guide customers to purchase.
Therefore, all quality information that can be inquired on the platform can be used as a measurement index. By querying the agricultural product information of TMALL, JD Mall and YHD.com, it is found that the information of online stores of food agricultural products mainly focuses on brand, price, place of origin, taste, packaging specifications, nutritional ingredients, organic certification, quality level and other aspects.
Considering consumers' preference for different quality indicators, we refer to the
factors that Chinese users value when buying fresh products online, published by iresearch in 2019. In order of importance are safety, quality, taste, brand, price, public praise, purchase convenience, place of origin, category and packaging, as shown in Fig. 1.
Fig. 1. Consumers value factor rankings when buying agricultural products
Data source: iresearch consulting institute ww.iresearch.com.cn
In this study, the selection of input-output index comprehensively takes the above situations into consideration. Input index chooses the price of product (fold hind, do not include postage).
The selection of output indexs are mainly based on quality, origin, taste, certification and other indicators, which are adjusted according to different product categories. As shown in Table 2, taking milk products as an example, the quality indexes available from the network include protein content, fat content, calcium content, carbohydrate content, place of origin, packaging specification and other information.
Brand TMALL JD Mall YHD.COM
CRS VRS SE RTS CRS VRS SE RTS CRS VRS SE RTS
ATINE 1 1 1 CRS 0.8848 0.8848 1 CRS 0.8874 0.8874 1 CRS
SANYUAN 0.9219 0.9219 1 CRS 0.9922 0.9922 1 CRS 0.9595 0.9922 0.9671 CRS
I Nature 0.6942 1 0.6942 DRS 0.7343 1 0.7343 DRS 0.7053 1 0.7053 DRS
Better 0.7683 0.7683 1 CRS 0.8269 0.8269 1 CRS 0.7996 0.8269 0.9670 CRS
SHENGMU 1 1 1 CRS 0.9773 0.9773 1 CRS 0.8914 0.9086 0.9811 CRS
Milk Deluxe 0.681 0.681 1 CRS 0.7679 0.7679 1 CRS 0.8062 0.8062 1 CRS
Guangming 0.9642 1 0.9642 DRS 1 1 1 CRS 1 1 1 CRS
Europe-asia 0.9248 0.9248 1 CRS 0.943 0.943 1 CRS 0.9118 0.943 0.9669 CRS
Guiyi GLOBE 0.9226 0.9226 1 CRS 0.993 0.993 1 CRS 0.9602 0.993 0.9670 CRS
Anchor 0.962 1 0.962 DRS 1 1 1 CRS 1 1 1 CRS
Veco zuivel 0.5684 0.6101 0.9317 DRS 0.6023 0.6055 0.9947 CRS 0.5474 0.5474 1 CRS
GLOBE 0.5842 0.6342 0.9217 DRS 0.6376 0.6376 1 CRS 0.6053 0.6053 1 CRS
Garden 0.7513 0.7586 0.9904 CRS 0.8128 0.886 0.9174 CRS 0.7889 0.8411 0.9379 CRS
Pamir Mountains 0.6242 0.6243 0.9998 CRS 0.6719 0.6719 1 CRS 0.6592 0.6719 0.9811 CRS
Youchun 0.9724 1 0.9724 DRS 1 1 1 CRS 0.9637 1 0.9637 DRS
Average 0.8226 0.8564 0.9624 0.8563 0.8791 0.9764 0.8324 0.8682 0.9625
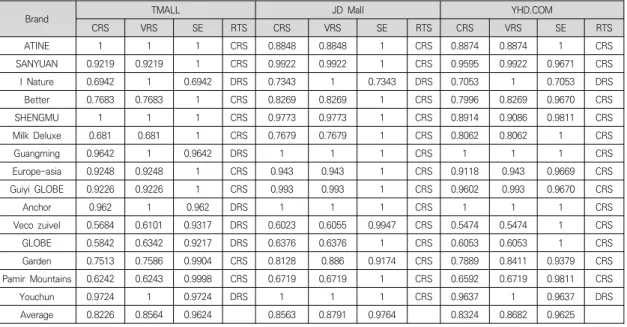
Table 3. Statistical table of market efficiency of organic pure milk on three B2C e-commerce platforms
In terms of composition content, protein and calcium content have the greatest impact on milk quality. The price varies with different packing specifications. Based on the focus of consumers and the results of current studies, protein content, calcium content, place of origin and packaging specifications were selected as the output indexes of milk product quality. These indexes include quantitative indicators, orderly numerical indicators and nominal indicators. We processed the data according to the research methods of Kamakura et al.
3.3 Data collection
The agricultural products sold on the e-commerce platform are mainly food products, which are divided into 11 categories. According to the sales ranking of fresh products on the e-commerce platform published by iresearch consulting, we selected five representative agricultural products closely related to people's life, which are the organic pure milk, pressed peanut oil, northeast rice, fresh beef flank meat and yanbian apple-pear. In terms of the choice of B2C retail e-commerce platform, three
e-commerce platforms, namely TMALL1), JD Mal l2) and YHD,com3) were selected according to iresearch consulting fresh e-commerce ranking.
In the selection of each type of product brand, we first select the brand products sold on the three platforms through the price comparison website, and then query the published quality information on the platform. In order to make the product prices on different platforms comparable, data collection was conducted on each platform within the same period, with the data collection mainly focused on October 10-13, 2019.
4. Empirical analysis
Firstly, we introduce the process of analyzing the price efficiency of similar products by taking organic pure milk as an example. Table 3 shows the efficiency of 15 organic pure milk brands on TMALL, JD Mall and YHD.com. In TMALL, the 1) https://www.tmall.com/
2) https://fresh.jd.com/
3) https://www.yhd.com/
Input index 1(O) 2(O) 3(O) 4(O)
Max 8 250 3 3.8 150
Min 4.125 200 1 2.9 100
Average 6.133 230.667 1.867 3.393 118.333
SD 1.271 23.795 0.718 0.269 14.568
notes: 1(o)=packaging specification; 2(o)=place of origin; 3(o)=Protein content; 4(o)=calcium content Table 4. Statistics on Input/Output Data
Brand Weighted Data Projection
I 1(O) 2(O) 3(O) 4(O) I 1(O) 2(O) 3(O) 4(O)
ATINE 1 0 0.3627 0.6372 0 4.994 0 0 0 0
SANYUAN 1 0.9219 0 0 0 4.994 0 200 16.129 20
I Nature 1 0 0 0 0.6942 5.380 4.348 30.435 34.511 0
Better 1 0.5971 0 0.1711 0 4.994 0 200 0 0
SHENGMU 1 0.8095 0 0 0.1904 4.125 0 0 0 0
Milk Deluxe 1 0.5692 0 0 0.1117 4.994 0 0 0 0
Guangming 1 0 0 0.9642 0 4.5 9.091 118.182 0 4.545
Europe-asia 1 0.9248 0 0 0 4.994 0 200 2.857 20
Guiyi GLOBE 1 0.9225 0 0 0 4.994 0 200 20 20
Anchor 1 0 0.3369 0.6250 0 5.170 2.963 0 0 6.481
Veco zuivel 1 0 0 0.5683 0 4.5 9.091 9.091 0 4.545
GLOBE 1 0 0 0.5841 0 4.625 12.121 12.121 0 7.449
Garden 1 0.6187 0 0 0.1326 4.257 0 16.316 0.855 0
Pamir Mountains 1 0.6242 0 0 0 4.994 0 50 24.138 9.091
Youchun 1 0 0 0 0.9724 5.380 30.435 30.435 34.511 0
Instructions: I=price;1(o)=packaging specification;2(o)=place of origin;2(o)=Protein content;3(o)=calcium content Table 5. TMALL 15 milk brand data
efficiency value of 7 brands such as SATINE and SHENGMU is 1, which are effective brand. The remaining 8 brands are invalid brands, the proportion of effective brands is 46.7%, and the average efficiency is 0.9624. The brand with the lowest price efficiency is I Nature, with an efficiency value of 0.6942. Tables 4 and 5 are provided for detailed interpretation of the data.
By inquiring the "Weighted Data" table in the DEA data results, it is found that when the input index is normalized to 1, the weight value of packaging specification of the brand is 0, the weight value of the place of origin is 0, the weight value of protein content is 0, and the weight value of calcium content is 0.6942.
As shown in table 5. It shows that the first three quality indexes do not contribute to the total quality of the product, and the calcium content index makes the largest contribution.
According to the Projection data table, in order to make I Nature an effective brand, the price can be reduced from 7.75 yuan to 5.38 yuan in terms of pricing strategy, a reduction of 30.575%.
If the current price remains unchanged, in order to make I Nature an effective brand, the packaging specification needs to be increased by 4.348%, the origin level needs to be increased by 30.44%, the protein content needs to be increased by 34.51%, and the calcium content should remain unchanged. For consumers who only choose to shop in TMALL, the Fairness gained by their consumption expenditure has a loss of 3.76%. In JD Mall, the efficiency value of 12 brands such as SATINE and SHENGMU is 1, which are effective brand. The remaining three brands are invalid brands, with the effective brands accounting for 80% and the average efficiency of 0.9764. The brand with the lowest
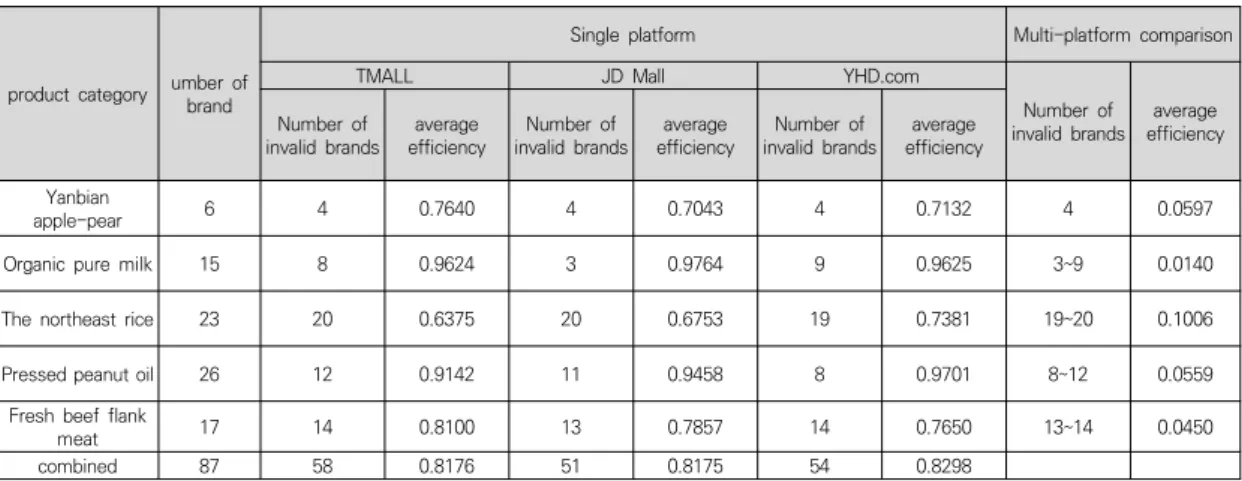
product category umber of brand
Single platform Multi-platform comparison
TMALL JD Mall YHD.com
Number of
invalid brands average efficiency Number of
invalid brands average
efficiency Number of
invalid brands average
efficiency Number of
invalid brands average efficiency Yanbian
apple-pear 6 4 0.7640 4 0.7043 4 0.7132 4 0.0597
Organic pure milk 15 8 0.9624 3 0.9764 9 0.9625 3~9 0.0140
The northeast rice 23 20 0.6375 20 0.6753 19 0.7381 19~20 0.1006
Pressed peanut oil 26 12 0.9142 11 0.9458 8 0.9701 8~12 0.0559
Fresh beef flank
meat 17 14 0.8100 13 0.7857 14 0.7650 13~14 0.0450
combined 87 58 0.8176 51 0.8175 54 0.8298
Table 6. Efficiency statistics of B2C e-commerce retail platforms of different types of agricultural products price efficiency was still I Nature, with an
efficiency value of 0.7343. For consumers who only choose to shop on the platform of JD Mall, the Fairness gained from their consumption expenditure has a loss of 0.236%. In YHD.com, the efficiency value of SATINE, Milk Deluxe and other 6 brands is 1, which are effective brand, while the remaining 9 brands are invalid brands.
The number of effective brands was 40%, and the average efficiency was 0.9625. The brand with the lowest price efficiency was still I Nature, with an efficiency value of 0.7053. For consumers who only choose to shop on yhd.com, 3.75% of the benefits of their consumption expenditure are lost. For single-platform shoppers, JD Mall's shoppers gain the most consumer value. But in fact, for products like organic pure milk, the efficiency values of the above three retail platforms are not much different. Analysis of the reasons, since China's milk industry after a major quality event, both milk manufacturers, and consumers are very cautious about milk products. Especially for the high price of organic pure milk, consumers pay more attention to it, which leads to the disclosure and transparency of price information and product characteristics and attributes among brands and sales platforms.
The transparency of information enables it to have higher market efficiency.
In the same way, the DEA model was used to further verify the market efficiency of four other agricultural products: yanbian apple-pear, northeast rice, pressed peanut oil and fresh beef flank meat.
Table 6 shows the number of invalid brands and average efficiency of 5 types of agricultural products on the three platforms of TMALL, JD Mall and YHD.com. Compared with the three platforms, among the 87 agricultural products brands selected in this paper, the number of invalid brands in TMALL is 58, accounting for 66.67% and the average efficiency is 0.8176. The number of invalid brands in JD Mall is 51, accounting for 58.62%, with an average efficiency of 0.8175. The number of invalid brands in YHD.com was 54, accounting for 62.07% and the average efficiency was 0.8298.
The data analysis results show that TMALL has the largest proportion of invalid brands, but the average efficiency is close to that of JD Mall. JD Mall has the lowest percentage of invalid brands.
This is because compared with the two platforms, TMALL platform has a large number of invalid brands, but its average efficiency value is not much different. In terms of product types, JD Mall had fewer ineffective brands of full-fat organic pure milk and fresh brisket, and the highest average efficiency value of full-fat
organic pure milk. YHD.com has a relatively small number of inefficient brands for northeast rice and pressed peanut oil, which also have the highest average efficiency values. TMALL's fresh beef flank and yanbian apple-pear have the highest efficiency value. The horizontal comparison of the average efficiency of each type of agricultural products in each platform shows that the gap value is between 0.0148-0.1006. Except for the gap of northeast rice above 0.1, the gap of other products is not large. It can be seen that although e-commerce platform makes agricultural product information more accessible and transparent, there are still a large number of invalid brands, which are just different according to different product categories.
5. Conclusions and recommendations
Different from other existing researches, this study compared the market efficiency of agricultural products with different attributes and characteristics on different B2C e-commerce platforms from the perspective of consumer price Fairness. It provides a method for online shoppers to measure the price efficiency of different brands of the same product and the market efficiency of different platforms. From the data analysis results, the market efficiency of different e-commerce platforms is different.
E-commerce platform of agricultural products also has low efficiency. Although some brands differentiate their products by packaging specifications, quality indicators, etc., the proportion of invalid brands is still high when measured by the input-output efficiency of DEA.
From the efficiency performance of the same brand in different platforms, the gap between platforms is small. The efficiency value of the same brand is similar in different platforms, which indicates that the price of the same brand is similar in different e-commerce platforms, and
each brand pays more attention to the balance of interests of each channel. In addition, the data also showed that the market efficiency of different types of agricultural products was different. Although the electronic market has greatly improved the transparency of product information, the differences between different brands still exist, resulting in the decrease of market efficiency. In the process of measuring market efficiency, agricultural products with clear attributes are not easy to be dominated by other brands and show high efficiency. Like organic pure milk. However, attribute characteristics are difficult to quantify, and agricultural products that have a greater impact on prices, such as rice in northeast China, exhibit lower market efficiency.
Based on the above conclusions, the following Suggestions are made:
Choose a reasonable pricing strategy. Price is one of the effective means of competition between platform and brand. According to the key attributes of agricultural products, such as origin, organic certification, nutrient content, taste, production safety level and other factors, compare the prices of similar products, actively formulate and adjust product prices, formulate different price schemes, and effectively improve the choice intention of customers.
Actively respond to competitors with similar product quality. The competition between different brands is carried out among enterprises with similar product quality level and cross-over target customers. When formulating strategies for the same and similar brands, price and quality should be considered comprehensively. What consumer compares is the relative phase rate of input and output, high quality high price, low quality low price accord with consumer cognition law. The DEA analysis results also support the comparison of relative efficiency. Therefore, the accurate choice of competitors, targeted competition strategy, will have better results.
Enterprise pricing should take into account the price benefits of consumers. Consumer recognition and continuous purchase is the fundamental goal of enterprise marketing activities.
Consumer price Fairness is a direct factor influencing consumers' perception of fairness and plays a direct role in their purchasing decisions. Therefore, enterprises should consider the balance between price and quality in pricing from the perspective of consumers.
This study assumes that all product attributes and features are presented on the e-commerce platform, but in fact, some characteristics of agricultural products are not fully presented.
Therefore, future research should link the market share and reputation of agricultural products brands with the change of efficiency score to enhance the explanatory power of price efficiency.
REFERENCES
[1] L. Gao, J. S. Han & H. H. Kim. (2019). A Review of the Research on E-commerce Ecosystem in China. Journal of Digital Convergence, 17(8), 141-148.
DOI:10.14400/JDC.2019.17.8.141
[2] Y. M. Baek. (2015). Current status of E-commerce market in China and implication. Journal of Digital Convergence, 13(1), 111-124.
DOI:10.14400/JDC.2015.13.1.111
[3] J. D. Song & C. W. Lee. (2017). Chinese Online Circulation Market and Market Approaching Strategy.
Journal of Digital Convergence, 15(8), 477-487.
DOI:10.14400/JDC.2017.15.8.477
[4] P. Jiang & S. K. Balasubramanian. (2014). An empirical comparison of market efficiency: electronic marketplaces vs. traditional retail formats. Electronic Commerce Research and Applications, 13(2), 98-109.
https://doi.org/10.1016/j.elerap.2013.11.003
[5] D. Lu. (2019). Research on Domestic Online Airline Ticket Sales Market Efficiency———A Study Based on Discrete Data of Online Ticket Prices. Price theory and practice, (08), 137-140.
https://www.cnki.com.cn/Article/CJFDTotal-JGLS2019 08032.htm
[6] G. J. Stigler. (1961). The economics of information.
Journal of Political Economy, 69(3), 213-225.
DOI:10.1086/258464
[7] J. Gibson & B. Kim. (2019). Quality, quantity, and
spatial variation of price: Back to the bog. Journal of Development Economics, 137, 66-77.
https://doi.org/10.1016/j.jdeveco.2018.11.008 [8] Hjorth-Andersen & Chr. (1984). The concept of
quality and the efficiency of markets for consumer products. Journal of Consumer Research, 11(2), 708.
DOI:10.1086/209007
[9] W. A. Kamakura, B. T. Ratchford & J. Agrawal. (1988).
Measuring market efficiency and Fairness loss. Journal of Consumer Research 15 (December), 289-302.
https://doi.org/10.1086/209167
[10] T. Nagle. (1984). Economic foundations for pricing.
Journal of Business, 57(1), S3-S26.
https://www.jstor.org/stable/2352919
[11] J. P. Bailey. (1998). Intermediation and electronic markets: Aggregation and pricing in Internet commerce. Doctoral dissertation, Massachusetts Institute of Technology.
[12] R. J. Kauffman & C. A. Wood. (2007). Follow the leader: price change timing in Internet‐based selling.
Managerial and Decision Economics, 28(7), 679-700.
https://doi.org/10.1002/mde.1375
[13] M. Dinerstein, L. Einav, J. Levin & N. Sundaresan.
(2018). Consumer price search and platform design in internet commerce. American Economic Review, 108(7), 1820-1859.
DOI:10.1257/aer.20171218
[14] D. Aparicio & A. Cavallo. (2019). Targeted Price Controls on Supermarket Products. Review of Economics and Statistics, 1-41.
https://doi.org/10.1162/rest_a_00880
[15] T. J. Zhang & T. L. Wang. (2018). Business efficiency analysis of Chinese e-commerce platform enterprises based on dea-malmquist. Business economy research, 03.
https://www.cnki.com.cn/Article/CJFDTotal-SYJJ2018 03027.htm
[16] M. Fu. (2019). Research on the Factors Affecting the Airline International Airline Price———Based on the analysis of consumer price Fairness perspective. Price theory and practice, (5), 145-148.
https://www.cnki.com.cn/Article/CJFDTotal-JGLS2019 05037.htm
[17] R. B. Esteves & J. Resende. (2019). Personalized pricing and advertising: Who are the winners?.
International Journal of Industrial Organization, 63, 239-282.
https://doi.org/10.1016/j.ijindorg.2018.11.003.
[18] Y. H. Liu. (2019). Efficiency evaluation of Chinese commercial Banks based on DEA model. Financial theory and practice, (09), 69-77.
https://kns.cnki.net/kcms/detail/41.1078.F.20190828.1 658.018.html
[19] D. M. Zhao. (2005). Price Dispersion of E-commerce Market. China agricultural university, doctoral dissertation, 2005.
https://cdmd.cnki.com.cn/Article/CDMD-10019-2005 085008.htm
[20] B. Petjon Ballco & G. Azucena.(2020. Do market prices correspond with consumer demands?
Combining market valuation and consumer utility for extra virgin olive oil quality attributes in a traditional producing country. Journal of Retailing and Consumer Services, 53 (2020), 101999.
https://doi.org/10.1016/j.jretconser.2019.101999
백 수 나(Xiu-Na Bai) [정회원]
․ 2003년 6월 : 장춘공정학원 (관리학학 사)
ㆍ2008년12월 :길림대학 관리학원 (관 리학석사)
ㆍ2018년 5월 ∼ 현재 : 세한대학교 경 영대학원 박사과정
ㆍ2003년 9월 ∼ 현재 : 길림공정기술 사범학원 공상관리학원 교수
ㆍ관심분야 : 마케팅, 기업 관리 ㆍE-Mail : [email protected]
정 기 영(Gi-Young Chung) [정회원]
․ 1984년 2월 : 조선대학교 공과대학(공 학사)
ㆍ1986년 8월 : 명지대학교 대학원 무 역학과(경영학석사)
ㆍ1990년 5월 : University of Bridgeport (경영학석사)
ㆍ1993년 5월 : Golden Gate University (경영학박사)
ㆍ1997년 3월 ∼ 현재 : 세한대학교 경영학과 교수 ㆍ관심분야 : 고객관계관리, 장소마케팅
ㆍE-Mail : [email protected]
김 형 호(Hyung-Ho Kim) [정회원]
․ 1989년 2월 : 경희대학교 전자계산공 학과(공학사)
ㆍ1992년 8월 : 경희대학교 전자계산공 학과(공학석사)
ㆍ2018년 2월 : 인천대학교 동북아물류 대학원(물류학박사)
ㆍ1998년 3월 ∼ 현재 : 세한대학교 항 공교통물류학과 교수
ㆍ관심분야 : 신경회로망, 항공운송, System Dynamics ㆍE-Mail : [email protected]