명상음악의 효과검증을 위한 뇌파특성 분석
조준모*
Analysis of EEG Characteristics for the Effectiveness Verification of Meditation Music
Jun-Mo Jo* 요 약
최근에 웰빙의 열풍을 타고 명상에 대한 관심이 날로 커지고 있다. 다양한 명상방법들이 소개되고 있으나 사람에 따라 알맞은 방법으로 명상을 할 필요가 있다. 특히, 명상음악을 이용하여 명상을 즐기는 사람들이 늘 고 있으며 어떤 사람은 그것이 도움이 된다고 하고 그렇지 않다고 하는 사람들도 있다. 따라서, 이러한 명상 음악이 명상에 과연 얼마나 도움이 되는지를 본 논문에서 연구하게 되었다. 뇌의 좌우반구의 전전두엽 영역 에 배치된 14개의 채널을 가진 EEG 장치를 이용하여 명상음악을 사용할 때와 그렇지 않을 때 어느 방법이 더욱 효과적인 명상을 할 수 있는지를 비교 실험하였다. 그 결과 2개의 실험에 큰 차이를 볼 수 있었다.
ABSTRACT
Recently, the meditation is getting a major concern because of the trend of wellbeing. The various meditation methods are introduced, but, we need to take an appropriate method for himself or herself. Especially, the numbers of meditators who are using meditation music while they are meditating are increasing. Some people say it is helpful, but others don’t. Therefore, I have studied the impact of the meditation music in this paper. I have compared between the meditation with the music and without the music by measuring the channels of left and right hemisphere of prefrontal lobe with 14-channel EEG device. For the result, I have found that there are great difference between two experiments.
키워드
Brainwave(EEG), Alpha Wave, Theta Wave, Meditation, Meditation Music, Frequency Band 뇌파(EEG), 알파파, 세타파, 명상, 명상음악, 주파수대역
* 교신저자(corresponding author) : 동명대학교 정자공학과([email protected])
접수일자 : 2014. 08. 15 심사(수정)일자 : 2014. 09. 25 게재확정일자 : 2014. 10. 17
Ⅰ. Introduction
The meditation is getting a major concern these days because of the trend of wellbeing and there are some researches on meditation using EEG as elabo- rated as follows. Some researches are using multiple EEG channels detecting advanced meditators brain- waves. During volitionally self-initiated, altered states
of consciousness that were associated with different subjective meditation states and different brain neu- ronal populations were active. The brain areas predominantly involved during the self-induced medi- tation states aiming at visualization on right posterior[1]. The locations of electrodes are mainly prefrontal lobe of both left and right hemisphere.
Another research is related to the Transcendental
Meditation(TM). This random assignment study compared coherence, amplitude, and eLORETA patterns during practice of the TM and the TM-Sidhi programs. The TM technique involves systematic transcending of contents of experience to a state of pure consciousness[2].
There are many researches related on the concentration. They are known that the particular brainwaves are induced when a human concentrates. To analyze the brain waves related to human concentration using visual stimulus is to induce the concentration. The visual stimulus tasks were presented to subjects for concentration. The method is to measure EEG signals with several channels and analyze the signals into several frequency bands[3]. The concentration is mostly related to the Theta, SMR and mid-Beta waves.
There is an interesting research by measuring and analyzing the brainwaves to observe the characteristics of human drowsiness. The basic method is to analyze the EEG signals from subjects according to the frequency band and the Alpha wave[4].
In II, the basic concepts are related to the measuring meditation EEG signals. Then, in III, the environments and specifications of the experiments will be discussed. In IV, the result of experiments and analysis will be elaborated. Finally, there will be the conclusion about the impact of the meditation music on deep meditation.
Ⅱ. Measuring Meditation EEG Signals
2.1 Measuring EEG Signal
The brain system produces electrical signals at a variety of frequencies. Early EEG researchers were limited in their ability to record EEG signals by AC current artifacts and the inability to filter out 60Hz noise precisely. Thus, the EEG was recorded by using simple 'band pass' filters that allowed
relatively clean signal detection only below 30Hz and with ignoring signals above that frequency.
The EEG is classically composed of four frequency bands: Delta(0-3Hz), Theta(4-7Hz), Alpha(8-12Hz), and Beta(13-24Hz). The EEG is classically described as occurring between 0 and 30Hz, recent work and precise notch digital filtering has defined a gamma frequency greater than 24Hz extending to 50-60Hz[5-7].
For analysis, this study used Discrete Fourier Transform to observe the signals in the frequency domain and Pearson Product-Moment Correlation Coefficient to quantify the correlation between the signals. To obtain EEG signals, the Discrete Fourier transform is used because they reveal periodicity in input data as well as the relative strengths of any periodic components. The discrete Fourier transform of areal sequence of numbers will be a sequence of complex numbers of the same length. The equation (1) is shown below[8].
(1)
Some researchers have studied on a conce- ntration state. The Concentration Index(CI), a state on concentration, can be calculated with power spectrum of EEG. The concentration factors Theta, SMR and mid Beta waves represent as P(ɵ), P(SMR) and P(mid ϐ) respectively. The equation is shown as the equation (2)[9].
(2)
2.2 Meditation EEG Signals
The overall rhythmic waves of brain is dramatically changing while meditator meditates. In usual daytime activity of human brain generates Beta waves(13~30Hz). When the meditators medi- tate, the rhythmic waves go down to the Alpha
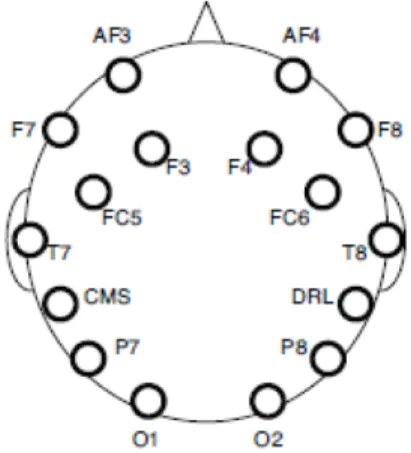
waves(8~13Hz) and stay in relaxation or calm state. The experienced meditators can go further to the state of Theta waves(4~7Hz) which is deep state of meditation. There are some locations where the electrodes are placed in the surface of head as shown in Fig. 1. AF3, and AF4 are the prefrontal lobe of left and right hemisphere respectively.
These two signals of the location will be used for this experiment in this paper since the prefrontal lobe is very sensitive to the meditation.
Fig. 1 Electrode location for EEG signal
Ⅲ. Meditation Experiments
There will be two types of meditation experiments.
One is a With_Music_Meditation, and the other is a Non_Music_Meditation. The With_Music_Meditation is a meditation with meditation music, while the Non_Music_Meditation is a meditation without a music meditation experiment. For these experiments 3 experienced meditators are participated and they have 3, 4, 12 years of meditation experiences. For these experiments, the meditators have used ‘Emotiv EPOC’ device with 14 channels of electrodes. The EEG signals measured by electrodes are shown in Fig. 2. For the main channels using in these experiments, the two channels of frequencies will be used; one is AF3 and AF4 shown at the first line
and the last line in Fig. 4. Likewise, other EEG data is geographically symmetric in the picture. The ‘P’
stands for ‘Parietal lobe’, the ‘O’ stands for ‘Occipital lobe’ and so on.
Fig. 2 14 Frequencies of channels
IV. Experiment Results and Analysis
4.1 Without Music Meditation
The result of the ‘Non_Music_Meditation’ will be discussed with the result of experiment. Especially, the rhythmic waves of prefrontal lobe will be analyzed.
4.1.1 Beginning of Meditation
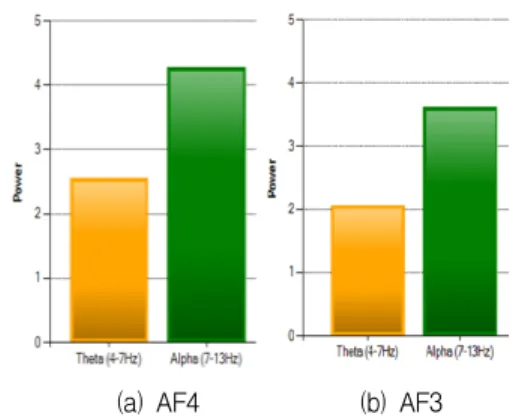
The Fig. 3 shows the beginning period of the experiment. The (a) AF4 is a Theta and Alpha wave of right hemisphere, and the (b) AF3 is a Theta and Alpha wave of left hemisphere.
This figure shows that the right hemisphere is little bit more active than the left one, which means there are no big differences between them.
However, the important part in here is the Alpha rhythm is more active than the Theta wave.
Although the Beta wave does not show in this figure, the wave is high at this moment since the experimenter just started to meditate.
(a) AF4 (b) AF3 Fig. 3 Non_Music_Meditation waves(start)
4.1.2 Middle of Meditation
The Fig. 4 shows the mid(5 minutes of meditation) period of the experiment. The AF4 is little bit more active than the AF3, but it doesn’t seem to be a meaningful result. The important factor here is the Theta wave is much higher than the beginning of the meditation. That means the meditator started to be in the state of deep meditation.
(a) AF4 (b) AF3 Fig. 4 Non_Music_Meditation waves(mid)
4.1.3 End of Meditation
The Fig. 5 shows the end(10 minutes of meditation) period of the experiment. The Theta wave finally dominates over the Alpha wave. That means the meditator is in deep state of deep meditation. The most interesting part in here is the right hemisphere is much more active than the other part.
(a) AF4 (b) AF3 Fig. 5 Non_Music_Meditation waves(end)
4.2 With Music Meditation
The result of the ‘With_Music_Meditation’ will be discussed in this section. Same as the section 4.1, the rhythmic waves of right and left prefrontal lobe will be analyzed.
4.2.1 Beginning of meditation
The Fig. 6 shows the beginning period of the experiment. The phenomenon that the power of AF4 is greater than the AF3 is the same as the No_Music_Meditation experiment’s. The Alpha rhythm is also greater than the Theta wave.
Therefore, there is not much difference between the two experiments.
Fig. 6 With_Music_Meditation waves(start)
4.2.2 Middle of meditation
The Fig. 7 shows the mid(5 minutes of medi- tation) period of the experiment. The power of Theta and Alpha is in the high level at the same time especially in AF4. So to speak, as the Theta
wave goes up to the high level the Alpha wave does not go down as it supposed to be. This is somewhat different from the experiment result of the Non_Music_Meditation.
Somehow the meditation music stimulates the tension of the meditator even though it’s calm music. The strong signals at both Theta and Alpha at the same time don’t help for getting at the deep meditation state.
(a) AF4 (b) AF3 Fig. 7 With_Music_Meditation waves(mid)
4.2.3 End of Meditation
The Fig. 8 shows the end(10 minutes of meditation) period of the experiment. Even at the end of the experiment, the Alpha wave does not go down. In other words, the meditators are hard to be in the deep meditation state no matter how long they meditate. The deep meditation state should be in high level of Theta and low level of Alpha wave.
(a) AF4 (b) AF3 Fig. 8 With_Music_Meditation waves(end)
V. Conclusion
People are interested in the meditation for their health on these days. I have compared the two experiment for founding out the better method between the meditation with music and the without music. Through this experiment, some interesting results have been found. At first, the meditators had no trouble reaching at the right rhythmic waves through the Non_Music_Meditation expe- riment. The Alpha wave is getting stronger from the Beta wave at the beginning of the meditation.
Then in the mid part, the strong Alpha wave gradually reduced and the Theta wave increased.
Finally, the Theta wave dominates over the Alpha wave. However, in the With_Music_Meditation experiment, not only the Theta wave grew enough to the high level of power but also the Alpha wave went down at all.
Therefore, the meditation music could help the meditator to the calm or relaxed state with Alpha wave, but not to the deep meditation state. So as the conclusion, the meditation with music could help the novice of meditation to the calm and relaxation state. And the meditation music is not suggested for the experienced meditators.
Secondly, the meditation activates prefrontal lobe of the right hemisphere not the left one in the deep meditation state of the meditator.
For the further study, influence of meditation for concentration will be studied with the frequency related to the SMR wave(12~15Hz).
References
[1] D. Lehmanna, P. L. Fabera, P. Achermannb, D.
Jeanmonodc, L. R. R. Gianottia, and D. Pizza- gallid, “Brain sources of EEG gamma frequency during volitionally meditation-induced, altered states of consciousness, and experience of the
self,” Neuroimaging, Elsevier, Sec. 108, 2001, pp.
111-121.
[2] F. Travis, “Comparison of coherence, amp- litude, and eLORETA patterns during Tran- scendental Meditation and TM-Sidhi practice,”
Int. J. of Psychophysiology, Elsevier, 81, 2011, pp.
198-202.
[3] Y.-S. Jang and D.-W. Han, “Analysis of EEG Generated from Concentration by Visual Stimulus Task,” J. of the Korea Institute of Electronic Communication Sciences, vol. 9, no. 5, 2014, pp. 589-594.
[4] Y.-S. Jang, S.-L. Lee, and S.-A. Ryu,
“Characteristics of Frequency Band on EEG Signal Causing Human Drowsiness,” J. of the Korea Institute of Electronic Communication Sciences, vol. 8, no. 6, 2013, pp. 949-954.
[5] J. W. Sleigh, D. A. Steyn, M. L. Steyn, M. L.
Williams, and P. Smith, “Comparison of changes in electroencephalographic measures during induction of general anaesthesia: influ- ence of the gamma frequency band and electromyogram signal,” Br. J. Anaesth, vol. 86, no. 1, 2001, pp. 50-58.
[6] H. F. Unterrainer, M. J. Chen, and J. H.
Gruzelier, “EEG-neurofeedback and psycho- dynamic psychotherapy in a case of adolescent anhedonia with substance misuse,” Int. J. of Psychophysiology, Elsevier, vol. 93, no. 1, 2014, pp. 84-95.
[7] J. H. Gruzelier, “EEG-neurofeedback for opti- mising performance,” Neuroscience and Biobe- havioral Reviews, Elsevier, vol. 44, 2014, pp.
124-141.
[8] C. E. Reyes, J. L. C. Rugayan, C. Jason, G.
Rullan, C. M. Oppus, and G. L. Tangonan, “A Study on Ocular and Facial Muscle Artifacts in EEG Signals for BCI Applications,” Tencon, IEEE Conf., Cebu, Philippines, Nov. 2012, pp.
1-6.
[9] Y.-S. Jang, G.-C. Park, and D.-W. Han,
“Comparison of EEG Characteristics between Dementia Patient and Normal Person Using Frequency Analysis Method,” J. of the Korea Institute of Electronic Communication Sciences, vol.
9, no.5, 2014, pp. 595-600.
저자 소개
조준모(Jun-Mo Jo)
1991년 아이오아주립대학교 컴퓨 터과학과 졸업(공학사)
1995년 경북대학교 대학원 컴퓨터 공학과 졸업(공학석사)
2004년 경북대학교 대학원 컴퓨터공학과 졸업(공학 박사)
1998년~현재 동명대학교 전자공학과 교수
※ 관심분야 : 이동통신, 뇌파통신, 뇌과학