• 검색 결과가 없습니다.

Hydrothermal Synthesis of Fe Based MOFs with Energy Economy Approach

N/A
N/A
Protected

Academic year: 2021

Share "Hydrothermal Synthesis of Fe Based MOFs with Energy Economy Approach"

Copied!
4
0
0

로드 중.... (전체 텍스트 보기)

전체 글

(1)

1. Introduction

Porous metal-organic frameworks (MOFs) are con- sidered to be an important class of advanced func- tional materials due to their unique coordination struc- tures, variant configuration and potential applications [1-3]. The features of MOFs such as exceptionally high porosities, with regular pores and extremely high surface areas, well-defined crystalline structures, and more accessible bulk volume are hallmark which have attracted the attention of both academia and indus- try[4]. The crystalline iron (III) trimesate (MIL-100 (Fe)) has three dimensional cubic structure with two

types of mesoporous cages (25-29Ȧ) accessible throu- gh micro-porous windows (5-9Ȧ). MIL-100(Fe) is al- so known as a cheap and biocompatible material. Con- sidering its physicochemical properties and non-tox- icity, MIL-100(Fe) can be a good candidate as a new adsorbent and catalyst.

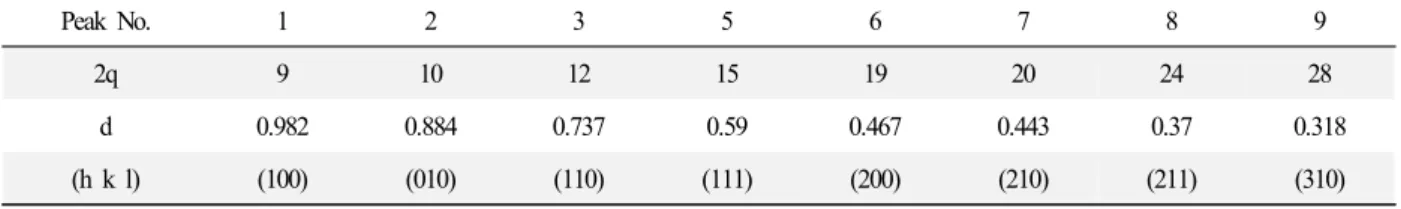
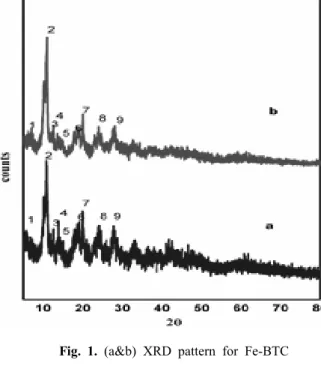
Here we have adopted a hydrothermal synthesis approach for Fe-BTC powder. We conducted syn- thesis process at 130˚C for 8 hours and were able to obtain noticeable MOF yield. Another unique feature of this study was the application of detailed dif- fraction indexing for diffraction patterns of as pre- pared and heat treated (200˚C) MOF powders. This application not only validated the crystalline nature of powders but also gave an insight for any possible susceptibility of material to oxidize at higher tem- perature.

To whom corresponding should be addressed.

Department of Nuclear and Energy Engineering, Jeju National University

Tel : 064-754-3646 E-mail: [email protected]

Hydrothermal Synthesis of Fe Based MOFs with Energy Economy Approach

Farrukh Israr*, Duk Kyung Kim**, Yeongmin Kim*, Seung Jin Oh***, Kim Choon Ng***, Wongee Chun*

*Department of Nuclear and Energy Engineering, Jeju National University, Jeju 690-756, Korea

**Department of Chemistry, Auburn University Montgomery, Montgomery, AL36117, USA

***Mechanical Engineering Department, National University of Singapore, 9 Engineering drive 1, 117576, Singapore

(Received 24 April 2015, Revised 8 June 2015, Accepted 11 June 2015) Abstract

The mesoporous metal organic framework structure Fe-BTC was successfully synthesized by hydro- thermal process with noticeable yield. The synthesis operation was conducted at intermediate temperature and for shortened operation time as compared to conventional procedures. This process approach with reduced operating temperature and shortened operation time may open an opportunity window towards process economy with reduction in energy consumption. A simple mathematical approach of diffraction indexing using X-ray diffraction patterns of synthesized powder was employed to confirm its crystalline nature and to investigate its high temperature stability. The crystallite size was calculated by using Debye-Scherrer equation.

Key words : Mesoporous; Metal organic frameworks; hydrothermal process; diffraction indexing; Debye- Scherrer.

에너지공학, 제24권 제2호(2015)

Journal of Energy Engineering, Vol. 24, No. 2, pp.55~58(2015)

http://dx.doi.org/10.5855/ENERGY.2015.24.2.055

(2)

Farrukh Israr, Duk Kyung Kim, Yeongmin Kim, Seung Jin Oh, Kim Choon Ng, Wongee Chun

에너지공학 제24권 제2호 2015 56

2. Materials and method

The chemicals including iron chloride hexahydrate (FeCl

3

.6H

2

O) and trimesic acid (C

6

H

3

(COOH)

3

) were purchased from sigma Aldrich and used without fur- ther purification. A mixture of FeCl

3

.6H

2

O (2.43g) with C

6

H

3

(COOH)

3

(0.83g) was dissolved in 30ml de-ionizedwater, stirred for 30 minutes, then loaded in Teflon liner and heated at 130˚C in autoclave for 8 hours. After hydrothermal treatment, mixture was cooled down to room temperature. The recovered or- ange slurry for Fe-BTC was then centrifuged at 3500 rpm. A 30-45 minutes centrifuging was enough to separate out the clear solution from powder product residue. The powder was then washed with de-ion- ized water. After drying at room temperature, an or- ange Fe-BTC product was obtained.

3. Characterization

The crystallinity and phase purity of synthesized MOF was analyzed using X-ray diffractometer (Rika- gu D/MAX 2200H, Bede model 200). The X-ray diffraction (XRD) measurement was performed using a Cu-K

α

radiation source of wavelength λ=1.5406Ȧ and the diffraction intensity were recorded in 2θ range of 5-80˚ with a step of 0.02˚. The particle size of synthesized powder was calculated by using the Debye-Scherrer (DS) equation (1), as shown below:

(1)

Where "D" is crystallite size, "λ" is the radiation wavelength (1.5406 Ȧ), "β" is the full width half maximum (FWHM) for diffraction peak, "θ" is the

diffraction angle. "k" is the shape factor and an ave- rage value for "k" was assumed as 0.9. The FT-IR spectrum was collected on a BRUKER IFS66/S Fou- rier transform IR spectrophotometer in KBr disk at room temperature. The scanning electron microscopy (SEM) observation was done on JEOL, JEM1200EX II set up equipped with field emission gun. The measurement of N

2

adsorption was performed on a Quanta chrome AUTOSORB-1-MP apparatus at − 196°C, and the specific surface area of the inves- tigated samples was calculated using the multiple- point Brunauer-Emmett-Teller (BET) method. The samples was out gassed under vacuum at 150°C for 12 h, prior to the adsorption measurements.

4. Results and Discussion

The XRD pattern of Fe-BTC powder in as pre- pared and heat treated (at 200˚C) forms (Fig. 1(a)&

(b)) in major portion, matched with the simulated one in literature [5],[6]which confirmed that Fe-BTC has been successfully synthesized. The relative peaks at 2θ Bragg reflection values of 9˚, 10˚, 12˚, 15˚, 19˚, 20˚, 24˚ and 28˚ were obtained. The Bragg’s equation (2) gives relationship between various diffraction lines and inter planer distance.

(2)

A developed mathematical expression (3)[7] has been employed for detailed indexing of diffraction pattern (Table 1). Here (h k l) values defined the la- ttice planes corresponding to diffraction peaks and

"a" is lattice parameter.

= (h

2

+k

2

+l

2

)/4a

2

(3)

Peak No. 1 2 3 5 6 7 8 9

2q 9 10 12 15 19 20 24 28

d 0.982 0.884 0.737 0.59 0.467 0.443 0.37 0.318

(h k l) (100) (010) (110) (111) (200) (210) (211) (310)

Table 1. Indexing of Diffraction pattern for Fe-BTC

(3)

Hydrothermal Synthesis of Fe Based MOFs with Energy Economy Approach

Journal of Energy Engineering, Vol. 24, No. 2 (2015) 57

The value of "a" for Fe-BTC calculated from equation (3) was 19.6Ȧ. The relative positioning of peaks and corresponding (h k l) values confirmed the cubic nature of the synthesized Fe-BTC powder.

There appeared to be no difference in structure of powder after heating it at 200˚C as the diffraction peaks are always at the same positions that sug- gested its compactness at higher temperature. The FT-IR spectrum (Fig. 2) indicated C=O vibration band at 1710-1720 cm

-1

[8]. The absorption bands in the range of 1400-1600cm

-1

and 600-780cm

-1

owed to C-H bond stretching. The wide band in the range of 3300-3600 cm

-1

suggested the presence of water molecules owed to O-H stretching.

The adsorption isotherm for Fe-BTC exhibited the hysteresis loop similar like type I isotherm[9-11]

(Fig. 3), typical for adsorbent of 1.5-100nm. The ad- sorption curve showed an initial increase (55%) in uptake at exposure of material to N

2

gas molecules.

This uptake then became steady with increase in rel- ative adsorption pressure as the pores are filled with monolayer and thereafter point of inflection occurred near the completion of first monolayer. The BET surface area assessed from N

2

adsorption at -196˚C was 885cm

2

/g. The discrepancy may be due to the relative pressure range difference (P/P

0

) under which the measurements have been made. The product yield was around 48% based on stoichiometric cal-

Fig. 3. Adsorption isotherm for Fe-BTC

Fig. 4. Micro structure of Fe-BTC Fig. 2. FT-IR for Fe-BTC

Fig. 1. (a&b) XRD pattern for Fe-BTC

(4)

Farrukh Israr, Duk Kyung Kim, Yeongmin Kim, Seung Jin Oh, Kim Choon Ng, Wongee Chun

에너지공학 제24권 제2호 2015 58

culations. The size of crystal as calculated by using XRD pattern and equation (1) was 39nm.

5. Conclusion

In this work, an intermediate process temperature (130˚C instead of 170-180˚C) and reduced reaction time (8 Hours instead of 12 Hours or more) has been used. This way conventional process parame- ters has been maneuvered. We were able to accom- plish the synthesis successfully under these new set conditions with recognizable product yield. In a nut- shell, this synthesis process at intermediate temper- ature and reduced operation time seemed to be cost effective and less energy consuming. Here we have also investigated the high temperature stability of these MOFs by examining XRDs patterns of their heat treated samples. Fe-BTC product from the cur- rent work has shown compatibility and high temper- ature stability as there appeared to be no change in its diffraction pattern before and after heat treatment.

6. Acknowledgement

This work was supported by the National Resear- ch Foundation of Korea (NRF) grant funded by the Ministry of Science, ICT & Future Planning (No.

2014R1A2A1A01006421).

References

1. G. Férey, Chem. Soc. Rev., 2008, 37, 191 2. T. Uemura; N. Yanai; S. Kitagawa, Chem. Soc.

Rev., 2009, 38, 1228

3. D.J. Tranchemontagne; J.L. Mendoza-Cortés; M.

O’Keeffe; O.M. Yaghi, Chem. Soc. Rev., 2009, 38, 1257

4. A.U. Czaja; N. Trukhan; U. Müller, Chem. Soc.

Rev., 2009, 38, 1284

5. J.W. Yoon; Y.K. Seo; Y.K. Hwang; J.S. Chang;

H. Leclerc; S. Wuttke; P. Bazin; A. Vimont; M.

Daturi; E. Bloch; P.L. Llewellyn; C. Serre; P.

Horcajada; J.M. Grenèche; A.E. Rodrigues; G.

Férey, Angew. Chemie - Int. Ed., 2010, 49, 5949 6. P. Horcajada; S. Surblé; C. Serre; D.-Y. Hong;

Y.-K. Seo; J.-S. Chang; J.-M. Grenèche; I. Mar- giolaki; G. Férey, Chem. Commun. (Camb), 2007, 2820

7. B.D. Cullity, Am. J. Phys., 1957, 25, 394 8. Y.K. Seo; J.W. Yoon; J.S. Lee; U.H. Lee; Y.K.

Hwang; C.H. Jun; P. Horcajada; C. Serre; J.S.

Chang, Microporous Mesoporous Mater., 2012, 157, 137

9. P. O. M., Thermodynamics in Physical Chemistry (in Russian)., 1991

10. S.K.S.W. et al, Pure Appl. Chem., 1985, 57, 603

11. A. P. Karnaukhov, Adsorption: Texture of Dis- persed and Porous Materials (in Russian), 1999 12. F. Zhang; J. Shi; Y. Jin; Y. Fu; Y. Zhong; W.

Zhu, Chem. Eng. J., 2015, 159, 183

13. I. Ahmed; J. Jeon; N.A. Khan; S.H. Jhung,

Cryst. Growth Des., 2012, 12, 5878

수치

Table  1.  Indexing  of  Diffraction  pattern  for  Fe-BTC
Fig.  4.  Micro  structure  of  Fe-BTCFig.  2.  FT-IR  for  Fe-BTC

참조

관련 문서

Fig.. X-ray diffraction patterns for GTD-111 alloys after cyclic hot corrosion.. 염 도포 방법에 따른 부식속도는 SI D,SISDD순이다.염 도포량이 많을수록

XAFS: X-ray absorption fine structure XES: X-ray emission spectroscopy XRF: X-ray fluorescence.. Use of x-rays; a probe based

Electron probe micro-analyzer image of Zr-4%Si binary alloys; (a).. X-ray diffraction profiles of as-cast Zr-xSi binary alloys, which shows the dual phases.. Magnetic

Reciprocal Lattice.. Kittel, Introduction to Solid State Physics.. Hammond, The Basics of Crystallography and Diffraction.. Reciprocal Lattice Direction vs. Sherwood,

 The inverse pole figure gives the probability of finding a given specimen direction parallel to crystal (unit cell) directions.  By collecting data for several reflections

1 John Owen, Justification by Faith Alone, in The Works of John Owen, ed. John Bolt, trans. Scott Clark, "Do This and Live: Christ's Active Obedience as the

The stability of traveling wave solutions for evolution equations of order higher than two had been dealt with by using an extended variational approach which was matched to

Phase profile of conventional DOE Obtained diffraction image. Optical vortices appear in the diffraction image generated by