Printed in the Republic of Korea https://doi.org/10.5012/jkcs.2021.65.2.125
Electrochromic Performance of NiO
xThin Film on Flexible PET/ITO Prepared by Nanocrystallite-Dispersion Sol
Jun Young Kwak†,‡, Young Hee Jung†,‡, Juyun Park†, Yong-Chul Kang†, and Yeong Il Kim†,*
†Department of Chemistry, Pukyong National University, Busan 48513, Korea. E-mail: [email protected]
‡Research Laboratory, Adchro Inc. Busan 48547, Korea.
(Received January 13 2021; Accepted January 25 2021)
ABSTRACT. An electrochromic nickel oxide thin film was fabricated on a flexible PET/ITO substrate using a nanocrystal- lite- dispersed coating sol and bar coater. Nanocrystalline NiOx of 3-4 nm crystallite size was first synthesized by base precipi- tation and thermal conversion. This NiOx nanocrystallite powder was mechanically dispersed in an alcoholic solvent mixed with a silane binder to prepare a coating sol for thin film. This sol method is different from the normal sol-gel method in that it does not require the conversion of precursor by heat treatment. Therefore, this method provides a very facile method to pre- pare NiOx thin films on any kind of substrate and it can be easily applied to mass production. The electrochromic performance of this NiOx thin film on PET/ITO electrode with a thickness of about 400 nm was investigated in a nonaqueous LiClO4 elec- trolyte solution by cyclic voltammetric and repeated chronoamperometric measurements in conjunction with spectrophotome- try. The visible light modulation of 44% and the colorization efficiency of 41 cm2/C at 550 nm were obtained at the step potentials of -0.8/+1.2 V vs Ag and a duration of 30 s.
Key words: Nonstoichimetric nickel oxide, Electrochromic, Nanocrystallite-dispersion sol
INTRODUCTION
Nickel oxide thin film has been widely investigated for electrochromic applications.1 It is commonly used as anod- ically colored counter electrode with tungsten oxide elec- trode which is cathodically colored.2 The electrochromism of its thin film has generally been demonstrated with high color contrast and colorization efficiency in an alkaline aqueous solution. The electrochromic mechanism of nickel oxide in alkaline aqueous solution is somewhat contro- versial,3 but what is generally accepted is that NiO is initially converted to colorless Ni(OH)2 and then Ni(OH)2 is revers- ibly oxidized to black NiOOH.4 Strictly speaking, the elec- trochromism in alkaline aqueous solution is a characteristics of nickel hydroxide, not nickel oxide. In addition, the alka- line aqueous electrolyte solutions are not particularly use- ful for practical smart window devices because of the lack of long-term stability due to the aqueous-solubility of Ni(OH)2. The electrochromic performance of NiO thin films in non- aqueous electrolyte solution is generally not as good as in alkaline aqueous solution. This is because the cation inser- tion into the lattice of NiO is involved in the redox mech- anism differently from that in the aqueous solution.5
Thin films of NiO have been prepared by many methods such as RF-sputtering,6 chemical vapor deposition,7 elec- trochemical deposition,8 pulsed laser deposition,9 spray
pyrolysis,10 chemical bath deposition11 and sol-gel meth- ods.12 However, most of these methods are not suitable for large scale production except the sol-gel method. Even the sol-gel method typically requires the thermal conversion of the precursor on substrate above 300oC after sol coating.
Therefore, flexible polymer substrates such as polyethylene terephthalate (PET) cannot be used for the thin film prepa- ration on the substrate in most sol-gel methods because such a substrate is not usually stable above 150oC. In order to implement a practical smart window, it is essential to establish an appropriate mass production method of an electrochromic thin film device with low cost.
Herein we report a very facile method for preparing NiOx thin film on any kinds of flat substrates as well as flexible polymer substrates that can be easily applied to roll-to-roll mass production. In this method nanocrystalline NiOx with a crystallite size of 3-4 nm is mechanically dispersed in an alcoholic solvent with a silane compound as binder to pre- pare a thin film coating sol. Since the synthesized nickel oxide is nonstoichiometric, we denote nickel oxide as NiOx instead of NiO. This sol differs from the sol of the general sol-gel method in that it does not require the precursor conversion by heat treatment after deposition. This nano- crystallite-dispersed sol method provided a highly repro- ducible and robust NiOx thin film on ITO/PET substrates without post high-temperature heat treatment. We inves-
>99.0%) was obtained from Junsei Chemical. ITO/PET substrate with 30Ω/sq sheet resistance was obtained from Han-Sung Tech Co. Nanocrystalline Ni(OH)2 was prepared by a base precipitation method using NiSO4 and NH3 aqueous solution as precursor and base, respectively.13,14 250 mL of 0.4 M NiSO4 and 50 mL of ca. 6 M NH3 solution were mixed slowly and vigorously stirred at 60oC for an hour. The light green precipitate was filtered and washed three times with a copious amount of water. The resulting precipitate was dried at 100oC for 3 hours. The black NiOx powder was obtained by the calcination of the prepared Ni(OH)2 at 400oC in air.
NiOx-dispersed coating sol was prepared as following: 0.3 g of NiOx was dispersed in 10 mL of ethanol and ball-milled with 0.5 mm zirconia bead for 3 days. TEOS was added to the ball-milled suspension and the suspension was ball- milled further for 1 days. The resulting coating sol was cast on ITO/PET using an auto film applicator equipped with
# 8 Meyer bar in the rate of 20 mm/s. The film was dried at room temperature in air and annealed at 100oC in oven for 10 min. The thickness of the films that was measured by the profilometer was roughly 400 nm.
Characterization
Powder X-ray diffraction (XRD) patterns were collected by Phillips X’Pert MPD diffractometer using CuKα radiation source at a scan rate of 0.02o s-1. Field emission electron microscopy (FE-SEM, Jeol JEM-6700F) was used to get the morphologies of the prepared Ni(OH)2 and NiOx powders and NiOx film. X-ray photoelectron spectroscopic (XPS) data were collected with ESCALab MKII spectrometer.
XPS spectra were obtained using an Al Kα X-ray source (1486.6 eV) and a channeltron with an acceleration volt- age of 2850 V. Survey XPS spectra were obtained by con- stant analyzer energy mode with a pass energy of 50 eV and a step size of 0.5 eV. High resolution XPS spectra were collected by a pass energy of 20 eV, scan step of 0.05 eV.
The deconvolution process was performed with an XPSPEAK4.1 program. The background was chosen in
RESULTS AND DISCUSSION
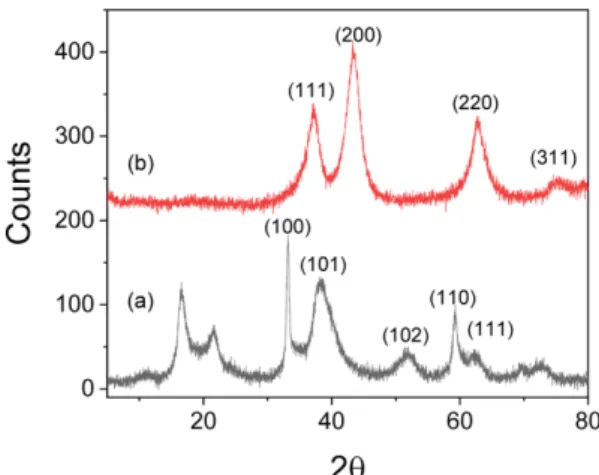
NiO nanoparticles are usually synthesized by the thermal conversion of Ni(OH)2 and NiOOH. Therefore the crystal phase, crystallite size and morphology of the precursor particles, Ni(OH)2 and NiOOH strongly affect the phys- ical and chemical properties of the final product, NiO. We have prepared nanocrystalline Ni(OH)2 as precursor of NiO by chemical precipitation method at an elevated tem- perature using weak base ammonia. Ni(OH)2 is known to have two pseudopolymorphs of α- and β-phase. The crystal structure and morphology of Ni(OH)2 synthesized by chem- ical precipitation method strongly depend upon the tempera- ture, pH and the type of Ni precursor salt.15 The precipitation method, herein used with ammonia base instead of strong base, could give the delicate phase control between α- and β-phases of Ni(OH)2 depending both on the temperature and the amount of base.16 The XRD pattern of the synthesized Ni(OH)2 in our experimental condition was shown in Fig. 1(a).
The pattern indicates most of β-phase structure as assigned in the figure except two low angle peaks.17 The unassigned
Figure 1. XRD patterns of the synthesized (a) Ni(OH)2 and (b) NiOx powders.
peaks at low angles seem to be ascribed to the phase which is neither α nor β phase but contains some structural ingre- dients of both by an interstratification.18 The peaks con- verges to single peak of (001) of β-phase from more widely separated peaks as the precipitation condition changes.16 As Kamath et al. mentioned,18 the crystal phase of the syn- thesized Ni(OH)2 seems to be in the middle of α→β trans- formation by interstratification. Fig. 2(a) shows FE-SEM image of the synthesized Ni(OH)2 powder. The morphol- ogy is more like pieces of thin sheet or flower leaf rather than particulate. This nickel hydroxide was annealed at 400oC in air. It was converted to nickel oxide with a typical cubic crystal structure. Fig. 1(b) shows the XRD pattern of the synthesized nickel oxide with the reflection planes assigned to cubic crystal structure.19 The peaks correspond to the typical cubic NiO pattern and the unit cell parameter a was estimated as 4.20 Å from Nelson-Riley extrapolation.
That was slightly larger than the known value, 4.17 Å. The crystallite size was also estimated to 3.6 nm from (200) peak using Sherrer equation.20 The morphology of the nickel oxide exactly followed that of the precursor hydroxide without any change as shown in Fig. 2(b).
The synthesized NiO seemed to be non-stoichiometric as expected from the dark black color of the powder. We have measured XPS data in order to check the oxidation state of Ni in this nickel oxide. Fig. 3 shows the high res- olution XPS spectrum of Ni2p. The spectrum shows 2p2/3 and 2p1/2 peaks of Ni at 855 eV and 872 eV, respectively with satellite peaks. These peaks were deconvoluted into two peaks Ni2+ (854.1 and 871.5 eV) and Ni3+ (856.2 and 873.7 eV) as shown in the colored lines in the figure. The percentage of Ni3+ was about 40% in the total Ni species from the relative ratio of the deconvoluted peaks. Since XPS data shows only the surface property, the bulk com- position of Ni3+ will be lower than this value. These Ni3+
species are thought to be due to the nickel cation vacancy and/or interstitial oxygen and mainly located in the grain boundaries of oxygen-rich NiO21 since there is no indication of the existence of Ni2O3 phase in the pattern of XRD.
Therefore, we denoted the synthesized nickel oxide as nonstoichiometric NiOx.
The NiOx film on PET/ITO substrate was prepared by bar-coating method using the nanocrystallite-dispersion sol.
The synthesized NiOx was dispersed in ethanol by mechan- ical ball-milling to prepare a coating sol for its thin film.
Fig. 4(a) shows the TEM image of the dispersed NiOx nanoparticles in ethanol after ball-milling. Although the dispersed individual particles are not clearly shown, the sizes of individual particle are less than 10 nm. One of the important features of the electrochromic thin film is optical transparency, i.e. haze. The haze of the prepared thin film could be controlled at the level of less than 5% with our dispersed sol. The morphology of NiOx thin film on PET/
Figure 2. FE-SEM pictures of the synthesized (a) Ni(OH)2 and (b) NiOx powders.
Figure 3. The high resolution XPS spectrum of Ni2p in the syn- thesized nickel oxide.
ITO is shown in Fig. 4(b). The surface morphology of the NiOx thin film with a thickness of about 400 nm is some- how porous on a scale smaller than a submicrometer but very uniformly smooth on a scale larger than a microm- eter.
The redox properties of this NiOx thin film on PET/ITO was first studied by cyclic voltammetry (CV) in a nonaqueous LiClO4 electrolyte solution. Fig. 5 shows the cyclic vol- tammograms of NiOx film on PET/ITO and bare PET/ITO in 0.1 M LiClO4 PC solution at a scan rate of 25 mV/s for 10 cycles. In this nonaqueous electrolyte solution the redox process of NiOx can be considered Li+ ion intercalation- deintercalation process to be involved according to the fol- lowing reactions.5
NiOx + yLi+ + ye-→ LiyNiOx (1) LiyNiOx ↔ Liy-zNiOx + zLi+ + ze- (2)
The second reversible redox process which gives the electrochromic color change will depends on the first reduc- tion process of the oxidized Ni3+ because the amount of the accompanied Li+ intercalation will determine the sub- sequent reversible process. In the voltammogram as shown in Fig. 5 the current starts with a large cathodic current that corresponds to the reduction of Ni3+ and Li+-interca- lation and the reversible distinct redox peaks are shown from the first cycle with the background current that cor- responds to a typical charging current of a semiconductor electrode. According to the earlier studies of Passerini et al. for NiOx thin film prepared by sputtering,5 the initial activation process was needed to get the second reversible redox process. The activation to give a widening of host structure for Li+ could be done by cycling 20 times in cyclic voltammetry or a low-rate galvanostatic polarization. In our case there is no need for that kind of cycling for acti- vation as shown in the cyclic voltammogram. The result can be attributed to the high porosity of the film and the high number of the surface-exposed Ni3+ species in the film.
Sung et al. also reported the similar result to ours on NiO film that was prepared by the sol-gel method using an aque- ous N,N-dimethylaminoethanol solution.12(f) However, their film characteristics is completely different from ours because the crystallization in the sol-gel method occurred after film formation whereas our film was formed by pre- crystallized NiOx.
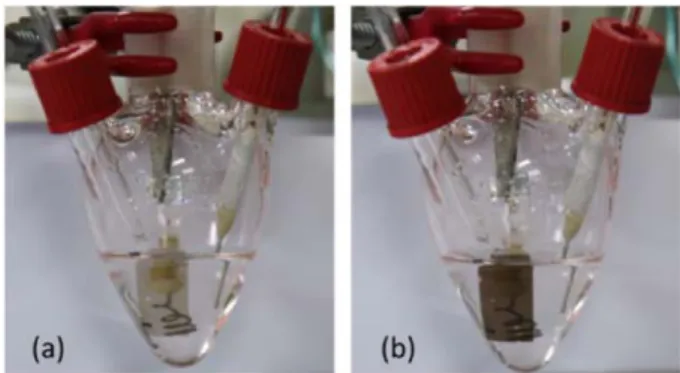
The electrochromic color change of this film during the cycling in CV was visually shown in Fig. 6. The color change from transparent pale green to deep dark brown is clearly demonstrated at the cathodic and anodic end potentials.
The electrochromic performances of this NiOx film were quantitatively investigated by the repeated step potential Figure 4. (a) TEM image of NiOx nanoparticles in the dispersed sol after being ball-milled in ethanol (bar scale: 20 nm). (b) FE-SEM image of the NiOx film on PET/ITO (bar scale: 100 nm).
Figure 5. Cyclic voltammograms of the NiOx thin film on PET/
ITO and bare PET/ITO in 0.1 M LiClO4 PC solution for 10 cycles with a scan rate of 25 mV/s.
chronoamperometry (CA) combined with spectrophotome- try. Fig. 7 shows the part of CA response of the NiOx elec- trode at the repeated step-potentials of +1.2 V and -0.8 V for each 30 s during 50 cycles. The cathodic maximum cur- rent that gives the bleached state is about 2 times higher than the anodic maximum current that gives the colored state and the cathodic response time also looks faster than the anodic one. This means that the reduction process that needs Li+-insertion is easier than oxidation process that accompanies Li+ extraction. This is apparently an unexpected result because the insertion of ion into crystal structure usu- ally seems to be harder than the extraction. However, this result could be due to the surface redox process where the deep ion insertion is not necessary. Since our NiOx film was prepared by the pre-crystallized nanoparticles that have a high ratio of Ni3+ component on surface and silica binder, the well-dispersed nanoparticles were interconnected by silica and the electroactive surface that were covered
initially with Ni3+ instead of Ni2+ is relatively large as shown in XPS data. Therefore, the redox process might be dominated mostly by the surface components. One more noticeable feature is that the anodic current that remained at the end of the anodic step potential is much higher than that of the corresponding cathodic current. However, the entire cur- rent profile was kept well constant without a recognizable degradation for 50 cycles.
We have integrated this CA data to convert into the chro- nocoulometric (CC) data since the electrochromic effect depends on the amount of charge, not on the current. The data was plotted in Fig. 8. The apparent anodic charge increase (ΔQa, from valley to peak in Fig. 8(a)) was always slightly larger than the cathodic charge increase (ΔQc, from peak to valley, the actual data is the decrease of charge den- sity in the figure) during the cycles and the ratio of ΔQc/ ΔQa was kept nearly constant. The average charge den- sities were about 12 and 14 mC/cm2 for bleaching at -0.8 V Figure 6. The pictures of the NiOx film electrode during the cyclic
voltammetry: (a) the bleached state at -0.8 V vs Ag, (b) the colored state at +1.2 V vs Ag.
Figure 7. The repeated chronoamperometric responses of the NiOx film electrode at the step-potentials of +1.2 V and -0.8 V vs Ag for each 30 s. (solid line: current, dotted line: applied potential).
Figure 8. The repeated chronocoulometric responses of the NiOx film electrode at the step-potentials of +1.2 V and -0.8 V vs Ag for each 30 s: (a) as is measured, (b) as corrected for the background charge.
than the cathodic one as mentioned earlier. If the anodic charges are accumulated in the film, the optical transmit- tance should gradually decrease but no such a tendency was found as the data will be discussed hereafter. Therefore, this background charge is certainly not related to the redox process of NiOx film. This background anodic process might be related to the catalytic oxidation of the solvent of PC by NiOx, as PC cannot be oxidized at the ITO electrode by this anodic potential as shown in Fig. 5. To see the change in charge density by the redox process of NiOx alone, this background charge increase in Fig. 8(a) was estimated by fitting to the anodic maximum values and the charge density change was corrected and shown in Fig. 8(b). After this correction, the anodic and cathodic charge were well bal- anced, and the charge reversibility was almost 100%. This explains that the CA response remained constant despite the accumulation of anodic charge. As far as we know, this fact has never been discussed in other relevant literature.
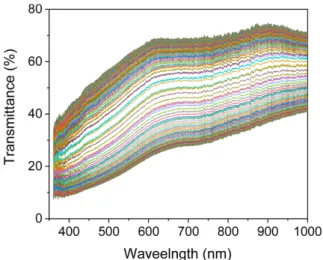
The optical transmittance change of NiOx film was mea- sured simultaneously with the CA measurement. Fig. 9 shows the change in the transmission spectra of the NiOx
and shown in Fig. 10. The changes in transmittance during the bleaching and coloring cycles were quite symmetric as shown in Fig. 10. This matches well to the charge density change shown in Fig. 8(b). The transmittance difference (ΔT550) between the colored and bleached states was about 44.5% at this potential difference (-0.8/+1.2 V vs Ag). If we define the response times of coloring and bleaching as a time that need to reach 70% of ΔTc and ΔTb, respectively, both the response times evaluated from Fig. 10 are about 5.5 s without an appreciable difference within a variation of 0.5 s. The colorization efficiency (CE) which is defined as the change in optical density per charge density change (ΔOD/ΔQ) is one of the important parameters to evaluate the electrochromic performance. The CE value at 550 nm was calculated to be 40.6 cm2/C with the step potentials of +1.2/-0.8 V vs Ag for 30 s. This value is comparable to the CE values obtained for various NiO films in aqueous KOH solution.24 Due to the wide variety of measurement con- ditions, especially such as wavelength and potential dif- ference, it is difficult to directly compare this value with other reported values.
Figure 9. The transmission spectrum changes of the NiOx film electode according to the repeated CA measurements for the first two cycles.
Figure 10. The transmittance changes of the NiOx film elec- trode at 550 nm and for whole visible light according to the CA measurement.
The integrated luminous transmittance (Tlum), referred to as the transmittance of visible light in the industrial stan- dard, is defined and calculated according to the following equation:
where Tλ represents the measured spectral transmittance, Dλ and Vλ are the spectral energy distribution and the stan- dard luminous efficiency for the photopic vision of human eye.25 The change of Tlum of NiOx film on PET/ITO for the CA cycling was also plotted in Fig. 10, together with T550. The value of Tlum is very similar to T550. The visible light modulation, ΔTlum was 44.1% and the CE for visible light, not specific wavelength, was 38.2 cm2/C. The vis- ible light modulation value of the electrochromic film is often presented in the literature, but the CE for “visible light” has not been presented in any other literature as far as we know. For the industrial standard of electrochro- mic film, this colorization efficiency for visible light might be necessary.
CONCLUSION
A new and facile method to fabricate electrochromic NiOx thin films on any kinds of substrates was presented. This method utilized the coating sol prepared by dispersing nanocrystalline NiOx into an alcoholic solvent with a silane binder. A robust NiOx thin film on flexible PET/ITO sub- strate with relatively low haze was prepared by bar-coating of nanocrystalline NiOx dispersion sol without high-tem- perature thermal treatment. The electrochromic performance of this NiOx film on PET/ITO electrode in non-aqueous LiC- lO4 electrolyte solution was comparable to that of other NiOx films on ITO/glass in a KOH aqueous solution. The NiOx film of a 400 nm thickness exhibits visible light modulation of ca. 40%, colorization efficiency of 40.6 cm2/C at 550 nm and a response time of 5 s at step potentials of -0.8/+1.2 V vs Ag without the activation cycle for Li+ ion intercala- tion-deintercalation. If we neglect the side reaction related to solvent, the almost 100% charge reversibility was obtained with this NiOx thin film. Further investigations on the applied potential dependence and long-term stabilty of this NiOx film are undergoing.
Acknowledgments. This work was supported by Pukyong National University Research Fund (Year 2019-2020).
REFERENCES
1. Monk, P. M. S.; Mortimer, R. J.; Rosseinsky, D. R. Elec- trochromism and Electrochromic Devices, Cambridge Press:
Cambridge, 2007.
2. Niklasson, G. A.; Granqvist, C. G. J. Mater. Chem. 2007, 17, 127.
3. Murphy, T. P.; Hutchins, M. G. Sol. Energy Mater. Sol.
Cells 1995, 39, 377.
4. Cordoba-Torresi, S. I.; Gabrielli, C.; Hugot-Le Goff, A.;
Torresi, R. J. Electrochem. Soc. 1991, 138, 1548.
5. (a) Passerini, S.; Scrosati, B.; Gorenstein, G., Dekker, F. J.
Electrochem. Soc. 1990, 137, 3297. (b) Decker, F.; Pas- serini, S. Pileggi, R.; Scrosati, B. Electrochim. Acta 1992, 37, 1033.
6. (a) Jeevanandam, P.; Koltypin, Y.; Gendanken, A. Nano Lett. 2001, 1, 263. (b) Usha, K. S.; Sivakumar, R.; San- jeeviraja, C.; Sathe, V.; Ganesan, V.; Wang, T. Y. RSC Adv.
2016, 6, 79668. Park, C.; Kim, J.; Lee, K.; Oh, S. K.;
Kang, H. J.; Park, N. S. App. Sci. Converg. Tech. 2015, 24, 72. (d) Manouchehri, I.; Alshiaa, S. A. O.; Mehrpar- parvar, D.; Hamil, M. I.; Moradian, R. Optik, 2016, 127, 9400.
7. Maruyama, T.; Arai, S. Sol. Energy Mater. Sol. Cells 1993, 30, 257.
8. (a) Mahmoud, S. A.; Aly, S. A.; Abdel-Rahman, M.;
Abdel-Hady, K. Physca B, 2000, 293, 125. (b) Wu, M.-S.;
Yang, C.- H. Appl. Phys. Lett. 2007, 91, 033109.
9. (a) Rubin, M. Wen, S.-J.; Richardson, T.; Kerr, J.; von Rottkay, K.; Slack, J. Sol. Energy Mater. Sol. Cells 1998, 54, 59. (b) Moulki, H.; Park, D. H.; Min, B.-K.; Kwon, H.; Hwang, S.-J.; Choy, J.-H.; Toupance, T.; Campet, G.;
Rougier, A. Electrochim. Acta 2012, 74, 46. (c) Penin, N.;
Rougier, A.; Laffont, L.; Poizot, P.; Tarascon, J. M. Sol.
Energy Mater. Sol. Cells 2006, 90, 422.
10. (a) Reguig, B. A.; Reragui, A.; Morsli, M.; Khelil, A.;
Addou, M.; Berbede, J. C. Sol. Energy Mater. Sol. Cells 2006, 90, 1381. (b) Wu, C.-C.; Yang, C.-F. Nano. Res.
Lett. 2013, 8, 33.
11. (a) Pramanik, P.; Bhattacharya, S. J. Electrochem. Soc.
1990, 137, 3869. (b) Han S.-Y.; Lee, D.-H., Chang, Y.-J.;
Ryu, S.-O.; Lee, T.-J.; Chang, C.-H. J. Electrochem. Soc.
2006, 153, C382. (c) Xia, X. H.; Tu, J. P.; Zhang, X. L.;
Zhang, W. K.; Huang, H. Electrochem. Acta 2008, 53, 5721. (d) Zhang, J.; Cai, G.; Zhou, D.; Tang, H.; Wang, X.; Gu, C.; Tu, J. J. Mater. Chem. C 2014, 2, 7013.
12. (a) Boschloo, G.; Hagfeldt, A. J. Phys. Chem. B 2001, 105, 3039. (b) Korošec, R. C.; Bukovec, P.; Pihlar, B.; Gomilšek, J. P. Thermochim. Acta 2003, 402, 57. (c) Korošec, R. C.;
Bukovec, P. Thermochim. Acta 2004, 410, 65. (d) Korosec, R. C.; Bukovec, P. Acta Chim. Slov. 2006, 53, 136. (e) Zayim, E. O.; Turhan, I.; Tepehan, F. Z.; Ozer, N. Sol. Energy Mater.
Sol. Cells 2008, 92, 164. (f) Park, S. H.; Lim, J. W.; Yoo, S. J.; Cha, Y.; Sung, Y. E. Sol. Energy Mater. Sol. Cells 2012, 99, 31. Guo, W.; Hui, K. N.; Hui, K. S. Mater. Lett.
Tlum
DλVλTλ
∑
λDλVλ
∑
λ--- for 380≤ ≤λ 780 nm
=