ABSTRACT
Objective: To examine the association between tumor grade and survival for women with squamous cervical cancer.
Methods: This retrospective observational study utilized the Surveillance, Epidemiology, and End Result program data between 1983 and 2013 to examine women with squamous cervical cancer with known tumor differentiation grade. Multivariable analyses were performed to assess independent associations between tumor differentiation grade and survival.
Results: A total of 31,536 women were identified including 15,175 (48.1%) with grade 3 tumors, 14,084 (44.7%) with grade 2 neoplasms and 2,277 (7.2%) with grade 1 tumors.
Higher tumor grade was significantly associated with older age, higher stage disease, larger tumor size, and lymph node metastasis (all, p<0.001). In a multivariable analysis, grade 2 tumors (adjusted-hazard ratio [HR]=1.21; p<0.001) and grade 3 tumors (adjusted-HR=1.45;
p<0.001) were independently associated with decreased cause-specific survival (CSS) compared to grade 1 tumors. Among the 7,429 women with stage II–III disease who received radiotherapy without surgical treatment, grade 3 tumors were independently associated with decreased CSS compared to grade 2 tumors (adjusted-HR=1.16; p<0.001). Among 4,045 women with node-negative stage I disease and tumor size ≤4 cm who underwent surgical treatment without radiotherapy, grade 2 tumors (adjusted-HR=2.54; p=0.028) and grade 3 tumors (adjusted-HR=4.48; p<0.001) were independently associated with decreased CSS compared to grade 1 tumors.
Conclusion: Our study suggests that tumor differentiation grade may be a prognostic factor in women with squamous cervical cancer, particularly in early-stage disease. Higher tumor grade was associated with poorer survival.
Keywords: Cervical Cancer; Squamous Cell Carcinoma; Grade; Differentiation; Survival;
Review
Original Article
Received: May 8, 2018 Revised: Jun 17, 2018 Accepted: Jul 18, 2018 Correspondence to Koji Matsuo
Division of Gynecologic Oncology, Department of Obstetrics and Gynecology, University of Southern California, 2020 Zonal Avenue, IRD520, Los Angeles, CA 90033, USA.
E-mail: [email protected] Copyright © 2018. Asian Society of Gynecologic Oncology, Korean Society of Gynecologic Oncology
This is an Open Access article distributed under the terms of the Creative Commons Attribution Non-Commercial License (https://
creativecommons.org/licenses/by-nc/4.0/) which permits unrestricted non-commercial use, distribution, and reproduction in any medium, provided the original work is properly cited.
ORCID iDs Koji Matsuo
https://orcid.org/0000-0002-6232-8701 Hiroko Machida
https://orcid.org/0000-0003-2252-3577 Lynda D. Roman
https://orcid.org/0000-0002-6960-4414
Koji Matsuo ,1,2 Rachel S. Mandelbaum,1 Hiroko Machida ,3
Sanjay Purushotham,4 Brendan H. Grubbs,5 Lynda D. Roman ,1,2 Jason D. Wright6
1 Division of Gynecologic Oncology, Department of Obstetrics and Gynecology, University of Southern California, Los Angeles, CA, USA
2Norris Comprehensive Cancer Center, University of Southern California, Los Angeles, CA, USA
3Department of Obstetrics and Gynecology, Tokai University School of Medicine, Kanagawa, Japan
4Department of Computer Science, University of Southern California, Los Angeles, CA, USA
5 Division of Maternal-Fetal Medicine, Department of Obstetrics and Gynecology, University of Southern California, Los Angeles, CA, USA
6 Department of Obstetrics and Gynecology, Columbia University College of Physicians and Surgeons,
New York, NY, USA
Association of tumor differentiation
grade and survival of women with
squamous cell carcinoma of the
uterine cervix
INTRODUCTION
Globally, cervical cancer is recognized as the most common gynecologic malignancy with more than 500,000 women diagnosed in 2012 [1]. Nearly one third of women succumb to the disease in the first 5 years following diagnosis [2]. The most common histologic subtype of cervical cancer is squamous cell carcinoma (SCC), accounting for two-thirds of cases [3]. The prognosis of women with cervical cancer, including that of squamous histology, is largely dependent on tumor factors including the presence of nodal metastasis, parametrial involvement, tumor size, deep stromal invasion, and lympho-vascular space invasion (LVSI) [4,5]. Another possible prognostic factor may include the degree of tumor differentiation.
The prognostic significance of tumor grade has been controversial, and, historically tumor grade has not been factored into treatment decisions for SCC [6]. While some studies have demonstrated decreased survival for higher grade tumors, others found no association with survival [3,7-15]. Because these studies were performed a few decades ago with relatively small sample sizes, the interpretation of their findings is somehow difficult to adopt.
Recently, comprehensive high-throughput genomic and molecular analyses of cervical cancer were performed [16]. This study demonstrated that the keratin patterns are an integral part in clustering SCC and are associated with survival [16]. As the evaluation of keratinization is a key element in grading of SCC, there is a biologic basis by which grade may impact outcomes [6]. To date, large studies specifically examining the association with tumor grade and survival have been lacking. We performed a population-based analysis to examine the association between tumor grade and survival for women with squamous cervical cancer.
MATERIALS AND METHODS
This retrospective study utilized the National Cancer Institute's Surveillance, Epidemiology, and End Results (SEER) program, the largest population-based tumor registry in the United States [17]. This database was launched and has been maintained since 1973. This tumor registry covers approximately 27.8% of the US population, and is publicly available and de- identified. The data entry and management is performed by trained staff personnel who are certified by the National Cancer Registrars Association with rigorous quality control [18]. The Institutional Review Board at the University of Southern California exempted this study due to the use of said deidentified public data resource.
We used SEER*Stat 8.3.2 to extract the SEER18 cases, generating the dataset from “Cervix Uteri” limited to women with malignant cervical tumors. Women with primary cervical cancer whose tumors had SCC histology with known tumor grade between 1983–2013 were eligible for the analysis. Metastatic tumors to the uterine cervix, other histologic types, and tumors with unknown grade were excluded from the analysis. ICD-0-3 site/histology validation list and World Health Organization (WHO) histological classification were utilized to identify SCC histology (8070-3, 8071-3, 8072-3, and 8073-3) as described previously [19,20].
In our study, we did not include cases with microinvasive SCC (8076-3) because the vast majority of these cases (82.9%) did not have information for tumor grade. In addition, rare variants of SCC (adenoid, spindle cell, and clear cell types) were not included in this analysis.
Funding
This work was supported by Ensign Endowment for Gynecologic Cancer Research (M.K.).
Conflict of Interest
J.D.W. is consultant for Clovis Oncology and Tesaro. No potential conflict of interest relevant to this article was reported.
Author Contributions
Conceptualization: M.K.; Data curation: M.H.;
Formal analysis: M.K., M.H., P.S.; Funding acquisition: M.K., R.L.D.; Investigation: M.K., M.R.S., M.H., P.S., G.B.H., R.L.D., W.J.D.;
Methodology: M.K.; Project administration:
M.K.; Resources: M.H., M.K.; Software: M.H., M.K.; Supervision: M.K., W.J.D.; Validation:
M.H., M.K., P.S.; Visualization: M.H., M.K.;
Writing - original draft: M.K.; Writing - review &
editing: M.K., M.R.S., M.H., P.S., G.B.H., R.L.D., W.J.D.
Among the eligible cases for the study, patient demographics, tumor characteristics, initial treatment, and survival information were abstracted from the database. Patient demographics included age, year, race, marital status, and registration area. Tumor characteristics included cancer stage, tumor grade, tumor size, and regional lymph node status. Initial treatment types included the use of radiotherapy and surgical treatment.
Survival information included cause-specific survival (CSS) and overall survival (OS).
In this database, the tumor grade was recorded as grade 1 (well-differentiated), grade 2 (moderately-differentiated), and grade 3 (poorly-differentiated) [17]. In our study, tumors with “high grade,” “undifferentiated” and “anaplastic” were grouped as grade 3 tumors.
Recorded cancer stage was based on the American Joint Committee on Cancer (AJCC) 7th surgical-pathological staging classification schema [21]. CSS was defined as the time interval between the cancer diagnosis and the death from the cervical cancer. OS was defined as the time interval between the cancer diagnosis and the death from any reason (all-cause).
Women alive at the last follow-up were censored. In this database, cause of death is linked with the National Death Index and the state mortality records [22].
The primary interest of analysis was to examine the association of tumor grade and survival of women with squamous cervical cancer. The secondary interest of analysis was to examine the association of tumor grade and clinico-pathological characteristics. Differences in continuous variables between groups were assessed using One-way analysis of variance (ANOVA) test or Kruskal-Wallis H test as appropriate. Categorical and ordinal variables across the multiple groups were assessed with χ2 test.
Kaplan-Meier method was used to construct survival curves, and log-rank test was used to assess differences between the curves for univariable analysis [23]. Cox proportional hazard regression models were used to assess the independent association of tumor grade and survival after adjustment for other covariates of interest [24]. Data are reported as adjusted- hazard ratio (HR) with 95% confidence intervals (CIs).
In a sensitivity analysis, we assessed the association between tumor grade and survival in various clinical settings. First, we examined this association in women with node-negative stage I disease who underwent surgical treatment alone without radiotherapy (representing surgical disease). Second, we examined this association in women with stage II–III disease who received radiotherapy without surgical treatment (representing radiation disease). An interaction between grade and stage for survival was also examined because stage is known to be surrogate factor for survival, and treatment type is largely based on stage [25].
All the analyses in this study were performed based on 2-sided hypothesis tests, and a p<0.05 was considered statistically significant. Statistical Package for Social Sciences (SPSS, version 24.0; IBM Corp., Armonk, NY, USA) was used for the analysis.
RESULTS
A total of 31,536 women with known tumor grade were included in the analysis (Table 1). The most common tumor grade was grade 3 (n=15,175, 48.1%) representing nearly a half of the study population, followed by grade 2 (n=14,084, 44.7%) and grade 1 (n=2,277, 7.2%) neoplasms.
Older age was associated with higher tumor grade (p<0.001). White women were more likely to have grade 1 tumors than other races whereas non-white women were more likely to have grade 3 tumors (p=0.002). Married women had a higher chance of grade 1 tumor than other Table 1. Patient demographics, tumor characteristics, and treatment types (n=31,536)
Characteristics Grade 1 Grade 2 Grade 3 p-value
No. 2,277 (7.2) 14,084 (44.7) 15,175 (48.1)
Age 49.7±15.6 51.0±15.0 52.0±15.6 <0.001
<40 689 (8.8) 3,544 (45.2) 3,609 (46.0)
40–49 582 (7.2) 3,696 (45.7) 3,808 (47.1)
50–59 423 (6.5) 2,909 (45.0) 3,129 (48.4)
60–69 286 (6.1) 2,110 (45.1) 2,283 (48.8)
70–79 182 (6.5) 1,193 (42.4) 1,441 (51.2)
≥80 115 (7.0) 632 (38.3) 905 (54.8)
Race 0.002
White 1,213 (7.7) 7,465 (45.0) 7,853 (47.3)
Black 341 (6.7) 2,253 (44.2) 2,504 (49.1)
Hispanic 440 (6.7) 2,894 (43.9) 3,253 (49.4)
Asian 154 (6.2) 1,103 (44.5) 1,220 (49.3)
Others 69 (8.6) 369 (46.1) 363 (45.3)
Marital status 0.009
Married 1,029 (7.9) 5,798 (44.5) 6,208 (47.6)
Single 525 (6.6) 3,583 (45.2) 3,817 (48.2)
Others 619 (6.8) 4,039 (44.4) 4,448 (48.8)
Unknown 104 (7.1) 664 (45.2) 702 (47.8)
Area 0.070
West 1,194 (7.1) 7,468 (44.3) 8,193 (48.6)
Central 460 (7.1) 3,000 (46.0) 3,062 (46.9)
East 623 (7.6) 3,616 (44.3) 3,920 (48.0)
Year at diagnosis <0.001
Before 1990 263 (9.2) 1,223 (42.6) 1,384 (48.2)
1990 to 1999 485 (6.9) 2,932 (41.9) 3,581 (51.2)
2000 to 2009 1,037 (6.6) 7,095 (45.2) 7,563 (48.2)
2010 or later 492 (8.2) 2,834 (47.4) 2,647 (44.3)
Stage <0.001
I 1,337 (58.7) 6,094 (43.3) 5,497 (36.2)
II 320 (14.1) 2,589 (18.4) 2,841 (18.7)
III 329 (14.4) 3,240 (23.0) 3,729 (24.6)
IV 160 (7.0) 1,429 (10.1) 2,308 (15.2)
Unknown 501 (5.8) 732 (5.2) 800 (5.3)
Tumor size (cm) <0.001
<2 580 (25.5) 2,438 (17.3) 1,713 (11.3)
2.1–4 182 (8.0) 2,093 (14.9) 2,560 (16.9)
4.1–6 219 (9.6) 1,956 (13.9) 2,563 (15.9)
>6 217 (9.5) 1,613 (11.5) 2,096 (13.8)
Unknown 1,079 (47.4) 5,984 (42.5) 6,243 (41.1)
Lymph node <0.001
Not involved 1,573 (69.1) 8,945 (63.5) 8,682 (57.2)
Involved 208 (9.1) 2,523 (17.9) 3,468 (22.9)
Unknown 496 (21.8) 2,616 (18.6) 3,025 (19.9)
Surgery <0.001
No 776 (34.1) 6,128 (43.5) 7,230 (47.6)
Yes 1,466 (64.4) 7,721 (54.8) 7,696 (50.7)
Unknown 35 (1.5) 235 (1.7) 249 (1.6)
Radiotherapy <0.001
No 1,193 (52.4) 4,933 (35.0) 4,509 (29.7)
Yes 1,048 (46.0) 8,923 (63.4) 10,453 (68.9)
Unknown 36 (1.6) 228 (1.6) 213 (1.4)
Number with percent per row or mean with standard deviation are shown. One-way analysis of variance test or χ2 test for p-values. Significant p-values are emboldened.
marital status (p=0.009). There was an increase in the incidence of grade 2 tumors from 41.9% to 47.4% from 1990s to 2010s and a decrease in the occurrence of grade 3 tumors from 51.2% to 44.3% over the same time period (p<0.001).
Tumor characteristics were examined by tumor grade (Table 1). Women with grade 1 tumors were more likely to have stage I disease compared to those who had grade 2–3 tumors (58.7%
vs. 36.2%–43.3%, p<0.001). Conversely, women with grade 3 tumors had a higher chance of stage IV disease compared to those who had grade 1–2 tumors (15.2% vs. 7.0%–10.1%, p<0.001).
Women with lower grade tumors more often had small tumors; conversely, women with higher grade tumors more frequently had larger tumors (p<0.001) and nodal metastasis (p<0.001).
Treatment type was examined per tumor grade (Table 1). Women with lower grade tumors more often underwent surgical treatment (64.4% for grade 1 tumors, 54.8% for grade 2 tumors, and 50.7% for grade 3 tumors, p<0.001). On the other hand, women with higher grade tumors more often received radiotherapy (68.9% for grade 3 tumors, 63.4% for grade 2 tumors, and 46.0% for grade 1 tumors, p<0.001).
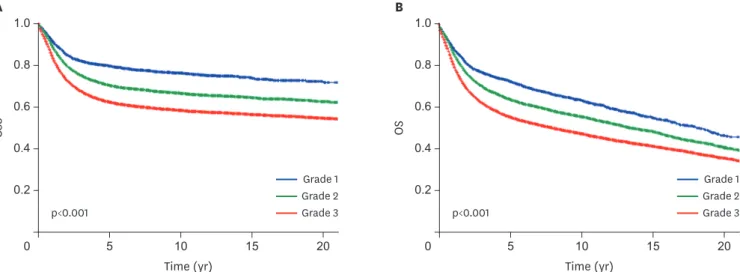
Median follow-up time was 7.2 years. In this cohort, there were 9,990 (31.7%) women who died of cervical cancer and 14,225 (45.1%) women who died of any cause. On univariable analysis, tumor grade was significantly associated with CSS (5-year rates: 79.6% for grade 1 tumors, 70.4% for grade 2 tumors, and 62.3% for grade 3 tumors, p<0.001; Fig. 1A). In a multivariable analysis (Table 2 and Supplementary Table 1), grade 2 tumors (adjusted- HR=1.21; p<0.001) and grade 3 tumors (adjusted-HR=1.45; p<0.001) were independently associated with increased cervical cancer mortality compared to grade 1 tumors. This independent association was also seen when grade 3 tumors were compared to 2 tumors (adjusted-HR=1.20; p<0.001).
Similarly, tumor grade was significantly associated with OS (5-year rates: 72.6% for grade 1 tumors, 63.9% for grade 2 tumors, and 55.4% for grade 3 tumors, p<0.001; Fig. 1B). In a multivariable analysis (Table 2 and Supplementary Table 1), grade 2 tumors (adjusted- HR=1.10; p=0.011) and grade 3 tumors (adjusted-HR=1.26, p<0.001) were independently
Time (yr)
A B
0.6
0.4
0.2
0
OS
0.8 1.0
Time (yr)
p<0.001 p<0.001
0.6
0.4
0.2
0
CSS
0.8 1.0
20
10 15
5 20
10 15
5
Grade 1 Grade 2 Grade 3 Grade 1
Grade 2 Grade 3
Fig. 1. Survival curves based on tumor differentiation grade (n=31,536). Log-rank test for p-values. Survival curves are shown for (A) CSS and (B) OS.
CSS, cause-specific survival; OS, overall survival.
associated with decreased OS compared to grade 1 tumors. When analyses were limited to cases with known tumor size and nodal status, similar results were demonstrated (Supplementary Table 2).
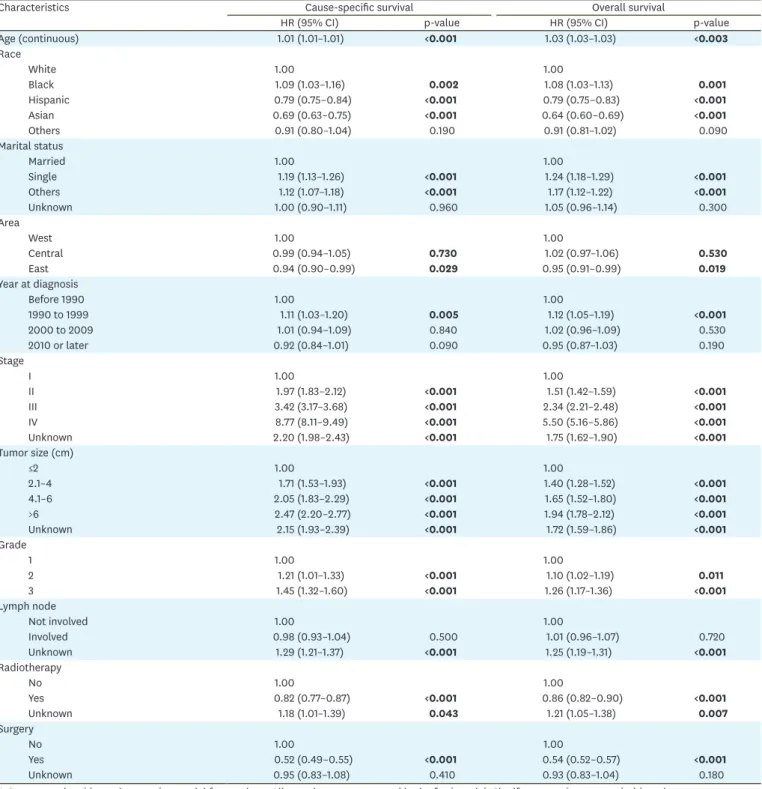
Table 2. Multivariable analysis for survival outcome (n=31,536)
Characteristics Cause-specific survival Overall survival
HR (95% CI) p-value HR (95% CI) p-value
Age (continuous) 1.01 (1.01–1.01) <0.001 1.03 (1.03–1.03) <0.003
Race
White 1.00 1.00
Black 1.09 (1.03–1.16) 0.002 1.08 (1.03–1.13) 0.001
Hispanic 0.79 (0.75–0.84) <0.001 0.79 (0.75–0.83) <0.001
Asian 0.69 (0.63–0.75) <0.001 0.64 (0.60–0.69) <0.001
Others 0.91 (0.80–1.04) 0.190 0.91 (0.81–1.02) 0.090
Marital status
Married 1.00 1.00
Single 1.19 (1.13–1.26) <0.001 1.24 (1.18–1.29) <0.001
Others 1.12 (1.07–1.18) <0.001 1.17 (1.12–1.22) <0.001
Unknown 1.00 (0.90–1.11) 0.960 1.05 (0.96–1.14) 0.300
Area
West 1.00 1.00
Central 0.99 (0.94–1.05) 0.730 1.02 (0.97–1.06) 0.530
East 0.94 (0.90–0.99) 0.029 0.95 (0.91–0.99) 0.019
Year at diagnosis
Before 1990 1.00 1.00
1990 to 1999 1.11 (1.03–1.20) 0.005 1.12 (1.05–1.19) <0.001
2000 to 2009 1.01 (0.94–1.09) 0.840 1.02 (0.96–1.09) 0.530
2010 or later 0.92 (0.84–1.01) 0.090 0.95 (0.87–1.03) 0.190
Stage
I 1.00 1.00
II 1.97 (1.83–2.12) <0.001 1.51 (1.42–1.59) <0.001
III 3.42 (3.17–3.68) <0.001 2.34 (2.21–2.48) <0.001
IV 8.77 (8.11–9.49) <0.001 5.50 (5.16–5.86) <0.001
Unknown 2.20 (1.98–2.43) <0.001 1.75 (1.62–1.90) <0.001
Tumor size (cm)
≤2 1.00 1.00
2.1–4 1.71 (1.53–1.93) <0.001 1.40 (1.28–1.52) <0.001
4.1–6 2.05 (1.83–2.29) <0.001 1.65 (1.52–1.80) <0.001
>6 2.47 (2.20–2.77) <0.001 1.94 (1.78–2.12) <0.001
Unknown 2.15 (1.93–2.39) <0.001 1.72 (1.59–1.86) <0.001
Grade
1 1.00 1.00
2 1.21 (1.01–1.33) <0.001 1.10 (1.02–1.19) 0.011
3 1.45 (1.32–1.60) <0.001 1.26 (1.17–1.36) <0.001
Lymph node
Not involved 1.00 1.00
Involved 0.98 (0.93–1.04) 0.500 1.01 (0.96–1.07) 0.720
Unknown 1.29 (1.21–1.37) <0.001 1.25 (1.19–1.31) <0.001
Radiotherapy
No 1.00 1.00
Yes 0.82 (0.77–0.87) <0.001 0.86 (0.82–0.90) <0.001
Unknown 1.18 (1.01–1.39) 0.043 1.21 (1.05–1.38) 0.007
Surgery
No 1.00 1.00
Yes 0.52 (0.49–0.55) <0.001 0.54 (0.52–0.57) <0.001
Unknown 0.95 (0.83–1.08) 0.410 0.93 (0.83–1.04) 0.180
A Cox proportional hazard regression model for p-values. All covariates were entered in the final model. Significant p-values are emboldened.
CI, confidence interval; HR, hazard ratio.
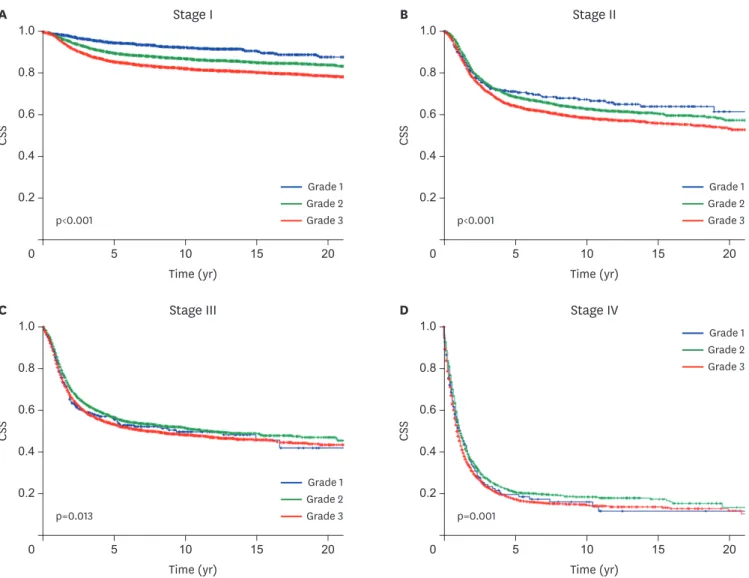
CSS was then examined by cancer stage (Fig. 2). While tumor grade was significantly associated with CSS across the four stages (all, p<0.05), survival differences between the 3 grades were wider in earlier stage diseases compared to more advanced stage diseases (absolute differences in 5-year CSS rate: 9.0%, 6.8%, 3.0%, and 3.4% for stage I, II, III, and IV diseases, respectively). Interaction of stage and grade indicates that grade is a prognostic factor in each stage (p<0.001; Supplementary Fig. 1).
A number of sensitivity analyses were performed (Table 3). First, 6,869 women with node- negative stage I disease who underwent surgery alone without radiotherapy were examined.
In a multivariable analysis, grade 2 tumors (adjusted-HR=2.26; p=0.002) and grade 3 tumors (adjusted-HR=3.55; p<0.001) remained independent prognostic factors associated with decreased CSS compared to grade 1 tumors. When the cohort was further limited to patients with tumor size ≤4 cm (n=4,045), the magnitude of statistical significance became more pronounced (grade 2 tumors: adjusted-HR=2.54, p=0.028; and grade 3 tumors: adjusted- HR=4.48, p<0.001).
Time (yr)
A B
0.6
0.4
0.2
0
CSS
0.8 1.0
Time (yr)
p<0.001 p<0.001
0.6
0.4
0.2
0
CSS
0.8 1.0
20
10 15
5 20
10 15
5
Grade 1 Grade 2 Grade 3
Grade 1 Grade 2 Grade 3
Time (yr)
C D
0.6
0.4
0.2
0
CSS
0.8 1.0
Time (yr)
Stage II Stage I
Stage IV Stage III
p=0.013 p=0.001
0.6
0.4
0.2
0
CSS
0.8 1.0
20
10 15
5 20
10 15
5
Grade 1 Grade 2 Grade 3
Grade 1 Grade 2 Grade 3
Fig. 2. Stage-specific CSS based on tumor differentiation grade. Log-rank test for p-values. CSS curves are shown for (A) stage I, (B) stage II, (C) stage III, and (D) stage IV disease based on tumor grade.
CSS, cause-specific survival.
Next, 7,429 women with stage II–III disease who underwent radiotherapy without surgery were examined. When compared to grade 2 tumors, grade 3 tumors were independently associated with decreased CSS (adjusted-HR=1.16; p<0.001). Grade 3 tumors were also independently associated with decreased CSS compared to grade 1 tumors (adjusted- HR=1.29; p=0.003).
DISCUSSION
Previous studies have been conflicting regarding the impact of tumor differentiation grade on survival in squamous cervical cancer [3,7-15]. Our results are similar to previous studies that demonstrated that higher tumor grade is associated with poorer prognosis [3,7,8,13,15].
Thus, our study validates these prior studies by utilizing more recent data and all-stage disease. In addition, because these studies were either conducted in the 1970–1980s [7,13], were limited to stage I disease alone [15,20], or were not specific to the SCC [3,7], our large Table 3. Sensitivity analyses for cause-specific survival
Characteristics Stage I, node mets (−), surgery (+),
RT (−) (n=6,869) Stage I, node mets (−), surgery (+),
RT (−), size ≤4 cm (n=4,045) Stage II–III, surgery (−), RT (+) (n=7,429)
HR (95% CI) p-value HR (95% CI) p-value HR (95% CI) p-value
Age (continuous) 1.02 (1.01–1.03) <0.001 1.01 (1.00–1.02) 0.053 1.01 (1.01–1.01) 0.003
Race
White 1.00 1.00 1.00
Black 1.33 (0.98–1.80) 0.070 1.26 (0.81–1.95) 0.300 1.10 (0.99–1.21) 0.060
Hispanic 0.95 (0.71–1.28) 0.730 1.29 (0.88–1.90) 0.200 0.82 (0.74–0.91) <0.001
Asian 0.98 (0.67–1.43) 0.900 0.98 (0.56–1.70) 0.930 0.70 (0.60–0.81) <0.001
Others 0.54 (0.22–1.31) 0.170 0.77 (0.24–2.46) 0.660 1.06 (0.86–1.31) 0.580
Marital status
Married 1.00 1.00 1.00
Single 1.22 (0.94–1.59) 0.140 1.35 (0.95–1.94) 0.100 1.18 (1.07–1.30) 0.001
Others 1.34 (1.03–1.75) 0.029 1.40 (0.96–2.04) 0.090 1.13 (1.03–1.24) 0.006
Unknown 0.75 (0.39–1.43) 0.380 1.01 (0.44–2.32) 0.990 1.05 (0.86–1.29) 0.640
Area
West 1.00 1.00 1.00
Central 0.98 (0.73–1.32) 0.880 1.15 (0.76–1.73) 0.510 1.01 (0.92–1.12) 0.820
East 0.94 (0.72–1.24) 0.660 1.14 (0.77–1.67) 0.520 1.01 (0.91–1.11) 0.910
Year at diagnosis
Before 1990 1.00 1.00 1.00
1990 to 1999 0.79 (0.49–1.27) 0.320 0.87 (0.43–1.76) 0.690 1.12 (0.98-1.27) 0.110
2000 to 2009 0.58 (0.36–0.93) 0.025 0.70 (0.34–1.41) 0.320 0.89 (0.78–1.02) 0.090
2010 or later 0.67 (0.36–1.25) 0.210 0.82 (0.35–1.95) 0.660 0.81 (0.68–0.97) 0.019
Grade
1 1.00 1.00 0.90 (0.76–1.06) 0.210
2 2.26 (1.35–3.79) 0.002 2.54 (1.10–5.84) 0.028 1.00
3 3.55 (2.13–5.92) <0.001 4.48 (1.96–10.2) <0.001 1.16 (1.08–1.25) <0.001
Tumor size (cm)
≤4 1.00 1.00
>4 2.77 (2.07–3.72) <0.001 1.30 (1.14–1.48) <0.001
Unknown 0.85 (0.67–1.08) 0.180 1.35 (1.19–1.53) <0.001
Lymph node
Not involved 1.00
Involved 0.98 (0.88–1.09) 0.690
Unknown 1.29 (1.17–1.42) <0.001
Stage
II 1.00
III 1.91 (1.76–2.06) <0.001
A Cox proportional hazard regression model for p-values. All covariates were entered in the final model. Significant p-values are emboldened.
CI, confidence interval; HR, hazard ratio; mets, metastasis; RT, radiotherapy.
sample size study is more definitive to suggest that tumor grade is a prognostic factor in squamous cervical cancer.
There were multiple studies concluding that tumor grade is not a prognostic factor in squamous cervical cancer [9,10]. In a prospective study examining surgically-treated stage IB squamous cervical cancer, tumor grading was examined by central pathology reviews and correlated to pathological findings and survival [9]. Various grading patterns were analyzed but none of grading system correlated to nodal metastasis and survival [9]. It is likely that their sample size could have limited to detect the difference in these outcomes (n=195). By analyzing larger sample size, we demonstrated the differences in these outcomes in our study.
We noted that grade 2–3 lesions are much more common that grade 1 lesions for women with squamous cervical cancer. This finding serves as an external validation of prior studies that were conducted with a limited sample size [11,26]. Importantly, these statistics of tumor grade distribution have been the reason why the utility of tumor grading in the management of women with squamous type cervical cancer has been limited [6,15]. That is, 1) the vast majority of squamous tumors are of higher grade and 2) high grade tumors commonly exhibit other known poor prognostic factors. Thus, it has been a consensus that tumor grade alone is unlikely to alter the current available treatment choice [6,15].
For this reason, we conducted a sensitivity analysis to identify the practical utility of tumor grading in squamous cervical cancer. We chose two typical cohorts that otherwise the standard treatment is well-defined in the guidelines (surgery alone cohort and definitive radiotherapy cohort) [27]. First, the significance of tumor grade was examined in a subgroup of women with presumed minimum risk of recurrence (node-negative stage I disease with small tumor). In this group, treatment type with surgery alone without postoperative radiotherapy was indicative that the tumors in the subgroup likely exhibited no poor prognostic factors. We found that tumor grade is useful to identify a group of women with decreased survival outcome with current treatments. Thus, our findings are clinically meaningful in that tumor grade matters in such surgically treated cervical cancer.
Next, we examined the impacts of tumor grade in women with stage II–III disease who underwent radiotherapy. Similarly, women with grade 3 tumors had worse survival outcome as compared to those with grade 1–2 tumors. Thus, our results are clearly impactful even with definitive radiation treatment for cervical cancer. Typically, women with stage II–III squamous cervical cancer receive definitive radiotherapy without hysterectomy or systemic chemotherapy [27]. Therefore, given the decreased survival in higher tumor grade cases, it may be of interest to examine whether additional chemotherapy following definitive radiotherapy is beneficial in higher grade disease.
Prior studies have been missing a biological plausible link between higher tumor grade and decreased survival in squamous cervical cancer. In this histologic subtype, in addition to evaluation of nuclear atypia and mitosis, grading of tumor differentiation includes identification of keratinization [6]. That is, the presence of keratinization is suggestive of a lower tumor grade whereas the absence of keratinization is suggestive for a higher tumor grade, implying that the presence of keratinization is associated with survival outcome.
A recent analysis from findings of The Cancer Genome Atlas (TCGA) partly supports our clinical observation in that this study found the keratin pattern to be a fundamental marker by which to cluster SCC of the uterine cervix [16].
Specifically, SCC can be grouped based on keratin pattern: keratin-high versus keratin-low.
While keratin-high tumors are associated with PI3K/AKT signaling, keratin-low tumors are characterized by more aggressive tumor characteristic with epithelial-mesenchymal transition. In fact, survival was worse in women whose tumors had epithelial-mesenchymal transition than those who had the PI3K/AKT abnormality [16]. Therefore, it is speculated that grade 1 tumors are more likely to be keratin-high tumors resulting in good prognosis;
conversely, grade 2–3 tumors are more likely to be keratin-low tumors resulting in poor prognosis. We propose this as a biologically plausible mechanism for the association of tumor grade and survival outcome in squamous cervical cancer. Further study is warranted to support this association.
A strength of our study is that this is a population-based study examined the largest tumor registry in the United States. We demonstrated a consistency of association of tumor grade in all stages serving as an internal validation. A weakness of the study is that this is a retrospective study, and there may be missing confounders for analysis. For example, this study does not have salient tumor factors such as depth of tumor invasion and LVSI. Similarly, the database does not have information for chemotherapy including radio-sensitizer.
Therefore, we were not able to assess if additional chemotherapy is beneficial for tumors with higher grade. Moreover, this database does not have information for recurrence.
A limitation of the study is that there was a large number of cases with missing tumor grade in this database. Examining data over three decades may be another limitation of the study because the standard of treatment has changed during the study period, and concurrent chemo-radiotherapy is now considered for locally-advanced disease or high-risk early- stage disease [4,28]. Indeed, our analysis observed a trend of improving survival over time.
Presence of lymph node metastasis is also not specified as histo-pathological or radiographic in this database. Moreover, central pathology review for tumor grading was not performed.
However, tumor differentiation grading is likely reproducible with high inter-observer agreement among pathologists, and misclassification of tumor grades is unlikely.
In summary, tumor grade is a prognostic factor for squamous cervical cancer, particularly early-stage disease. In this population, higher tumor grade is associated with decreased survival. Routine evaluation of tumor grade with synoptic description is therefore highly recommended in daily practice. Integration of tumor grade into the treatment algorithm of squamous cervical cancer has yet examined and further study is warranted.
SUPPLEMENTARY MATERIALS
Supplementary Table 1
Multivariate models for association of tumor grade and survival outcome Click here to view
Supplementary Table 2
Multivariate models for association of tumor grade and cause-specific survival (known tumor size and nodal status)
Click here to view
Supplementary Fig. 1
Interaction term of stage and grade for survival. Adjusted hazard ratio (X-axis) is shown based on interaction of stage and grade for CSS (top panel) and OS (bottom panel).
Click here to view
REFERENCES
1. Torre LA, Bray F, Siegel RL, Ferlay J, Lortet-Tieulent J, Jemal A. Global cancer statistics, 2012. CA Cancer J Clin 2015;65:87-108.
PUBMED | CROSSREF
2. National Cancer Institute (US). Cancer stat facts: cervical cancer [Internet]. Bethesda, MD: National Cancer Institute; 2018 [cited 2018 Mar 22]. Available from: https://seer.cancer.gov/statfacts/html/cervix.html.
3. Vinh-Hung V, Bourgain C, Vlastos G, Cserni G, De Ridder M, Storme G, et al. Prognostic value of histopathology and trends in cervical cancer: a SEER population study. BMC Cancer 2007;7:164.
PUBMED | CROSSREF
4. Peters WA 3rd, Liu PY, Barrett RJ 2nd, Stock RJ, Monk BJ, Berek JS, et al. Concurrent chemotherapy and pelvic radiation therapy compared with pelvic radiation therapy alone as adjuvant therapy after radical surgery in high-risk early-stage cancer of the cervix. J Clin Oncol 2000;18:1606-13.
PUBMED | CROSSREF
5. Sedlis A, Bundy BN, Rotman MZ, Lentz SS, Muderspach LI, Zaino RJ. A randomized trial of pelvic radiation therapy versus no further therapy in selected patients with stage IB carcinoma of the cervix after radical hysterectomy and pelvic lymphadenectomy: a Gynecologic Oncology Group study. Gynecol Oncol 1999;73:177-83.
PUBMED | CROSSREF
6. Randall ME, Michael H, Long H, Tedjarati S. Uterine cervix. In: Barakat RR, Markman M, Randall ME, editors. Principles and practice of gynecologic oncology. 5th ed. Philadelphia, PA: Wolters Kluwer/
Lippincott Williams & Wilkins; 2009. p. 623-81.
7. Kosary CL. FIGO stage, histology, histologic grade, age and race as prognostic factors in determining survival for cancers of the female gynecological system: an analysis of 1973–87 SEER cases of cancers of the endometrium, cervix, ovary, vulva, and vagina. Semin Surg Oncol 1994;10:31-46.
PUBMED | CROSSREF
8. Hopkins MP, Morley GW. Stage IB squamous cell cancer of the cervix: clinicopathologic features related to survival. Am J Obstet Gynecol 1991;164:1520-7.
PUBMED | CROSSREF
9. Zaino RJ, Ward S, Delgado G, Bundy B, Gore H, Fetter G, et al. Histopathologic predictors of the behavior of surgically treated stage IB squamous cell carcinoma of the cervix. A Gynecologic Oncology Group study. Cancer 1992;69:1750-8.
PUBMED | CROSSREF
10. Stock RJ, Zaino R, Bundy BN, Askin FB, Woodward J, Fetter B, et al. Evaluation and comparison of histopathologic grading systems of epithelial carcinoma of the uterine cervix: Gynecologic Oncology Group studies. Int J Gynecol Pathol 1994;13:99-108.
PUBMED | CROSSREF
11. Carriaga MT, Henson DE. The histologic grading of cancer. Cancer 1995;75:406-21.
PUBMED | CROSSREF
12. Kristensen GB, Abeler VM, Risberg B, Tropé C, Bryne M. Tumor size, depth of invasion, and grading of the invasive tumor front are the main prognostic factors in early squamous cell cervical carcinoma.
Gynecol Oncol 1999;74:245-51.
PUBMED | CROSSREF
13. Chung CK, Stryker JA, Ward SP, Nahhas WA, Mortel R. Histologic grade and prognosis of carcinoma of the cervix. Obstet Gynecol 1981;57:636-42.
PUBMED
14. Graflund M, Sorbe B, Hussein A, Bryne M, Karlsson M. The prognostic value of histopathologic grading parameters and microvessel density in patients with early squamous cell carcinoma of the uterine cervix.
Int J Gynecol Cancer 2002;12:32-41.
PUBMED | CROSSREF
15. Smiley LM, Burke TW, Silva EG, Morris M, Gershenson DM, Wharton JT. Prognostic factors in stage IB squamous cervical cancer patients with low risk for recurrence. Obstet Gynecol 1991;77:271-5.
PUBMED | CROSSREF
16. Cancer Genome Atlas Research Network; Albert Einstein College of Medicine; Analytical Biological Services; Barretos Cancer Hospital; Baylor College of Medicine; Beckman Research Institute of City of Hope Integrated genomic and molecular characterization of cervical cancer. Nature 2017;543:378-84.
PUBMED | CROSSREF
17. National Cancer Institute (US). The Surveillance, Epidemiology, and End Results (SEER) program of the National Cancer Institute [Internet]. Bethesda, MD: National Cancer Institute; 2018 [cited 2018 March 22]. Available from: https://seer.cancer.gov/.
18. National Cancer Registrars Association (US). Alexandria, VA: National Cancer Registrars Association;
[cited 2018 Sep 3]. Available from: http://www.ncra-usa.org/.
19. Matsuo K, Machida H, Shoupe D, Melamed A, Muderspach LI, Roman LD, et al. Ovarian conservation and overall survival in young women with early-stage cervical cancer. Obstet Gynecol 2017;129:139-51.
PUBMED | CROSSREF
20. Matsuo K, Machida H, Horowitz MP, Shahzad MM, Guntupalli SR, Roman LD, et al. Risk of
metachronous ovarian cancer after ovarian conservation in young women with stage I cervical cancer. Am J Obstet Gynecol 2017;217:580.e1-10.
PUBMED | CROSSREF
21. Edge SB, Byrd DR, Compton CC, Fritz AG, Greene FL, Trotti A. AJCC cancer staging manual. 7th ed. New York, NY: Springer; 2010.
22. Centers for Disease Control and Prevention (US). National death index [Internet]. Atlanta, GA: Centers for Disease Control and Prevention; 2017 [cited 2018 Mar 22]. Available from: https://www.cdc.gov/nchs/
ndi/.
23. Kaplan EL, Meier P. Nonparametric estimation from incomplete observations. J Am Stat Assoc 1958;53:457-81.
CROSSREF
24. Cox DR. Regression models and life-tables. J R Stat Soc Series B Stat Methodol 1972;34:187-220.
25. Wang R, Lagakos SW, Ware JH, Hunter DJ, Drazen JM. Statistics in medicine--reporting of subgroup analyses in clinical trials. N Engl J Med 2007;357:2189-94.
PUBMED | CROSSREF
26. Kidd EA, Spencer CR, Huettner PC, Siegel BA, Dehdashti F, Rader JS, et al. Cervical cancer histology and tumor differentiation affect 18F-fluorodeoxyglucose uptake. Cancer 2009;115:3548-54.
PUBMED | CROSSREF
27. National Comprehensive Cancer Network (US). NCCN Clinical Practice Guidelines in Oncology. Cervical cancer [Internet]. Fort Washington, PA: National Comprehensive Cancer Network; [cited 2018 Mar 22].
Available from: https://www.nccn.org/.
28. Rose PG, Bundy BN, Watkins EB, Thigpen JT, Deppe G, Maiman MA, et al. Concurrent cisplatin-based radiotherapy and chemotherapy for locally advanced cervical cancer. N Engl J Med 1999;340:1144-53.
PUBMED | CROSSREF