https://doi.org/10.4094/chnr.2020.26.3.338
CHNR
Validity and Reliability of the Life Transition Scale in Parents of Disabled Children Across the Life Transition Process
Sun Woo Hong1, JinShil Kim2, Hwal Lan Bang3
1Associate Professor, Department of Emergency Medical Services, Daejeon University, Daejeon; 2Professor, College of Nursing, Gachon University, Incheon;
3Assistant Professor, Department of Nursing, Andong National University, Andong, Korea
Purpose: The Life Transition Scale (LTS) consists of 24 items that assess the life transition process of parents of autistic children.
This study aimed to examine the validity and reliability of the LTS in parents of children with a wide spectrum of disabilities.
Methods: Data were collected from 260 parents of children with disabilities through self-report questionnaires. Validity was examined using exploratory and confirmative factor analysis to determine the factor structures of the LTS; socio-demographic differences in LTS scores were examined using the t-test or ANOVA. Reliability was examined using Cronbach's ⍺ coefficient.
Results: A four-factor structure was validated (x2=640.0, p<.001, GFI=.81, RMSEA=.07, NNFI=.89, CFI=.89, PNFI=.74, Q [x2/df]
=2.60). The validity of the LTS was verified by exploratory factor analysis, with factor loading ranging from .30 to .80. There were significant differences in the accepting phase according to children's and parents' age and the type of disability, and in the wandering phase according to parental gender, educational level, job, and socioeconomic status. The Cronbach's ⍺s for the reliability of each of the four structures were acceptable, within a range of .80~.90. Conclusion: The LTS is a valid and reliable measurement to assess the life transition process of parents with disabled children.
Key words: Disabled children; Parents; Life; Validation study
INTRODUCTION
1. Need for StudyRaising a child with a disability has a tremendous influence on the lives of all family members. Among the 2.49 million people with disabilities in Korea, 89,646 (3.6%) are children under 19 years of age [1]. Intellectual disability affects approx- imately half (49.5%) of disabled individuals, followed by au- tism spectrum disorder (17.5%), brain lesions (13.7%), and vis- ual/auditory/speech disabilities (12.7%) [1].
Common response behaviors of parents whose child is born with a disability or who recognize their child's disability include being shocked and emotionally disturbed [2]. In some cultures and societies, the pain of the parents of disabled chil- dren is often exacerbated by negative societal perceptions and religious convictions that disability is a type of punishment [3,4]. Although taking care of a child is a natural responsibility of a parent, raising a long-term dependent child with a dis- ability involves heavy burdens, such as confronting the child's health problems (related or unrelated to the disability) in the long-term parenting process [5]. Parents may not feel the joy of life while raising disabled children who are susceptible to various health problems, such as pain and sleep disorders [6].
Corresponding author Hwal Lan Bang https://orcid.org/0000-0003-1115-6484
Department of Nursing, Andong National University, 1375 Gyeongdong-ro, Andong 36729, Korea TEL +82-54-820-5686 FAX +82-54-820-6730 E-MAIL [email protected]
Received Jan 20, 2020 Revised Mar 11, 2020 Accepted Mar 16, 2020
This is an Open Access article distributed under the terms of the Creative Commons Attribution Non- Commercial License (http://creativecommons.org/licenses/by-nc/4.0/) which permits unrestricted non- commercial use, distribution, and reproduction in any medium, provided the original work is properly cited.
Parental distress may vary depending on the type of dis- ability or the behavioral problems of the child [7-12]. Mothers commonly experience negative feelings toward children with intellectual disabilities who lack social skills compared to nor- mal children. Furthermore, mothers are at risk of stress and depression due to their child's behavioral problems [7,8].
Children with cerebral palsy, who are classified as having brain lesions, struggle with limitations in their activities of daily living, sensory problems, difficulties of communication, and low intelligence. It was reported that mothers of children with cerebral palsy were commonly blamed for their child- ren's disability. The mothers felt ashamed and stigmatized or experienced overt discrimination and rejection. Thus, they purposely avoided social gatherings, preferring to remain at home [9]. It was also reported that children with learning dis- abilities were emotionally unstable and subject to low self-es- teem [10,11]. A recent study also demonstrated that depres- sion in parents and emotional instability in disabled children may affect each other in a bidirectional relationship [12]; thus, disabled children may be at an elevated risk of abuse or ne- glect [13,14].
Parental reactions or coping patterns may vary depending on the growth of disabled children across the developmental process [15]. The process of accepting and adapting to child- ren's disabilities also varies [16,17]. Lee et al. [18,19] divided the life of parents of children with autism into five phases of transition: denying, wandering, devoting, mind controlling, and finally accepting. Lee, Hong, and Ju [20] modified the process of transition into four phases through confirmatory factor analysis: denying, wandering, despairing, and accept- ing, and developed a tool for measuring the process of life transition, the Life Transition Scale (LTS). The characteristics of the denying phase are ignorance and disbelief. In this phase, parents desire to hide their child's disability because they are self-conscious and intimidated. The wandering phase is the most stressful, marked by feelings of unfairness, fear, anxiety, sadness, shock, disappointment, depression, and guilt.
The despairing phase involves being worn out and feeling helpless because there are no improvements in the symptoms of their child's disability. Eventually, in the accepting phase, parents reorganize their lives to care for their children with a disability, and this period is marked by feelings of acceptance, gratitude, and mutual dependence. Once they reach the ac- cepting phase, parents can easily move beyond the emotions they initially felt, even if a new crisis emerges and reverts them to the wandering or the despairing phase, and accept that they have done their best even if the disability does not improve despite all their efforts. Therefore, the accepting phase acts as a mediating factor between the behavior of the child and the mental health of the parent, and it is an im-
portant factor for parents in coping with the behaviors of chil- dren with disabilities [21].
Parents of autistic children who face substantial burdens of care often follow an adjustment process throughout the life- course of their children's illness trajectory. Likewise, the pa- rents of children with other types of disabilities, such as cere- bral palsy, also undergo substantially distressful circumstan- ces caused by their children's disability. Thus, hypothetically, parents of children with other types of disabilities are likely to follow the same adjustment process throughout the child's ill- ness trajectory as do the parents of autistic children. Although specific aspects of the process of parents accepting a child's disability vary by the type of disability [16,17], it is necessary to acquire information about how parents cope with the im- pact of their child's disability and how they perceive their cir- cumstances. The phase of transition needs to be identified to help children with disabilities and their families live a healthy life, by facilitating the parents' progress from the denying, wandering, and despair phases to the accepting phase. It is al- so necessary to measure the transition process of individual parents raising a child with a disability and to identify differ- ences and factors that influence each phase of the transition process depending on the characteristics of the child and the parent.
Accordingly, the feasibility of the LTS developed by Lee et al. [20] was tested among parents of children with various dis- abilities, other than autistic spectrum disorder, by examining whether the transition processes fit the adjustment of parents of children with other disabilities. Specifically, this study was aimed to examine the validity and reliability of the LTS in pa- rents of children with a wide spectrum of disabilities and to identify differences in the life transition process according to parents' socio-demographic characteristics. It is expected that this process will provide a basis for determining specialized nursing interventions at each phase for the parents of children with disabilities.
METHODS
1. Study DesignThis was a validation study to examine whether the LTS de- veloped by Lee et al. [20] could be applied to parents of chil- dren with different types of disabilities and to test the validity and reliability of the scale.
2. Data Collection and Procedures
This study was approved by the Institutional Review Board of Wonkwang Health Science University (WKIRB-201603-SB-
011). Data were collected from May 20 to August 31, 2016 through self-report questionnaires. Participants were recruited from daycare centers for children with disabilities, lifelong education centers, and local children's centers for the dis- abled. Before data collection, a questionnaire with a letter ex- plaining the purpose of this study was sent to the head of the institutions. After obtaining approval from the institution, questionnaire booklets with a stamped envelope for their re- turn were distributed to the parents of children with disabil- ities. Each envelope contained a letter guaranteeing the ano- nymity and confidentiality of the data, an informed consent form, instructions, and a token of appreciation. The sample size of 183 was estimated with ⍺= .05, a medium effect size of .30, and a power of .90 using G*Power version 3.1.7. To ac- count for the potential for a high drop-out rate [20], 320 ques- tionnaires were mailed out, and of the 282 returned ques- tionnaires (response rate=88.1%), 22 were incomplete. Thus, 260 responses were used for the data analysis.
3. Measurements
1) The Life Transition Scale for parents of children with autism The LTS is a parent-reported scale that assesses the process of life transition of parents of children with autism spectrum disorder [20]. The researchers did not modify any existing questions when applying the LTS to parents of children with other types of disabilities, because the LTS consists of ques- tions about 'feelings' experienced by parents of children with disabilities and does not refer to specific disabilities. Parents were instructed to mark their current feelings regarding their lives on a 4-point Likert-type scale (not true=1 to completely or always true=4). This scale consisted of 24 items and had four subscales, including phases of denying (6 items), wan- dering (8 items), despairing (4 items), and accepting (6 items).
For each phase, scores ranging from 1 to 4 were summed and averaged, to compare the life transitional feelings across the phases. Validity and reliability were documented previously through confirmatory factor analysis. The internal consisten- cy of each of the four subscales was determined to be accept- able. In a previous study with parents of autistic children, Cronbach's ⍺ coefficient of the total scale was .83, and the co- efficients for the subscales were .86 for denying, .90 for wan- dering, .77 for despairing, and .85 for accepting [20].
4. Data Analysis
Descriptive statistics were calculated to represent the gen- eral characteristics of the sample. Confirmatory factor analy- sis using a structural equation model was performed to test the theoretical fit of the subscales of the LTS. In this study, the
maximum likelihood method was used to estimate the para- meters. The goodness-of-fit test to evaluate whether a meas- urement model is suitable for a certain dataset uses several fit indices. In this study, the x2 test (x2), degrees of freedom (df), goodness-of-fit index (GFI), root mean square error of approx- imation (RMSEA), non-normed fit index (NNFI), comparative fit index (CFI), parsimonious normed fit index (PNFI), and Q (normed x2; x2/df) were used. The internal consistency of the LTS and its subscales was assessed by Cronbach's ⍺. Differ- ences in the life transition process according to the socio-dem- ographic characteristics of the children and parents were ana- lyzed using the t-test and one-way analysis of variance with the Scheffé post hoc test for group comparisons. The collected data were analyzed using SPSS for Windows version 22.0 and AMOS version 22.0 (IBM Corp., Armonk, NY, USA) with the level of significance set at a p-value of .050.
RESULTS
1. Participants' Socio-demographic Characteristics The participants were 114 fathers (43.8%) and 146 mothers (56.2%). The mean age of the participants was 41.9 years (SD=7.1). By age category, 106 (40.8%) were 39 years old or younger, 120 (46.1%) were 40~49 years old, and 34 (13.1%) were 50 years or older. The distribution of educational levels was fairly even, as 132 (50.8%) participants had a high school education or lower, and 128 (49.2%) had a college education or higher. More than half reported religious affiliations (56.2%) and had a job (53.1%). The household income levels among the participants were as follows: 101 (38.8%) earned 3 million Korean won per month or more, 86 (33.1%) earned be- tween 2 and 2.99 million Korean won per month, and 73 (28.1%) earned less than 2 million Korean won per month (Table 1).
The mean age of the children with a disability was 11.0 years (SD=6.5). The children consisted of 80 preschoolers (≤6 years old) (30.8%), 102 elementary school students (7~12 years old) (39.2%), 39 adolescents (13~18 years old) (15.0%), and 39 adults (≥19 years old) (15.0%). There were 159 male (61.2%) and 101 female (38.8%) children. With respect to birth order, 128 (49.2%) children were first-born, followed by 106 (40.8%) who were second-born, and 26 (10.0%) who were third- or lat- er-born. Approximately half (48.8%) of the children had in- tellectual disabilities, followed by 86 (33.1%) with brain dam- age, and 47 (18.1%) with visual/auditory or other disabilities.
The disability levels of the children were as follows: 159 (61.1%) in the first degree, 47 (18.1%) in the second degree, and 54 (20.8%) in the third degree or over (Table 1).
Table 1. Socio-demographic Characteristics of Children and Parents (N=260)
Variables Characteristics Categories n (%) M±SD
Children Age (year) ≤6 (preschoolers)
7~12 (elementary school children) 13~18 (adolescents)
≥19 (adults)
80 102 39 39
(30.8) (39.2) (15.0) (15.0)
11.0±6.5
Gender Male
Female
159 101
(61.2) (38.8)
Birth order First
Second Third
128 106 26
(49.2) (40.8) (10.0) Type of disability Intellectual disability
Brain damage
Visual/auditory disorder
127 86 47
(48.8) (33.1) (18.1) Level of disability First degree
Second degree
≥Third degree
159 47 54
(61.1) (18.1) (20.8)
Parents Age (year) ≤39
40~49
≥50
106 120 34
(40.8) (46.1) (13.1)
41.9±7.1
Gender Male
Female
114 146
(43.8) (56.2)
Education ≤High school
≥College
132 128
(50.8) (49.2)
Religion None
Yes
114 146
(43.8) (56.2)
Job None
Yes
122 138
(46.9) (53.1) Monthly household income
(10,000 KRW)
<200 200~299
≥300
73 86 101
(28.1) (33.1) (38.8) KRW=Korean Won.
2. Validity and Reliability Analysis
Exploratory factor analysis was performed to test whether the 24 items of the LTS developed for parents of autistic chil- dren by Lee et al. [20] could be applied to parents of children with different types of disabilities, and confirmatory factor analysis was performed to test the theoretical fit of the sub- scales of the LTS. Cronbach's ⍺ was analyzed to assess the in- ternal consistency of LTS and its subscales.
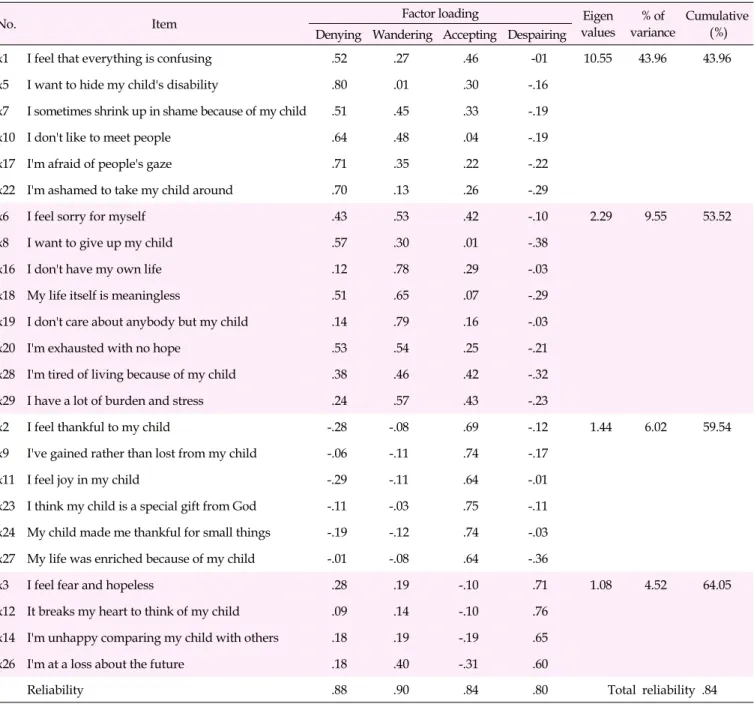
1) Exploratory factor analysis
The sample size was confirmed to be appropriate for the factor analysis because the values of the Keiser-Meyer-Olkin test and Bartlett's test for sphericity of the 24 questions were .94 and x2=3,720.57 (p<.001), respectively. Four factors were extracted by principal component analysis based on eigenval- ues greater than 1.0 and by a scree plot and were classified as
wandering (8 items), accepting (6 items), denying (6 items), and despairing (4 items). The number of items comprising each factor was 4 to 8, and the factor loading of each item was distributed between .30 and .80. Although the factor loading of the 'I want to give up my child' item was .57 in the denying phase and .30 in the wandering phase, this item was included in the wandering phase because it was classified accordingly at the time of tool development. Factor 1, the denying phase, explained 43.96% of the variance; factor 2, the wandering phase, explained 9.55%; factor 3, the accepting phase, explain- ed 6.02%; and factor 4, the despairing phase, explained 4.52%.
The cumulative proportion of variance explained was 64.05%
(Table 2).
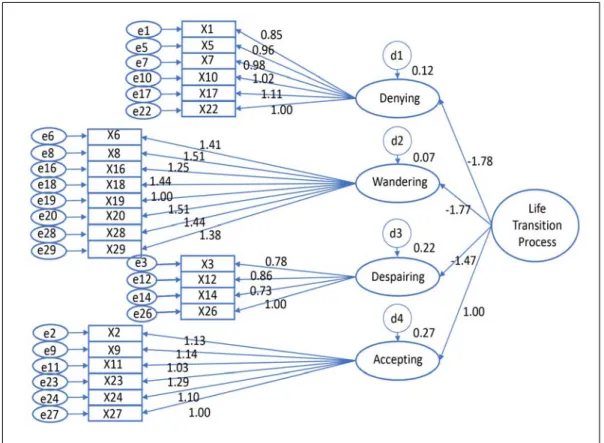
2) Confirmatory factor analysis
As a result of evaluating the model's goodness of fit for the four structures (the 24-item instrument), the absolute fit index
Table 2. Factor Analysis of Items (N=260)
No. Item Factor loading Eigen
values
% of variance
Cumulative Denying Wandering Accepting Despairing (%)
x1 I feel that everything is confusing .52 .27 .46 -01 10.55 43.96 43.96
x5 I want to hide my child's disability .80 .01 .30 -.16
x7 I sometimes shrink up in shame because of my child .51 .45 .33 -.19
x10 I don't like to meet people .64 .48 .04 -.19
x17 I'm afraid of people's gaze .71 .35 .22 -.22
x22 I'm ashamed to take my child around .70 .13 .26 -.29
x6 I feel sorry for myself .43 .53 .42 -.10 2.29 9.55 53.52
x8 I want to give up my child .57 .30 .01 -.38
x16 I don't have my own life .12 .78 .29 -.03
x18 My life itself is meaningless .51 .65 .07 -.29
x19 I don't care about anybody but my child .14 .79 .16 -.03
x20 I'm exhausted with no hope .53 .54 .25 -.21
x28 I'm tired of living because of my child .38 .46 .42 -.32
x29 I have a lot of burden and stress .24 .57 .43 -.23
x2 I feel thankful to my child -.28 -.08 .69 -.12 1.44 6.02 59.54
x9 I've gained rather than lost from my child -.06 -.11 .74 -.17
x11 I feel joy in my child -.29 -.11 .64 -.01
x23 I think my child is a special gift from God -.11 -.03 .75 -.11 x24 My child made me thankful for small things -.19 -.12 .74 -.03
x27 My life was enriched because of my child -.01 -.08 .64 -.36
x3 I feel fear and hopeless .28 .19 -.10 .71 1.08 4.52 64.05
x12 It breaks my heart to think of my child .09 .14 -.10 .76
x14 I'm unhappy comparing my child with others .18 .19 -.19 .65
x26 I'm at a loss about the future .18 .40 -.31 .60
Reliability .88 .90 .84 .80 Total reliability .84
was x2=640.0 (p<.001), GFI was .81, RMSEA was .07, NNFI was .89, CFI was .89, the PNFI was .74, and Q (x2/df) was 2.60.
Thus, the measured model was found to be appropriate (Table 3, Figure 1).
3) Reliability
The internal consistency (alpha coefficient) of the total scale was .84. The alpha coefficients were .88, .90, .80, and .84 for the denying, wandering, despairing, and accepting phases, re- spectively (Table 2).
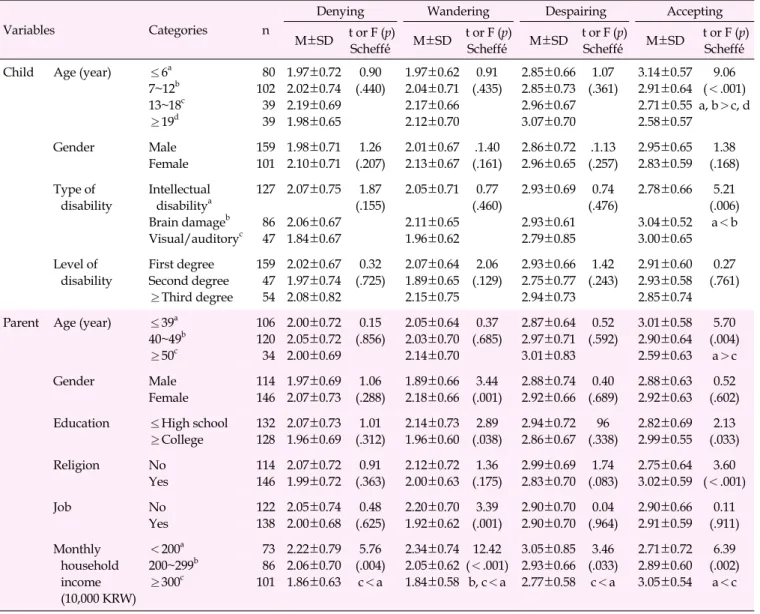
3. Differences in the Life Transition Process According to Socio-demographic Characteristics
Statistically significant differences were found among the scores for the denying phase depending on household income, but no differences were found among the groups. That is, par- ticipants with the lowest category of household income (less than 2 million Korean won per month) had a higher score for the denying phase than those with an income of 3 million Korean won per month or higher (F=5.76, p=.004).
Statistically significant differences were found in the scores
Table 3. Fitness Statistics of the Current and Original Models (N=260)
Fitness Absolute fit measure Incremental fit measure Parsimonious fit measure
x2(p) df GFI RMSEA NNFI CFI PNFI Q (χ²/df)
Criteria (≥.050) ≥.90 .05~.08 ≥.90 ≥.90 ≥.60 ≤3.00
Current measured model 640.00 (<.001) 246 .81 .07 .89 .89 .74 2.60
Original measured model 541.23 (<.001) 246 .82 .07 .89 .89 .73 2.20
dF=Degrees of freedom; GFI=Goodness-of-fit index; RMSEA=Root mean squared error of approximation; NNFI=Non-normed fit index; CFI=Comparative fit index; PNFI=Parsimony normed fit index.
Figure 1. The path diagram of the current measured model.
of the wandering phase depending on the parent's gender (t=3.44, p=.001), educational level (t=2.89, p=.038), employ- ment status (t=3.39, p=.001), and household income (F=12.42, p<.001). Mothers had higher scores than fathers (t=3.44, p=
.001). Respondents without a job, with a lower educational level, and in the lowest category of household income (less than 2 million Korean won) had a higher score in the wander- ing phase than the other respondents.
A statistically significant difference was found in the scores of the despairing phase depending on household income (F=
3.46 p=.033). Respondents with a household income in the lowest category (less than 2 million Korean won) showed higher scores of the despairing phase than those with a house- hold income in the highest category (3 million Korean won
per month or higher).
Statistically significant differences were found in the ac- cepting phase depending on the child's age (F=9.06 p<.001) and type of disability (F=5.21 p=.006); the parent's age (F=
5.70, p=.004), educational level (t=2.13, p=.033), and religion (t=3.60, p<.001); and household income (F=6.39, p=.002).
Parents who had a child who was 12 years of age or younger or with brain damage scored higher in this phase than the oth- er respondents. Respondents who were 39 years of age or younger and who had a religious affiliation, higher educa- tional level, and a household income in the highest category scored higher for the accepting phase than the other respon- dents (Table 4).
Table 4. Differences in the Life Transition Process According to the Socio-demographic Characteristics of Children and Parents (N=260)
Variables Categories n
Denying Wandering Despairing Accepting
M±SD t or F (p)
Scheffé́ M±SD t or F (p)
Scheffé́ M±SD t or F (p)
Scheffé́ M±SD t or F (p) Scheffé́
Child Age (year) ≤6a 7~12b 13~18c
≥19d
80 102 39 39
1.97±0.72 2.02±0.74 2.19±0.69 1.98±0.65
0.90 (.440)
1.97±0.62 2.04±0.71 2.17±0.66 2.12±0.70
0.91 (.435)
2.85±0.66 2.85±0.73 2.96±0.67 3.07±0.70
1.07 (.361)
3.14±0.57 2.91±0.64 2.71±0.55 2.58±0.57
9.06 (<.001) a, b>c, d
Gender Male
Female
159 101
1.98±0.71 2.10±0.71
1.26 (.207)
2.01±0.67 2.13±0.67
.1.40 (.161)
2.86±0.72 2.96±0.65
.1.13 (.257)
2.95±0.65 2.83±0.59
1.38 (.168) Type of
disability
Intellectual disabilitya Brain damageb Visual/auditoryc
127
86 47
2.07±0.75
2.06±0.67 1.84±0.67
1.87 (.155)
2.05±0.71
2.11±0.65 1.96±0.62
0.77 (.460)
2.93±0.69
2.93±0.61 2.79±0.85
0.74 (.476)
2.78±0.66
3.04±0.52 3.00±0.65
5.21 (.006)
a<b
Level of disability
First degree Second degree
≥Third degree 159 47 54
2.02±0.67 1.97±0.74 2.08±0.82
0.32 (.725)
2.07±0.64 1.89±0.65 2.15±0.75
2.06 (.129)
2.93±0.66 2.75±0.77 2.94±0.73
1.42 (.243)
2.91±0.60 2.93±0.58 2.85±0.74
0.27 (.761)
Parent Age (year) ≤39a 40~49b
≥50c
106 120 34
2.00±0.72 2.05±0.72 2.00±0.69
0.15 (.856)
2.05±0.64 2.03±0.70 2.14±0.70
0.37 (.685)
2.87±0.64 2.97±0.71 3.01±0.83
0.52 (.592)
3.01±0.58 2.90±0.64 2.59±0.63
5.70 (.004)
a>c
Gender Male
Female
114 146
1.97±0.69 2.07±0.73
1.06 (.288)
1.89±0.66 2.18±0.66
3.44 (.001)
2.88±0.74 2.92±0.66
0.40 (.689)
2.88±0.63 2.92±0.63
0.52 (.602) Education ≤High school
≥College
132 128
2.07±0.73 1.96±0.69
1.01 (.312)
2.14±0.73 1.96±0.60
2.89 (.038)
2.94±0.72 2.86±0.67
96 (.338)
2.82±0.69 2.99±0.55
2.13 (.033)
Religion No
Yes
114 146
2.07±0.72 1.99±0.72
0.91 (.363)
2.12±0.72 2.00±0.63
1.36 (.175)
2.99±0.69 2.83±0.70
1.74 (.083)
2.75±0.64 3.02±0.59
3.60 (<.001)
Job No
Yes
122 138
2.05±0.74 2.00±0.68
0.48 (.625)
2.20±0.70 1.92±0.62
3.39 (.001)
2.90±0.70 2.90±0.70
0.04 (.964)
2.90±0.66 2.91±0.59
0.11 (.911) Monthly
household income (10,000 KRW)
<200a 200~299b
≥300c
73 86 101
2.22±0.79 2.06±0.70 1.86±0.63
5.76 (.004)
c<a
2.34±0.74 2.05±0.62 1.84±0.58
12.42 (<.001)
b, c<a
3.05±0.85 2.93±0.66 2.77±0.58
3.46 (.033)
c<a
2.71±0.72 2.89±0.60 3.05±0.54
6.39 (.002)
a<c
KRW=Korean Won.
DISCUSSION
In this study, the researchers investigated whether the LTS, which was developed for parents of children with autism, is valid and reliable for the parents of children with other types of disabilities. Furthermore, the differences and character- istics of each phase of the life transition process according to the demographic characteristics of the study participants were examined.
The results indicated that it is feasible to use the LTS to as- sess the life transition process of parents of children with other types of disabilities. The validity of the LTS was verified by exploratory factor analysis, with factor loading ranging from .30 to .80 [22]. The cumulative percentage of variance explained was 64.05%, higher than the 62% reported in a factor analysis
conducted among the parents of autistic children [20].
The results of the confirmatory factor analysis provided further support for good model fit, as the model fit indices were similar to those from parents of children with autism.
Four factors emerged, which were labeled as the wandering phase (8 items), accepting phase (6 items), denying phase (6 items), and despairing phase (4 items).
The reliability of the internal consistency of the entire LTS was .84, which is higher than the internal consistency of .81 re- ported in a past study conducted on the parents of children with autism [23]. Each factor attained a high reliability: .88 for the denying phase, .90 for the wandering phase, .80 for the de- spairing phase, and .84 for the accepting phase. Thus, the the- oretical fit and the reliability of the LTS developed for parents of autistic children were applicable to evaluating the tran-
sition process of the lives of parents of children with various types of disabilities in addition to autism spectrum disorder.
No significant differences were found in the life transition process of parents of children with a disability according to their socio-demographic characteristics. The transition proc- ess experienced by the parents of children with other types of disabilities (intellectual disability, brain damage, and visual/
auditory disorders) showed no differences during the deny- ing, wandering, and despairing phases in relation to the dis- ability type, disability rating, or their age and gender. Al- though it was expected that the distress experienced by pa- rents would be different because the behavioral patterns of children with disabilities vary widely, the results of this study suggest that parents are traumatized and experience pain on- ly because of the fact that their children are disabled, regard- less of the type or level of disability.
However, the score of the accepting phase for parents of children with brain damage was significantly higher than that of parents of children with intellectual disabilities. This dis- parity is assumed to be caused by differences in communica- tion skills or behavior between children with brain damage and those with intellectual disabilities, but further study is needed because no prior studies have investigated these dif- ferences. Lee and Hong's study [23] challenged the assump- tion of a prior study that parents of adults with disabilities would accept and appreciate their adult children's disabilities positively because there were no differences in their scores for the accepting phase, which depended on the age of the child and that of the parent. Lee and Hong [23] explained that the patterns of pain experienced by parents in the course of an au- tistic child's growth into an adult are constantly changing, es- pecially as parents themselves grow older and more subject to anxiety and despair about the future of their children with disabilities.
In this study, however, the score of the accepting phase of the parents of preschoolers and school-age children was sig- nificantly higher than that of parents with adolescent or adult children. Parents aged 39 years or younger reported a higher score for the accepting phase than parents aged 50 years or older, indicating that parents of adults with disabilities were not able to accept their children's disabilities. Parents of adults with disabilities are in fact likely to suffer more than parents of young children with disabilities. In a study by Shim and Nam [24], a mother who lived with her adult disabled child stated that she could not expect a normal life for her child as an adult, as her child would not be able to live independently, earn money, or get married. The mother also stated that as she grew older and became mentally and physically weaker, she had increasingly serious anxiety, concern, and fear about the possibility that she would no longer be able to take care of her
child due to aging and death. Kim, Kim, and Kim [25] re- ported that parents of children faced a heavy physical and fi- nancial burden, but as their children grew to adulthood, the physical and financial burden decreased while the emotional and social burden continued to increase, reflecting the chang- ing aspects of the parents' burden of caring for their disabled children. That is, from a life-cycle perspective, while parents who raise children with disabilities can reach the accepting phase after going through the earlier phases of shock, denying and wandering, the nature of parental distress evolves into a set of relatively intangible challenges as their children and the parents themselves grow older. As a result, addressing fami- lies with adult children with disabilities requires an approach different from that aimed at families raising young children with disabilities, and a social support system is necessary to provide continuing care even after the parents' deaths.
Meanwhile, the process of life transition of parents of chil- dren with disabilities showed differences depending on the parents' own demographic characteristics, indicating that their socioeconomic attributes were more closely related to the life transition process than their children's disability or behavior.
Lee [5] reported that maternal caring behavior for a child with a disability was most strongly affected by parenting self-es- teem, rather than by behavioral problems, socioeconomic sta- tus, perceived stigma, objective burdens, or the functional limitations caused by the child's disability. In other words, pa- rents' awareness of their own values and abilities is a process of controlling or striving for certain situations. Thus, in order to promote maternal caring behavior and the health of dis- abled children, the primary focus should be on mothers' pa- renting self-esteem.
In this study, no significant differences were found accord- ing to the gender of the parents in the denying, despairing, and accepting scores, but the mothers' wandering phase scores were significantly higher than those of the fathers, and pa- rents without a job scored significantly higher in the wander- ing phase than those with a job. It should be considered that it might be difficult for mothers of children with disabilities to get a job, as they are the main caregivers of their children. In the wandering phase, parents become susceptible to emo- tional instability and lose their sense of purpose in their own lives. Instead, every effort is directed at making the disabled child normal, and as such, the wandering phase is described as the most conflicting phase for the mother of a disabled child [18]. In a study of parents of autistic children, Lee and Hong [23] reported that mothers' wandering phase scores were sig- nificantly higher than those of fathers because the role of car- ing for disabled children was largely assigned to mothers.
Nevertheless, it should not be overlooked that the parents' marriage is an important factor in raising disabled children.
As shown by Lashewicz et al. [16], fathers also can experience serious emotional crises. It was reported that 6~8% of fathers of children with intellectual disabilities had severe depres- sion, and they had higher stress than fathers of normal chil- dren [26,27]. Lee and Hong [23] also reported that the accept- ing phase scores of parents of autistic children were low. They argued that researchers should maintain interest in the ex- istence, distress, and role of fathers in the family. Integration programs of the family unit involving fathers should be devel- oped to enhance family solidarity and adaptability.
In this study, the wandering phase scores of parents with a lower level of education were higher, but the accepting phase scores were lower, and parents belonging to the lowest in- come category scored higher in the wandering, denying, and despairing phases and lower in the accepting phase than those in the highest income category. Considering that the pa- rents' level of education and financial status are negatively correlated with emotional support and child rearing [28] and that the social support or financial resources of a family has a buffer effect between children's behavioral problems and pa- rental stress [29], it is necessary to give attention and support to families with low socioeconomic status.
In particular, the degree of poverty in assets was found to be related to the life cycle of parents of children with in- tellectual disabilities, as 55% of young parents were in finan- cial poverty, and 55% of parents aged 45~54 years were re- ported to have the highest category of assets, but their finan- cial status dropped sharply as they became senior citizens [30]. Because low accepting phase scores among the parents of disabled adolescents or adults and parents over the age of 50 are also associated with financial poverty, special attention and support are needed for these parents.
Differences in the transition process of parents of children with disabilities according to their demographic character- istics were identified. It is suggested that support be provided to parents of children with various types of disabilities to overcome the phases of denying, wandering, and despairing and to reach the accepting phase. It is also suggested that sup- port programs and special nursing interventions be devel- oped for older parents of adult children.
CONCLUSION
In this study, the psychometric properties of the LTS, which was originally developed for parents of children with autism, were examined and the feasibility of using the LTS for parents of children with other types of disabilities was established.
Both exploratory and confirmatory factor analyses showed that the scale consisted of a four-factor structure with a good model fit. Reliability was also supported with a total of 24
items, and the subscales had acceptable internal consistency coefficients, as shown by Cronbach's ⍺ coefficients of .84 for the total scale and .88, .90, .80, and .84 for the denying, wan- dering, despairing, and accepting phases, respectively.
This study is significant in terms of nursing research and practice in that the LTS developed for parents of children with autism was tested for theoretical suitability and reliability. It can be used for measuring the process of life transition in pa- rents of children with a wide spectrum of disabilities.
Conflict of interest
No existing or potential conflict of interest relevant to this article was reported.
Acknowledgements
The authors are grateful to Dr. AR Lee for her assistance in data collection and invaluable comments.
REFERENCES
1. Ministry of Health and Welfare. 2017 Status of the disabled [Inter- net]. Sejong: Ministry of Health and Welfare; 2018 [cited 2018 April 28]. Available from:
http://kosis.kr/common/meta_onedepth.jsp?vwcd=MT_OTITLE
&listid=101_11761
2. Bostrὃm PK, Broberg M, Hwang P. Parents' descriptions and expe- riences of young children recently diagnosed with intellectual disability. Child: Care, Health and Development. 2010;36(1):93-100.
https://doi.org/10.1111/j.1365-2214.2009.01036.x
3. Dabrowska A, Pisula E. Parenting stress and coping styles in moth- ers and fathers of pre-school children with autism and Down synd- rome. Journal of Intellectual Disability Research. 2010;54(3):266-280.
https://doi.org/10.1111/j.1365-2788.2010.01258.x
4. Watermeyer B, McKenzie JA. Mothering of disabled children: In mourning or on March? Journal of Social Work Practice. 2014;28 (4):405-416. https://doi.org/10.1080/02650533.2014.889103 5. Lee AR. A structural model of caring behavior of mothers of dis-
abled children. Journal of Korean Academy of Nursing. 2009;39 (5):73-682. https://doi.org/10.4040/jkan.2009.39.5.673
6. Miodrag N, Burke M, Tanner-Smith E, Hodapp RM. Adverse health in parents of children with disabilities and chronic health con- ditions: A meta-analysis using the parenting stress index's health sub-domain. Journal of Intellectual Disability Research. 2015;59(3):
257-271. https://doi.org/10.1111/jir.12135
7. Norlin D, Broberg M. Parents of children with and without intel- lectual disability: Couple relationship and individual well-being.
Journal of Intellectual Disability Research. 2013;57(6):552-566.
https://doi.org/10.1111/j.1365-2788.2012.01564.x
8. Wieland N, Green S, Ellingsen R, Baker BL. Parent-child problem solving in families of children with or without intellectual disability.
Journal of Intellectual Disability Research. 2014;58(1):17-30.
https://doi.org/10.1111/jir.12009
9. Madi SM, Mandy A, Aranda K. The perception of disability among mothers living with a child with cerebral palsy in Saudi Arabia.
Global Qualitative Nursing Research. 2019;6:1-11.
https://doi.org/10.1177/2333393619844096
10. Sahu A, Bhargava R, Sagar R, Mehta M. Perception of families of children with specific learning disorder: An exploratory study.
Indian Journal of Psychological Medicine. 2018;40(5):406-413.
https://doi.org/10.4103/IJPSYM.IJPSYM_148_18
11. Ginieri-Coccossis M, Rotsika V, Skevington S, Papaevangelou S, Malliori M, Tomaras V, et al. Quality of life in newly diagnosed children with specific learning disabilities (SpLD) and differences from typically developing children: A study of child and parent reports. Child: Care, Health and Development. 2012;39(4):581-591.
https://doi.org/10.1111/j.1365-2214.2012.01369.x
12. Gnanavel S. Maternal depression and anxiety in children and ado- lescents with intellectual disability. 2019;10(4):728-730.
https://doi.org/10.1055/s-0039-3400349
13. Kim SS, Jung HJ. A study of effect that economic stress and depres- sion have on child neglect in developmental disability children's mothers: The moderating effects of social support. Journal of Emo- tional and Behavioral Disorders. 2010;26(3):257-275.
14. Svensson B, Eriksson UB, Janson S. Exploring risk for abuse of chil- dren with chronic conditions or disabilities - Parent's perceptions of stressors and the role of professionals. Child: Care, Health and Development. 2013;39(6):887-893.
https://doi.org/10.1111/cch.12030
15. Wei X, Yu JW. The concurrent and longitudinal effects of child dis- ability types and health on family experiences. Maternal and Child Health Journal. 2012;16(1):100-108.
https://doi.org/10.1007/s10995-010-0711-7
16. Lashewicz BM, Shipton L, Lien K. Meta-synthesis of fathers' expe- riences raising children on the autism spectrum. Journal of Intel- lectual Disabilities. 2019;23(1):117-131.
https://doi.org/10.1177/1744629517719347
17. McConnell D, Savage A. Stress and resilience among families caring for children with intellectual disability: Expanding the re- search agenda. Current Developmental Disorders Reports. 2015;2:
100-109. https://doi.org/10.1007/s40474-015-0040-z
18. Lee AR, Hong SW, Kim JS, Ju SJ. Life transition of mothers of chil- dren with autism. Journal of Korean Academy of Nursing. 2010;40 (6):808-819. https://doi.org/10.4040/jkan.2010.40.6.808
19. Lee AR, Hong SW, Ju SJ. Development of a scale to measure life transition process in parents of children with autism. Journal of Korean Academy of Nursing. 2012;42(6):861-869.
https://doi.org/10.4040/jkan.2012.42.6.861
20. Lee AR, Hong SW, Ju SJ. Construct validity of the life transition scale for parents of children with autism. Journal of Korean Acad- emy of Nursing. 2014;44(5):563-572.
https://doi.org/10.4040/jkan.2014.44.5.563
21. Weiss JA, Cappadocia MC, MacMullin JA, Viecili M, Lunsky Y.
The impact of child problem behaviors of children with ASD on parent mental health: The mediating role of acceptance and em- powerment. Autism. 2012;16(3):261-274.
https://doi.org/10.1177/1362361311422708
22. Kim GS. New AMOS 18.0: Structural equation modeling analysis.
Seoul: Hannarae Publishing Co.; 2010.
23. Lee AR, Hong SW. Differences in life transition process of parents caring for children with autism: Based on the socio-demographic characteristics. Child Health Nursing Research. 2015;21(4):331-338.
https://doi.org/10.4094/chnr.2015.21.4.331
24. Shim SS, Nam JH. The effects of personal and social coping re- sources of mothers on the stress of caring adult children with de- velopmental disabilities. Journal of Rehabilitation Research. 2016;
20(1):43-64. https://doi.org/10.16884/JRR.2016.20.1.43
25. Kim Y, Kim G, Kim S. A study on factors influencing the care bur- den of parents having children with developmental disabilities:
The focus on the children's life cycle. The Women's Studies. 2015;
88(1):117-164.
26. Giallo R, Seymour M, Matthews J, Gavidia-Payne S, Hudson A, Cameron C. Risk factors associated with the mental health of fa- thers of children with an intellectual disability in Australia. Jour- nal of Intellectual Disability Research. 2015;59(3):193-207.
https://doi.org/10.1111/jir.12127
27. Dukmak S. Parent adaptation to and parenting satisfaction with children with intellectual disability in the United Arab Emirates.
Journal of Intellectual and Developmental Disability. 2009;34(4):
324-328. https://doi.org/10.3109/13668250903286190
28. Piškur B, Beurskens AJHM, Jongmans MJ, Ketelaar M, Smeets RJEM. What do parents need to enhance participation of their school-aged child with a physical disability? A cross-sectional study in the Netherlands. Child: Care, Health and Development. 2015;41 (1):84-92. https://doi.org/10.1111/cch.12145
29. Minnes P, Perry A, Weiss JA. Predictors of distress and well-being in parents of young children with developmental delays and dis- abilities: The importance of parent perception. Journal of Intellec- tual Disability Research. 2015;59(6):551-560.
https://doi.org/10.1111/jir.12160
30. Parish SL, Rose RA, Swaine JG. Financial well-being of US parents caring for coresident children and adults with developmental dis- abilities: An age cohort analysis. Journal of Intellectual and Deve- lopmental Disabilities. 2010;35(4):235-243.
https://doi.org/10.3109/13668250.2010.519331