한국의류산업학회지 pISSN 1229-2060
제22권 제2호, 2020 eISSN 2287-5743
<연구논문> Fashion & Text. Res. J.
Vol. 22, No. 2, pp.209-221(2020) https://doi.org/10.5805/SFTI.2020.22.2.209
209
Acceptance of Smart Clothing Based on Outdoor Consumption Behavior
Hakyung Cho
1)and Ho-sun Lim
†1)
Dept. of R&D, Blackyak. Co. Ltd.; Seoul, Korea
Dept. of Clothing & Textiles, Sookmyung Women’s University; Seoul, Korea
Abstract: Recently, following the commercialization and market entry of smart clothes with diverse functions, smart clothes have been changing from technology-centered products to user-centered products. However, the analysis of consumer demand centered on actual commercialized products is lacking. Therefore, this study classified commercialized smart clothes by func- tion and analyzed the demand and requirements of smart clothes according to sports/outdoor clothes consumption behaviors.
As a result, consumers were classified according to their sports/outdoor clothes consumption behaviors into an outdoor leading group with high consumption propensity, an outdoor pursuit group with medium consumption propensity, and an outdoor fol- lowing group with low consumption propensity. Among the commercialized smart clothes, those with a heartbeat measuring function, those with a heating function, and those with a light-emitting function were presented and demand analysis was con- ducted. According to the results, the outdoor leading group and the outdoor pursuit group had higher levels of awareness, pref- erence, and purchase intentions than the outdoor following group. In addition, the outdoor leading group showed the highest level of purchase price acceptance while the outdoor following group showed the lowest level of purchase price acceptance.
However, this study has a limitation that the acceptance for smart clothes were analyzed with consumers who had experience in sports outdoor clothes consumption. Therefore, in future, studies will be conducted with a wide range of consumers.
Key words: sports/outdoor clothes, consumption behavior, smart clothes, demand, price acceptance
1. Introduction
Following the recent miniaturization and weight lightening of hardware and the expansion of Internet of Things(IoT) services, the wearable device market has been growing rapidly(Lee & Pan, 2017). This trend is affecting the smart clothes market, which is one of the fields of wearable devices, leading to market expansion through smart clothes products with diverse functions such as bio signal monitoring clothes, heating clothes, and leisure safety clothes (Kang & Lee, 2017; Lee et al., 2017). As such, smart clothes tech- nology development is shifting from the existing product devel- oper-oriented technology development to user-oriented commer- cialization R&D(Jung et al., 2017; Kim et al., 2016; Lee, 2014).
Studies on consumer demand for smart clothes have been con- tinuously conducted since the mid-2000s when studies on smart clothes began in earnest under diverse themes. Following the com- mercialization of smart clothes, studies that analyzed and presented consumer demand have been continuously conducted such as the analysis of the awareness and acceptability of smart clothes prod-
ucts(Choi & Lee, 2006; Hwang & Lee, 2006; Jung et al., 2017), lifestyle and trend based demand analysis for the planning and development of smart clothes(Chen et al., 2017; Cho et al., 2010;
Cho et al., 2014; Ju & Hu, 2017; Jung et al., 2017), usability eval- uation, analysis of smart clothes consumer attitudes and acceptance according to consumer innovativeness(Chae et al., 2009; Kang &
Jin, 2007; Noh & Park, 2011; Park & Noh, 2012; Sung & Sung, 2015), and analysis of elements for application of user centered devices and applications(Choi & Lee, 2009; Lee & Pan, 2017).
However, existing studies have limitations in the analysis of demands by age group because they were conducted with mainly persons in their 20-30s who are expected to have high levels of accessibility to and understanding of smart devices, and studies for empirical demand analysis based on commercialized smart clothes are lacking.
Therefore, in this study, the age range of analysis was expanded to twenties-sixties to analyze the demand and price acceptance for smart clothing according to the smart clothing consumption behav- iors by age group with a view to presenting basic data for planning of smart clothing through segmentalized demand forecasting of smart clothing.
2. Study method
2.1. Classification of commercialized smart clothes In this study, to analyze demands for commercialized smart
†Corresponding author; Ho-sun Lim Tel. +82-2-2077-7121, Fax. +82-2-2077-7324 E-mail: [email protected]
©
2020 (by) the authors. This article is an open access article distributed
under the terms and conditions of the Creative Commons Attribution
license (http://creativecommons.org/licenses/by/3.0/), which permits unre-
stricted use, distribution, and reproduction in any medium, provided the
original work is properly cited.
clothes by function, smart clothes were clustered into groups in similar price ranges centering on their functions. The outcomes were used in consumer demand analysis as data presented to ana- lyze consumer demands by function and by price range. The applied smart clothing was determined by searching commercial- ized smart clothing based on the Internet and research papers. As a result of the search, bio signal measuring clothes based on heart rate and electrocardiogram measurement functions, leisure clothes for night safety using optical fibers and LEDs, heating clothes applied with a heating function to adjust temperature, NFC, gesture communication clothes were found.
A total of four types of heating functional clothes were found, which are Colmar Co.’s Graphene Plus (G+), RAAVEAN’s Heated Down Jacket, GERBING’s Heating Jacket, and AiQ’s Heating jacket. Nine types of bio-signal measuring clothes were found, which are OMsignal’s Ombra, Maxim’s Fit Shirt, Ralph Lauren’s Polotech Shirt, Hexoskin’s Biometric shirts, and Gymi’s smart shirts & smart pants, Sensecore’s smart sports clothing that have heart measuring functions, and Myontec’s Mbody, Athos’ Athos gear, Far East New Century Corp’s DynaFeed, NTT Docomo’s Hitoe, and AiQ’s Lighting jacket based on EMG measurements.
Six types of light-emitting clothes were found, which are Marmot’s Phenomenon EL, Visijax’s SMART LED jacket, Lumo’s har- rington jacket, O'Neill’s Nav Jacket, Nite Ize’s LED Sport Vest, Utope’s Sporty Supaheroe Jacket, METIER’s Metier Beacon Men’s Jacket, PROVIZ’s Nightrider LED Women’s Cycling Jacket. Other clothing products found were three types, which are Samsung NFC suit, Google x Levi’s Project Jacquard, and LIVE DEMO’s midi controller jacket. For consumer demand analysis, products that were currently on the market among the above listed products were grouped into products with similar functions and
prices, and the functions and prices of the products were presented.
2.1.1. Smart clothes with heartbeat and momentum measuring functions
The bio-signal measuring clothes presented were composed of MyZone series(MyZone, USA) with heartbeat and momentum measuring functions as their main functions and OMBra(Omsignl, Canada) with heartbeat, breathing, and momentum measuring functions using film type piezoelectric electrodes from DuPont (Table 1).
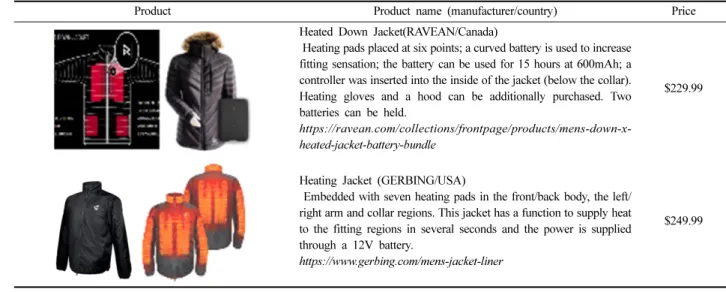
2.1.2. Smart clothes with a heating function
Heated clothes with a thermal function presented were com- posed of a heated down jacket(Ravean, Canada) applied with heat- ing pads placed at six points and a curved battery to increase fitting sensation, and a heated jacket(GERBING, USA) embedded with seven heating pads in the back and chest areas and a 12V battery for power supply.
2.1.3. Smart clothes with a light-emitting function
Leisure clothes with a night safety light-emitting function pre- sented were composed of a Nightrider LED Women’s Cycling Jacket(PROVIZ, England) with LED bands attached to the sleeve regions and the bottom region to secure the visibility of the rider and a Women’s Beacon Jacket(Metier, England) with LED strips attached to the front shoulder region and the back bottom region to secure night visibility.
2.2. Composition of the questionnaire
The questionnaire was composed of a total of 30 questions. To analyze demands for smart clothing by function according to sports
Table 1. Smart clothes with a heartbeat measuring function
Product Product name (manufacturer/country) Price
MyZone series (MyZone/USA)
Sports Bra/T-shirt can be worn in diverse forms. Heartbeats can be inferred by measuring blood flow changes through wearable optical blood flow measuring device (LED and photodetector)
https://buy.myzone.org/product/?code=SPORTS-BRA
$199
OMBra (Omsignal/Canada)
The product line is being expanded according to lifestyles, and heartbeats can be measured using DuPont's film type electrodes. It is thin, comfortable to wear and washable.
https://omsignal.com/collection https://www.dezeen.com/
$169
and outdoor clothing consumption behaviors, questions were extracted from questions used in previous studies(Cho et al., 2010;
Choi & Lee, 2006; Kang, 2015; Lee, 2015) and the questions were modified to fit the content of this study in order to compose ques- tions in this study. Four questions related to sports and outdoor clothing consumption were composed, and seven questions related to the awareness and value of and demand for smart clothing were composed for the evaluation of demand for general smart clothing.
Fifteen questions regarding the awareness of, purchase intention and acceptable prices for the smart clothes with heart rate mea- surement, heating, or light-emitting functions classified earlier were composed for the evaluation of demands for smart clothes by function, and four demographic questions were composed.
Twelve questions related to demand for smart clothing were applied to five-point Likert scale and seventeen questions including demographic characteristics were applied to nominal scale. One
Table 2. Smart clothes with a heating functionProduct Product name (manufacturer/country) Price
Heated Down Jacket(RAVEAN/Canada)
Heating pads placed at six points; a curved battery is used to increase fitting sensation; the battery can be used for 15 hours at 600mAh; a controller was inserted into the inside of the jacket (below the collar).
Heating gloves and a hood can be additionally purchased. Two batteries can be held.
https://ravean.com/collections/frontpage/products/mens-down-x- heated-jacket-battery-bundle
$229.99
Heating Jacket (GERBING/USA)
Embedded with seven heating pads in the front/back body, the left/
right arm and collar regions. This jacket has a function to supply heat to the fitting regions in several seconds and the power is supplied through a 12V battery.
https://www.gerbing.com/mens-jacket-liner
$249.99
Table 3. Smart clothes with a light-emitting function
Product Product name (manufacturer/country) Price
Nightrider LED Women's Cycling Jacket (PROVIZ/UK)
LEDs are built into the rear arm and back to increase visibility during cycle riding. The function is realized by supplying power through a rechargeable battery.
https://www.provizsports.com/en-gb/
$239.49
Metier Beacon Men's Jacket(METIER/UK)
LEDs are built into the shoulder and waist to ensure visibility in the dark.
The function is realized by supplying power through a rechargeable battery.
https://www.condorcycles.com/products/metier-beacon-men-s-rain-cape
$242.20
Table 4. Composition of the questionnaire
Category Items Number of questions
Sports/ outdoor clothes consumption behavior Sports/ outdoor clothes consumption 4 questions General smart clothes demand evaluation Smart clothes awareness and value evaluation 4 questions
Smart clothes demand 3 questions
Evaluation of demands for smart clothes by function Demand for clothes with heartbeat measuring function 5 questions Demand for clothes with heating function 5 questions Demand for clothes with light-emitting function 5 questions
Demographic questions Demographic characteristics 4 questions
Total 30 questions
question on the function of pursuing smart clothing was applied to a subjective way.
In order to evaluate demands for smart clothes by function, a stimulant consisting of photos of commercialized smart clothes and descriptions of major functions and prices was presented so that the respondents could respond to the questionnaire after understanding the grouped smart clothes.
2.3. Survey subjects and data analysis
In order to analyze demands for smart clothes by function according to sports/outdoor clothes consumption behaviors, a total of 1,000 questionnaire sheets were distributed from November 1 to December 20, 2017, and the sports/outdoor clothes consumption behaviors of 646 subjects who had purchased sports/outdoor clothes within one year were analyzed thereby analyzing demands for smart clothes according to functions by group. To that end, K- means cluster analysis was conducted for group clustering through the application of the statistical program SPSS 20.0, and crossover analysis and ANOVAs were carried out for demand analysis. Sub- jective answers were analyzed after grouping through lexical- semantic organization.
3. Result and discussion
3.1. Group classification according to sports/outdoor clothes consumption behaviors
3.1.1. Cluster classification according to consumption behaviors Reference values of the results of questions regarding whether sports/outdoor clothes were purchased, the number of suits pur- chased, clothes purchase frequency, and clothes purchase amount were obtained through data standardization processes and K-means cluster analysis was conducted. As a result, the respondents were classified into three groups; group 1 with 245 respondents, group 2 with 262 respondents, group 3 with 139 respondents. The group classification was shown to be statistically significant.
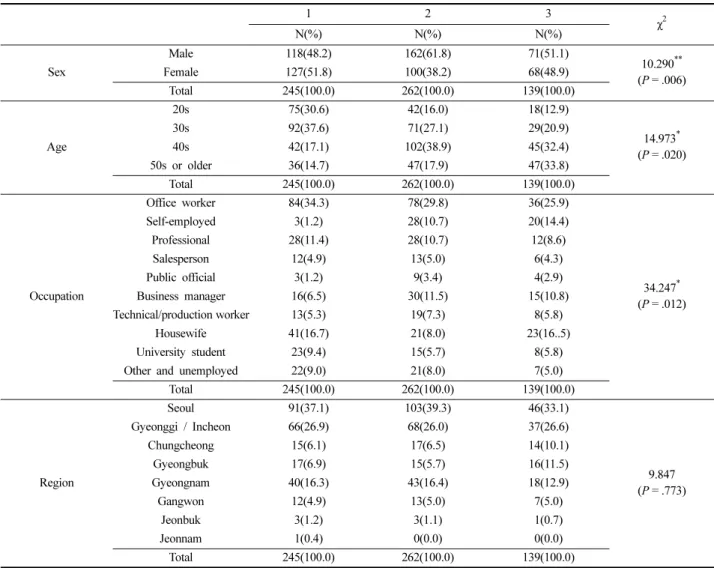
3.1.2. Analysis of demographic characteristics by cluster accord- ing to outdoor clothes consumption behaviors
Among the demographic characteristics of group 1, as for the sex ratio of males and females, the numbers of males and females
were shown to be similar, as for the ages, the number of respon- dents in their 20~30s was shown to be larger compared to other age groups, and as for the occupations, the distributions of office work- ers and university students were shown to be higher. As for the characteristics of outdoor behaviors, the number of outdoor clothes in possession was shown to be 3~5 clothes, the purchase frequency was shown to be one time per year or lower, and the purchase amount per time was shown to be about 200,000~less than 300,000 won. Therefore, group 1 was named ‘outdoor following group’.
Among the demographic characteristics of group 2, as for the sex ratio of males and females, the number of males was shown to be larger than that of females, as for the ages, the number of respondents in their 30~40s was shown to be larger compared to other age groups, and as for the occupations, the ratios of business managers and technical/production workers were shown to be higher compared to other groups. The number of outdoor clothes in possession was shown to be 6?9 clothes, the purchase frequency was shown to be about one time per six months, and the purchase amount per time was shown to be about 300,000~less than 400,000 won. Therefore, group 2 was named ‘outdoor pursuit group’.
Among the demographic characteristics of group 3, as for the sex ratio of males and females, the numbers of males and females were shown to be similar, as for the ages, the number of respon- dents in their 40s or older was shown to be larger compared to other age groups. As for the characteristics of outdoor behaviors, the number of outdoor clothes in possession was shown to be at least 10 clothes, the purchase frequency was shown to be at least one time per three months, and the purchase amount per time was shown to be about 1 million~less than 2 million won. Therefore, group 3 was named ‘outdoor leading group’.
3.2. Evaluation of demand for general smart clothes 3.2.1. Evaluation of awareness and value of smart clothes 1) Awareness of smart clothes
Whether smart clothes are recognized by group was analyzed and the results indicated that the level of awareness was higher in the outdoor pursuit and leading groups compared to the outdoor following group. The levels of awareness were shown to be rel- atively higher among male and respondents with high outdoor pur- chase frequencies and purchase amounts and were shown to be low
Table 5. Cluster classification according to outdoor clothes consumption behaviorsItem Group classification
F p
1 2 3
Number of outdoor clothes −.80970 −.23625 1.01596 317.309*** .000
Purchase frequency of outdoor clothes .68863 .84251 1.75618 435.935*** .000
Purchase amount of outdoor clothes −.50133 −.36311 1.56806 679.764*** .000
***
p<.001
among females, respondents in their 20s, and those who did not purchase any outdoor clothes within the last one year.
2) Perception of smart clothes
The images of smart clothes perceived by consumers were not different among the groups, and it shown that smart clothes were perceived as ‘having been grafted with high technologies, equipped with digital sensors, IT convergence, and interlocked with smart- phone application, etc.’. The tendency to perceive the images of smart clothes as clothes embedded with the functionality connected with IT technologies such as ‘grafting of high technologies/digital sensors/IT technologies was shown to be prominent.
3) Necessity of smart clothes
With regard to the necessity of smart clothes, the outdoor leading group and the pursuit group were shown to recognize the necessity of smart as higher compared to the outdoor following group. That is, the necessity of smart clothes was recognized as higher among
respondents in their 40s or over 50s compared to those in their 20s or 30s. This result was found to be similar to that of previous stud- ies(Hwang & Lee, 2006; Kang, 2009) in which those who were not familiar to smart technologies evaluated the innovativeness of smart clothes more highly.
4) Value of smart clothes
Analyses were conducted to evaluate the value of smart clothes and according to the results, the outdoor leading group and the out- door pursuit group showed higher tendencies to perceive that IT functions enhanced the value of clothes compared to the outdoor following group.
Among the reasons why the respondents perceived that IT func- tions would enhance the value of clothes, ‘make life more conve- nient’ was the most frequent followed by ‘enhance functionality’
and ‘contribute to health management’ in order of precedence and among the reasons why the respondents perceived that IT functions had nothing to do with the value of clothes, ‘prices are high’ was
Table 6. Crossover analysis of outdoor clothes consumption behaviors by group1 2 3
χ2
N(%) N(%) N(%)
Number of suits of outdoor clothes
At least 10 0(0.0) 56(21.4) 79(58.8)
392.874***
(P = .000)
6~9 9(3.7) 111(42.4) 37(26.6)
3~5 140(57.1) 91(34.7) 20(14.4)
1~2 96(39.2) 4(1.5) 3(2.2)
Total 245(100.0) 262(100.0) 139(100.0)
Purchase frequency of outdoor clothes
At least once per three months 0(0.0) 0(0.0) 75(54.0)
465.994***
(P = .000)
About once per six months 19(7.8) 159(60.7) 55(39.6)
About once per year 143(58.4) 63(24.0) 7(5.0)
About once per 2~3 years 76(31.0) 40(15.3) 2(1.4)
Less frequently 7(2.9) 0(0.0) 0(0.0)
Total 245(100.0) 262(100.0) 139(100.0)
Purchase amount of outdoor clothes
Less than 100,000 won 15(6.1) 5(1.9) 0(0.0)
572.242***
(P = .000)
100,000~less than 200,000 won 57(23.3) 37(14.1) 0(0.0)
200,000~less than 300,000 won 63(25.7) 63(24.0) 0(0.0)
300,000~less than 400,000 won 48(19.6) 73(27.9) 0(0.0)
400,000~less than 500,000 won 30(12.2) 38(14.5) 0(0.0)
500,000~less than 600,000 won 22(9.0) 43(16.4) 8(5.8)
600,000~less than 700,000 won 6(2.4) 3(1.1) 21(15.1)
700,000~less than 800,000 won 3(1.2) 0(0.0) 22(15.8)
800,000~less than 900,00 won 0(0.0) 0(0.0) 26(18.7)
900,000~less than 1 million won 0(0.0) 0(0.0) 13(9.4)
1 million~less than 2 million won 1(.04) 0(0.0) 38(27.3)
Over 2 million won 0(0.0) 0(0.0) 11(7.9)
Total 245(100.0) 262(100.0) 139(100.0)
***
p < .001
the most frequent followed by ‘the functions are not necessary’ and
‘the necessity may vary among consumers’ in order of precedence.
In addition, in the case of respondents in over 50s, those with higher outdoor purchase frequencies and purchase amounts were shown to be more likely to perceive that IT functions would enhance the value of clothes.
3.2.2. Evaluation of demand for smart clothes 1) Types of clothes for applying smart functions
Crossover analyses of the best suited clothes for smart clothes were conducted and the results showed no differences among the
groups. Sports/outdoor clothes were found to suit best for smart clothes followed by casual clothes, suits, and golf clothes in order of precedence.
2) Purchase intentions according to smart functions
Purchase intentions according to smart functions were analyzed, and the results indicated that when desired smart functions were added, purchase intentions increased more in the outdoor leading group and the outdoor pursuit group compared to the outdoor fol- lowing group.
Table 7. Demographic characteristics of survey subjects
1 2 3
χ2
N(%) N(%) N(%)
Sex
Male 118(48.2) 162(61.8) 71(51.1)
10.290**
(P = .006)
Female 127(51.8) 100(38.2) 68(48.9)
Total 245(100.0) 262(100.0) 139(100.0)
Age
20s 75(30.6) 42(16.0) 18(12.9)
14.973* (P = .020)
30s 92(37.6) 71(27.1) 29(20.9)
40s 42(17.1) 102(38.9) 45(32.4)
50s or older 36(14.7) 47(17.9) 47(33.8)
Total 245(100.0) 262(100.0) 139(100.0)
Occupation
Office worker 84(34.3) 78(29.8) 36(25.9)
34.247* (P = .012)
Self-employed 3(1.2) 28(10.7) 20(14.4)
Professional 28(11.4) 28(10.7) 12(8.6)
Salesperson 12(4.9) 13(5.0) 6(4.3)
Public official 3(1.2) 9(3.4) 4(2.9)
Business manager 16(6.5) 30(11.5) 15(10.8)
Technical/production worker 13(5.3) 19(7.3) 8(5.8)
Housewife 41(16.7) 21(8.0) 23(16..5)
University student 23(9.4) 15(5.7) 8(5.8)
Other and unemployed 22(9.0) 21(8.0) 7(5.0)
Total 245(100.0) 262(100.0) 139(100.0)
Region
Seoul 91(37.1) 103(39.3) 46(33.1)
9.847 (P = .773)
Gyeonggi / Incheon 66(26.9) 68(26.0) 37(26.6)
Chungcheong 15(6.1) 17(6.5) 14(10.1)
Gyeongbuk 17(6.9) 15(5.7) 16(11.5)
Gyeongnam 40(16.3) 43(16.4) 18(12.9)
Gangwon 12(4.9) 13(5.0) 7(5.0)
Jeonbuk 3(1.2) 3(1.1) 1(0.7)
Jeonnam 1(0.4) 0(0.0) 0(0.0)
Total 245(100.0) 262(100.0) 139(100.0)
*
p < .05,
**p < .01
Table 8. Awareness of smart clothes
Item Outdoor following group Outdoor pursuit group Outdoor leading group
F p Post-hoc
Mean ± SD Mean ± SD Mean ± SD
Awareness of smart clothes 2.25 ± .68 2.45 ± .69 2.54 ± .72 7.738* .030 a < b, c
*
p < .05
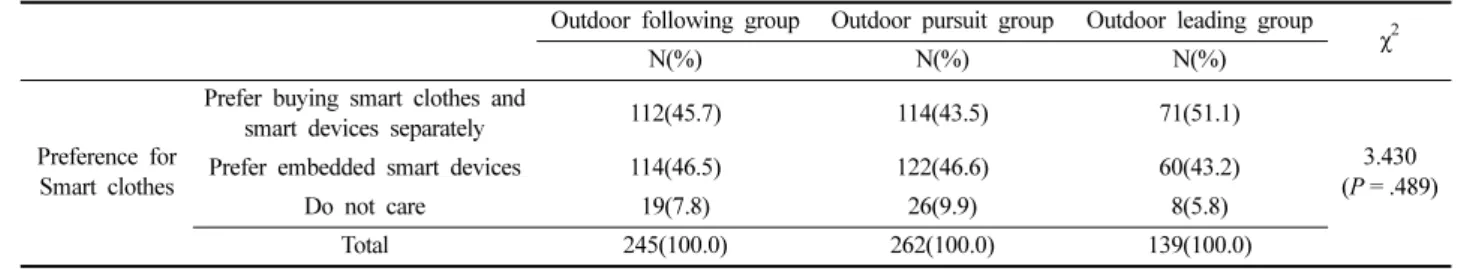
3) Preferences for the forms of sales of smart clothes and smart devices
The forms of sales of smart clothes and smart devices were ana- lyzed and according to the results, the preferences for ‘selling smart clothes and smart devices separately’ and ‘selling smart clothes embedded with smart devices’ were similar and there was no dif- ference among the groups.
3.3. Evaluation of demands for smart clothes by function 3.3.1. Evaluation of demands for heartbeat measuring clothes 1) Awareness of heartbeat measuring clothes
Whether the respondents were aware of heartbeat measuring
clothes was analyzed and according to the results, 18.2%(n = 118) of all respondents were aware of heartbeat measuring clothes and there was no significant difference among the groups.
2) Preference for heartbeat measuring clothes
Heartbeat measuring clothes were presented and the preference was evaluated and according to the results, all groups showed pos- itive evaluations of at least ‘moderate’. The outdoor pursuit group and the outdoor leading group were shown to have higher pref- erence for heartbeat measuring clothes compared to the outdoor following group.
Table 9. Perception of smart clothes’ functions
Outdoor following group
Outdoor pursuit group
Outdoor leading
group Total
χ2
N(%) N(%) N(%) N(%)
Technologies grafting image
related
Grafted with high technologies 35(14.3) 39(14.9) 23(16.5) 97(15.0)
6.247 (P = .812)
Equipped with digital sensor 32(13.1) 33(12.6) 20(14.4) 85(13.2)
Grafted with IT technology 29(11.8) 34(13.0) 16(11.5) 79(12.2)
Interlocked with smart phone application 27(11.0) 32(12.2) 16(11.5) 75(11.6)
Grafted with smart devices 24(9.8) 24(9.2) 10(7.2) 58(9.0)
Interlocked with electronic equipment 21(8.6) 20(7.6) 9(6.5) 50(7.7)
Wearable 18(7.3) 22(8.4) 16(11.5) 56(8.7)
For convenience of life 16(6.5) 18(6.9) 13(9.4) 47(7.3)
Diverse functions 14(5.7) 11(4.2) 2(1.4) 27(4.2)
Other 29(11.8) 29(11.1) 14(10.1) 72(11.1)
Total 245(82.4) 262(84.7) 139(88.5) 646(100.0)
Table 10. Necessity of smart clothes
Item Outdoor following group Outdoor pursuit group Outdoor leading group
F p Post-hoc
Mean ± SD Mean ± SD Mean ± SD
Necessity of smart clothes 3.37 ± .86 3.55 ± .86 3.67 ± .93 8.764** .004 a < b, c
**
p < .01
Table 11. Value of smart clothes
Item Outdoor following group Outdoor pursuit group Outdoor leading group
F p Post-hoc
Mean ± SD Mean ± SD Mean ± SD
Value of smart clothes 3.25 ± .61 3.77 ± .60 3.98 ± .42 28.337* .018 a < b, c
*
p < .05
Table 12. Clothes applied with smart functions
Outdoor following group Outdoor pursuit group Outdoor leading group
χ2
N(%) N(%) N(%)
Clothes applied with smart functions
Casual clothes 20(8.2) 19(7.3) 7(5.0)
10.556 (P = .658)
Suit 11(4.5) 14(5.3) 12(8.6)
Golf clothes 16(6.5) 17(6.5) 4(2.9)
Sports/outdoor clothes 198(80.8) 211(80.5) 114(82.0)
Other 0(0.0) 1(0.4) 2(1.4)
Total 245(100.0) 262(100.0) 139(100.0)
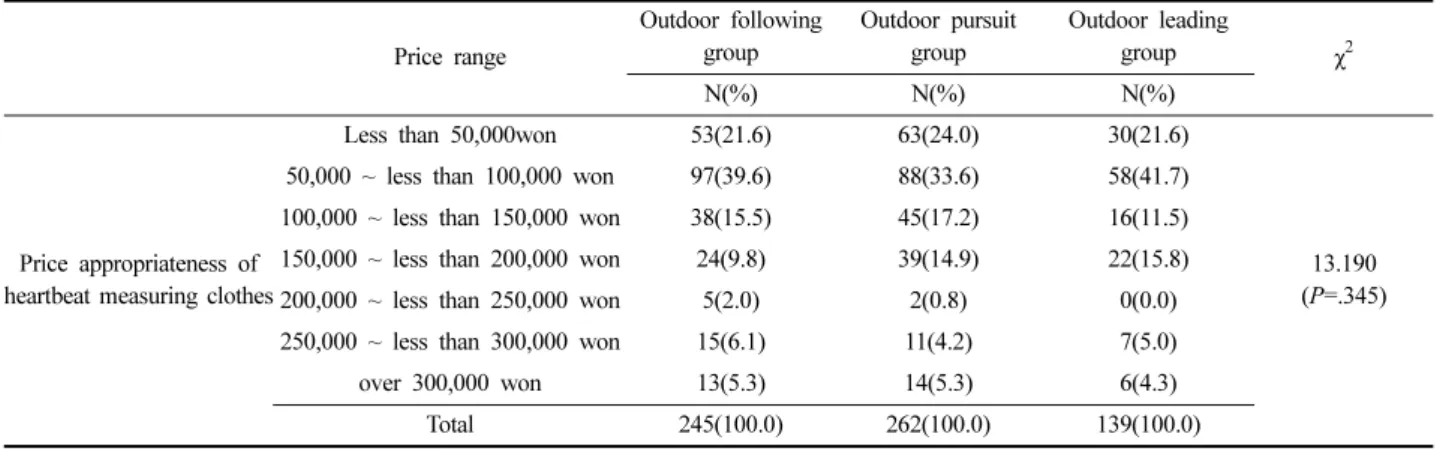
3) Purchase intentions and price appropriateness of heartbeat measuring clothes
The outdoor pursuit group and the outdoor leading group were shown to have stronger purchase intentions compared to the out- door following group through analysis. After the prices of heartbeat measuring clothes were presented, the outdoor leading group was shown to have the strongest purchase intention followed by the out- door pursuit group and the outdoor following group, in order of precedence in an analysis. All the three groups were shown to have weaker purchase intentions after he prices of heartbeat measuring clothes were presented compared to before the prices were pre-
sented through the analysis indicating that the prices of heartbeat measuring clothes were set to be higher compared to consumer demands.
In the evaluation of appropriate prices of heartbeat measuring smart clothes, no differences appeared among the groups and it was shown that prices in a range of 50,000~less than 100,000 won were thought to be the most appropriate.
3.3.2. Evaluation of demand for heated clothes 1) Awareness of heated clothes
As for the awareness of smart clothes with a heating function, it
Table 13. Purchase intentions according to smart functionsItem Outdoor following group Outdoor pursuit group Outdoor leading group
F p Post-hoc
Mean ± SD Mean ± SD Mean ± SD
Purchase intentions when
desired functions were added 3.26 ± .63 3.60 ± .64 3.67 ± .64 20.993** .002 a < b, c
**
p<.01
Table 14. Preferences for the forms of sales of smart clothes and smart devices
Outdoor following group Outdoor pursuit group Outdoor leading group χ2
N(%) N(%) N(%)
Preference for Smart clothes
Prefer buying smart clothes and
smart devices separately 112(45.7) 114(43.5) 71(51.1)
3.430 (P = .489)
Prefer embedded smart devices 114(46.5) 122(46.6) 60(43.2)
Do not care 19(7.8) 26(9.9) 8(5.8)
Total 245(100.0) 262(100.0) 139(100.0)
Table 15. Evaluation of the awareness of heartbeat measuring clothes
Outdoor following group Outdoor pursuit group Outdoor leading group
χ2
N(%) N(%) N(%)
Awareness of heartbeat measuring clothes
Originally knew 36(14.7) 58(22.1) 24(17.3)
4.817 (P = .090)
Became to know now 209(85.3) 204(77.9) 115(82.7)
Total 245(100.0) 262(100.0) 139(100.0)
Table 16. Evaluation of preference for heartbeat measuring clothes
Item Outdoor following group Outdoor pursuit group Outdoor leading group
F p Post-hoc
Mean ± SD Mean ± SD Mean ± SD
Evaluation of preference for
heartbeat measuring clothes 3.66 ± .80 3.90 ± .79 3.89 ± .89 8.224** .002 a < b, c
**
p < .01
Table 17. Purchase intention of heartbeat measuring clothes
Item Outdoor following group Outdoor pursuit group Outdoor leading group
F p Post-hoc
Mean ± SD Mean ± SD Mean ± SD
Purchase intention of heartbeat
measuring clothes 2.91 ± .68 3.22 ± .63 3.34 ± .71 19.599** .005 a < b, c
Purchase intention at the current
price purchase 2.67 ± 1.09 2.97 ± 1.11 3.28 ± 1.24 33.183*** .000 a < b < c
**
p < .01,
***p < .001
was shown that 236(36.5%) out of the entire 646 respondents were aware of smart clothes with a heating function. The outdoor leading group was found to have the highest level of awareness followed by the outdoor pursuit group and the outdoor following group in order of precedence.
2) Preference for heated clothes
The outdoor pursuit group and the outdoor leading group showed higher preference for smart clothes with a heating function com- pared to the outdoor following group. Among the presented smart clothes with heartbeat measuring, heating, and light-emitting func- tions, those with a heating function showed the highest preference.
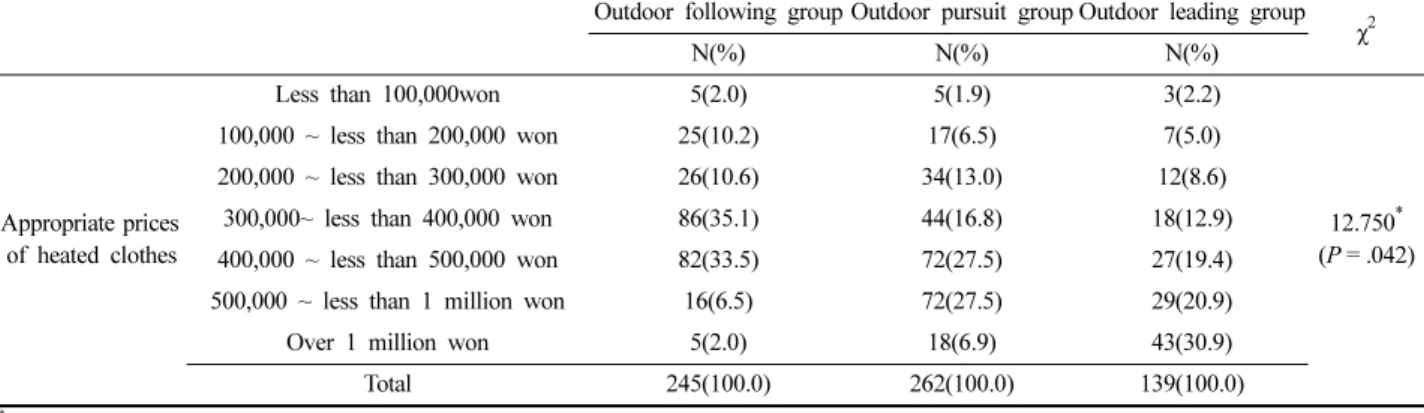
3) Purchase intentions and price appropriateness of heated clothes
As for purchase intentions for smart clothes with a heating func- tion, all respondents were shown to have at least ‘moderate’ pur- chase intentions and the outdoor pursuit group, and the outdoor leading group were shown to have stronger purchase intentions compared to the outdoor following group. When the current prices of heating clothes were presented and purchase intentions were evaluated thereafter, the outdoor pursuit group and the outdoor leading group showed stronger purchase intentions and the pur- chase intentions increased after the prices were presented.
As for the appropriate prices of heated clothes, responses indi- Table 18. Price appropriateness of heartbeat measuring clothes
Price range
Outdoor following group
Outdoor pursuit group
Outdoor leading
group χ2
N(%) N(%) N(%)
Price appropriateness of heartbeat measuring clothes
Less than 50,000won 53(21.6) 63(24.0) 30(21.6)
13.190 (P=.345)
50,000 ~ less than 100,000 won 97(39.6) 88(33.6) 58(41.7)
100,000 ~ less than 150,000 won 38(15.5) 45(17.2) 16(11.5)
150,000 ~ less than 200,000 won 24(9.8) 39(14.9) 22(15.8)
200,000 ~ less than 250,000 won 5(2.0) 2(0.8) 0(0.0)
250,000 ~ less than 300,000 won 15(6.1) 11(4.2) 7(5.0)
over 300,000 won 13(5.3) 14(5.3) 6(4.3)
Total 245(100.0) 262(100.0) 139(100.0)
Table 19. Awareness of heated clothes
Outdoor following group Outdoor pursuit group Outdoor leading group
χ2
N(%) N(%) N(%)
Awareness of heated clothes
Originally knew 74(30.2) 94(35.9) 68(48.9)
13.481**
(P = .001)
Became to know now 171(69.8) 168(64.1) 71(51.1)
Total 245(100.0) 262(100.0) 139(100.0)
**
p < .01
Table 20. Demand for heated clothes
Item Outdoor following group Outdoor pursuit group Outdoor leading group
F p Post-hoc
Mean ± SD Mean ± SD Mean ± SD
Demand evaluation of heated clothes 3.98 ± .78 4.14 ± .70 4.14 ± .80 3.941* .032 a < b, c
*
p < .05
Table 21. Purchase intentions and price appropriateness of heated clothes
Item Outdoor following group Outdoor pursuit group Outdoor leading group
F p Post-hoc
Mean ± SD Mean ± SD Mean ± SD
Purchase intentions when the heating
function has been added 3.44 ± .69 3.69 ± .58 3.84 ± .62 15.771** .008 a < b, c
Purchase intentions at the current
price 3.54 ± 1.08 3.72 ± 1.01 3.99 ± 1.06 37.815*** .000 a < b, c
**
p < .01,
***p < .001
cating that prices in a range of 300,000~less than 500,000 won were appropriate were the most frequent in the outdoor following group, the outdoor pursuit group indicated that prices in a range of 400,000~less than 1 million won were the most appropriate, and the outdoor leading group indicated that prices exceeding 1 million won were the most appropriate.
3.3.3. Evaluation of demand for light-emitting clothes 1) Awareness of light-emitting clothes
The awareness of smart clothes with a light-emitting function was analyzed and as a result, 9%(n = 58) of respondents answered that they were aware of such smart clothes and no difference appeared among the group. In addition, the awareness of the light-
emitting function was shown to be lower compared to the heartbeat measuring function and the heating function.
2) Preference for light-emitting clothes
The outdoor pursuit group and the outdoor leading group showed higher preference for smart clothes with a light-emitting function compared to the outdoor following group.
3) Purchase intentions and price appropriateness of light-emit- ting clothes
Purchase intentions for smart clothes with a light-emitting func- tion were analyzed and according to the results, the outdoor leading group and the outdoor pursuit group had stronger purchase inten-
Table 22. Analysis of appropriate prices of heated clothesOutdoor following group Outdoor pursuit group Outdoor leading group χ2
N(%) N(%) N(%)
Appropriate prices of heated clothes
Less than 100,000won 5(2.0) 5(1.9) 3(2.2)
12.750* (P = .042)
100,000 ~ less than 200,000 won 25(10.2) 17(6.5) 7(5.0)
200,000 ~ less than 300,000 won 26(10.6) 34(13.0) 12(8.6)
300,000~ less than 400,000 won 86(35.1) 44(16.8) 18(12.9)
400,000 ~ less than 500,000 won 82(33.5) 72(27.5) 27(19.4)
500,000 ~ less than 1 million won 16(6.5) 72(27.5) 29(20.9)
Over 1 million won 5(2.0) 18(6.9) 43(30.9)
Total 245(100.0) 262(100.0) 139(100.0)
*
p < .05
Table 23. Awareness of light-emitting clothes
Outdoor following group Outdoor pursuit group Outdoor leading group χ2
N(%) N(%) N(%)
Awareness of light- emitting clothes
Originally knew 20(8.2) 18(6.9) 20(14.4)
6.602 (P = .137)
Became to know now 225(91.8) 244(93.1) 119(85.6)
Total 245(100.0) 262(100.0) 139(100.0)
Table 24. Demand for light-emitting clothes
Item Outdoor following group Outdoor pursuit group Outdoor leading group
F p Post-hoc
Mean±SD Mean±SD Mean±SD
Preference light-emitting
function 3.21±.99 3.42±1.00 3.47±1.13 8.949 .016* a < b, c
*
p<.05
Table 25. Purchase and price appropriateness of light-emitting clothes
Item Outdoor following group Outdoor pursuit group Outdoor leading group
F p Post-hoc
Mean ± SD Mean ± SD Mean ± SD
Purchase intentions when the light-
emitting function has been added 2.15 ± .70 2.48 ± .71 2.75 ± .76 34.317*** .000 a < b, c Purchase intentions at current prices 2.37 ± 1.03 2.51 ± 1.01 2.82 ± 1.22 17.603** .001 a, b < c
**
p < .01,
***p < .001
tions compared to the outdoor following group.
When the prices were presented and purchase intentions were evaluated thereafter, all the three groups showed stronger purchase intentions. Among the three groups, the outdoor leading group was found to have stronger purchase intentions compared to the outdoor pursuit group and the outdoor following group.
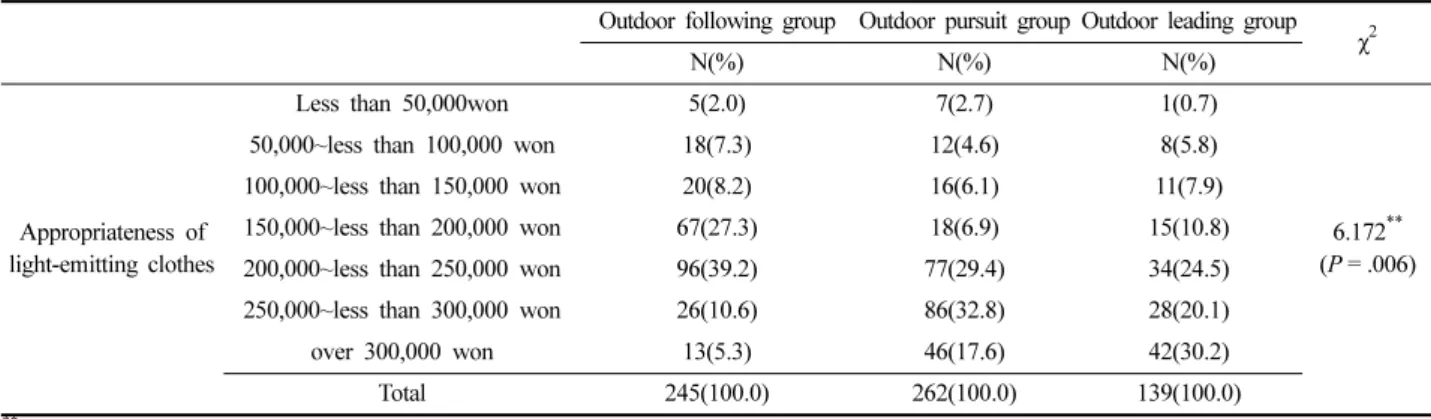
The price appropriateness of light-emitting clothes was analyzed and according to the results, the outdoor following group preferred the price range of 200,000~less than 250,000 won the most, the outdoor pursuit group preferred the price range of 250,000~less than 300,000 won the most, and the outdoor leading group pre- ferred the price range of over 300,000 won the most.
5. Conclusion
In this study, in order to analyze demands for smart clothes according to sports/outdoor clothes consumption behaviors, actu- ally commercialized smart clothes by function were clustered and presented and consumer demands were analyzed.
1) The respondents were classified into three groups according to their sports/outdoor clothes consumption behaviors as follows:
An outdoor leading group of those who had bought at least 10 suits of sports/outdoor clothes, purchased sports/outdoor clothes at least once per three months, consumed 1 million~less than 2 mil- lion won per time of purchase, and were in their 40s or older in most cases, an outdoor pursuit group of those who had bought 6~9 suits of sports/outdoor clothes, purchased sports/outdoor clothes about once per six months, consumed about 300,000~less than 400,000 won per time of purchase, and were in their 30~40s in most cases, and an outdoor following group of those who had bought 3~5 suits of sports/outdoor clothes, purchased sports/out- door clothes about once per year, consumed about 200,000~less than 300,000 won per time of purchase, and were in their 20~30s in most cases.
2) The awareness and necessity of smart clothes were shown to be higher in the outdoor leading group and the outdoor pursuit group compared to the outdoor following group in the analysis.
Among the functions of smart clothes, temperature control such as body temperature control and heating was preferred the most fre- quently followed by health checks and exercise checks in order of precedence.
3) In the evaluation of the value of smart clothes, it was shown that when desired functions were added, the purchase intentions of the outdoor leading group and the outdoor pursuit group increased more compared to the outdoor following group.
4) The levels of awareness of heartbeat measuring smart clothes were not different among the three groups. As for preference and purchase intentions, the outdoor leading group and the outdoor pur- suit group showed higher preference and purchase intentions com- pared to the outdoor following group. As for the acceptance of prices of heartbeat measuring smart clothes, acceptance was shown to be the highest at prices in a range of 50,000~less than 100,000 won and no difference appeared among the groups.
5) For heated smart clothes, the outdoor leading group and the outdoor pursuit group were shown to have higher awareness and preference compared to the outdoor following group. In addition, the outdoor leading group and the pursuit group showed higher lev- els of purchase intentions compared to then outdoor following group and showed higher purchase intentions after current prices of heated clothes were presented. This is considered attributable to the fact that the presented prices of clothes were within the range of acceptable prices presented by each group. The acceptance of heated clothes prices was shown to be the highest when the prices were at least 1 million won in the outdoor leading group, when the prices were in a range of 400,000~less than 1 million won in the outdoor pursuit group, and when the prices were in a range of 300,000~less than 500,000 won in the outdoor following group.
Table 26. Evaluation light-emitting clothes purchase intentions and price appropriateness
Outdoor following group Outdoor pursuit group Outdoor leading group χ2
N(%) N(%) N(%)
Appropriateness of light-emitting clothes
Less than 50,000won 5(2.0) 7(2.7) 1(0.7)
6.172**
(P = .006)
50,000~less than 100,000 won 18(7.3) 12(4.6) 8(5.8)
100,000~less than 150,000 won 20(8.2) 16(6.1) 11(7.9)
150,000~less than 200,000 won 67(27.3) 18(6.9) 15(10.8)
200,000~less than 250,000 won 96(39.2) 77(29.4) 34(24.5)
250,000~less than 300,000 won 26(10.6) 86(32.8) 28(20.1)
over 300,000 won 13(5.3) 46(17.6) 42(30.2)
Total 245(100.0) 262(100.0) 139(100.0)
**
p < .01
6) In the case of smart clothes with a light-emitting function, the outdoor leading group and the outdoor pursuit group were shown to have higher levels of awareness and preference compared to the outdoor following group. When the light-emitting function was added, the outdoor leading group and the outdoor pursuit group were shown to have stronger purchase intentions compared the out- door following group.
As for the price acceptance for smart clothes with a light-emit- ting function, all the three group showed a tendency to have stron- ger purchase intentions after the prices were presented. Among them, the outdoor leading group was shown to have stronger pur- chase intentions compared to the outdoor pursuit group and the out- door following group after the prices were presented. Therefore, in the case of light-emitting clothes, given that purchase intentions increased after the prices were presented, the current prices were considered to have been set appropriately. The most acceptable price ranges by group were shown to be 250,000~less than 300,000 won in the outdoor leading group, 200,000~less than 250,000 won in the outdoor pursuit group, and 150,000~less than 250,000 won in the outdoor following group.
According to the results of analysis in this study, as for the plan- ning of smart clothing, proactive planning into premium products by emphasizing the functional part of smart clothing is considered necessary for the outdoor leading group of people in their 40s and older people, expansion of premium products into high price lines is considered necessary for the outdoor pursuing group of people in their 30~40s, and planning for stepwise entry into mid-to-low price lines that can be applied to single-unit items such as vests is con- sidered necessary for the outdoor sympathy group of people in their 20~30s.
This study is meaningful in that it analyzed and presented the acceptance and acceptable price ranges for smart clothes in diverse age groups ranging from 20s to 60s based on commercialized smart clothes. However, this study has a limitation that the acceptance for smart clothes were analyzed with consumers who had experience in sports outdoor clothes consumption. Therefore, in future, studies will be conducted with a wide range of consumers.
References
Chae, J. M., Cho, H. S., & Lee, J. H. (2009). A study on consumer acceptance toward the commercialized smart clothing. Science of Emotion & Sensibility, 12(2), 181-192.
Chen, M., Ma, Y., Li, Y., Wu, D., Zhang, Y., & Youn, C. H. (2017).
Wearable 2.0: Enabling human-cloud integration in next generation healthcare systems. IEEE Communications Magazine, 55(1), 54- 61. doi:10.1109/MCOM.2017.1600410CM
Cho, H. K., Kim, J. S., & Lee, J. H. (2010). A study of directions for
development of smart clothing based on the consumer’s lifestyle.
Science of Emotion & Sensibility, 13(1), 11-20.
Cho, H. S., Kim, J. H., & Koo, H. R. (2014). An analysis of consumer emotion for product planning of smart clothing. Science of Emotion & Sensibility, 17(3), 49-56.
Choi, S. Y., & Lee, J. R. (2006). A study on the customer perception for the development and application of smart clothing. Journal of the Korean Society for Clothing Industry, 8(4), 420-426.
Choi, S. Y., & Lee, J. R. (2009). Suggestion of the structure for development of smart pants with vibrating massaging function.
Journal of the Korean Society for Clothing Industry, 9(3), 327- 335.
‘Dezeen’. (2016, January 5). OMsignal's smart sports bra gives wearers instant workout feedbackl. Retrieved October 16, 2017, from https://www.dezeen.com/2016/01/05/omsignal-ombra-smart- sports-bra-instant-workout-feedback-sm art-technology- sportswear-fashion-ces-2016/
Fengfan, J., & Yue, H. (2017). Present situation and future develop- ment trend of smart clothing. Journal of Arts & Humanities, 6(8), 54-56. doi: 10.18533/journal.v6i8.1232
‘Gerbing 12V Heated Jacket Liner’. (2017, October 15). Gerbing.
Retrieved October 15, 2017, from https://www.gerbing.com/
heated-jacket-liner
Hwang, Y. M., & Lee, J. R. (2006). Survey on consumer preference for developing smart clothing. Journal of Fashion Business, 10(4), 130-139.
Jung, C. W., Kwak, Y. H., Park, S. Y., & Lee, J. H. (2017). Research on planning and design of smart fitness wear for personal training improvement. Science of Emotion & Sensibility, 20(3), 97-108.
Kang, K. Y., & Jin, H. J. (2007). Influences of consumers' fashion innovativeness and technological innovativeness on attitudes and buying intention toward smart clothing. Journal of the Korean Society for Clothing Industry, 9(1), 35-40.
Kang, K. Y. (2009). Influence of consumer innovativeness on smart clothing innovativeness evaluation. Journal of the Korean Society for Clothing Industry, 11(3), 409-416.
Kang, M. J. (2015). Design guideline for healthcare smart sensing clothing based on consumer acceptance and characteristics.
Unpublished master’s thesis, Yonsei University, Seoul.
Kang, M. Y., & Lee, S. H. (2017). Visibility evaluation of various retroreflective fabric types and LED position on safety life jacket.
Journal of the Korean Society of Clothing and Textiles, 41(2), 352- 361. doi: 10.5850/JKSCT.2017.41.2.352
Kim, S. R., Roh, J. S., & Lee, E. Y. (2016). Development and wearability evaluation of all-fabric integrated smart jacket for a temperature-regulating system based on user experience design.
Fashion & Textile Research Journal, 18(3), 363-373. doi:10.5805/
SFTI.2016.18.3.363
Lee, H. M., & Pan, Y. H. (2017). Design elements derivation to provide user value on the heart rate sensor wearable device-based on health information application-. Journal of the Korean Society of Basic Design & Art, 18(2), 515-526.
Lee, H. S. (2015). The impact of value and trust on smart clothing to consumer behavior. Unpublished master’s thesis, Pusan National University, Busan.
Lee, H. W., Suh, S. G., & Roh, J. S. (2017). Analysis on the characteristics and product trend of wearable smart actuator.
Journal of the Korean Society of Clothing and Textiles, 41(6), 1022-1038. doi:10.5850/JKSCT.2017.41.6.1022
Lee, J. R. (2014). Eco-friendly smart outdoor jacket production and usability evaluation. Journal of the Korean Society of Clothing and Textiles, 38(6), 845-856. doi:10.5850/JKSCT.2014.38.6.845
‘Men’s Down X Heated Jacket + Battery Bundle’. (2017, October 12).
Ravean. Retrieved October 12, 2017, from https://ravean.com/
collections/frontpage/products/mens-down-x-heated-jacket- battery-bundle
‘Metier Beacon Men’s Jacket’. (2017, October 12). Condor. Retrieved October 12, 2017, from https://www.condorcycles.com/products/
metier-beacon-men-s-rain-cape
‘MYZONE® Low Support Sports Bra’. (2017, October 12). MyZone.
Retrieved October 12, 2017, from https://buy.myzone.org/product/
?code=SPORTS-BRA
‘Nightrider LED Women’s Cycling Jacket’. (2017, October 20).
Proviz. Retrieved October 20, 2017, from https://www.provizsports.
com/en-gb/
Noh, M. J., & Park, H. H. (2011). Acceptance of the smart clothing according to trend and information innovation. International Journal of Contents, 11(11), 350-363.
‘OMBra’. (2017, October 20). Omsignal. Retrieved October 20, 2017, from https://omsignal.com/collection
Park, H. H., & Noh, M. J. (2012). The influence of consumers' innovativeness and trust on acceptance intention of sensor-based smart clothing. Fashion & Textile Research Journal, 14(1), 24-36.
doi:10.5805/KSCI.2012.14.1.024
Sung, H. W., & Sung, J. H. (2015). Research on intention to adopt smart wear: Based on extended UTAUT model. Journal of Fashion Business, 19(2), 69-84. doi:10.12940/jfb.2015.19.2.69
(Received 17 December, 2019; 1st Revised 30 January, 2020 2nd Revised 2 March, 2020, Accepted 6 March, 2020)