Diffusion Weighted Imaging for Differentiating Benign from Malignant Orbital Tumors: Diagnostic Performance of the Apparent Diffusion Coefficient Based on Region of Interest Selection Method
Xiao-Quan Xu, MD
1, Hao Hu, MD
1, Guo-Yi Su, MD
1, Hu Liu, MD, PhD
2, Hai-Bin Shi, MD, PhD
1, Fei-Yun Wu, MD, PhD
1Departments of 1Radiology and 2Ophthalmology, First Affiliated Hospital of Nanjing Medical University, Nanjing 210000, China
Objective: To evaluate the differences in the apparent diffusion coefficient (ADC) measurements based on three different region of interest (ROI) selection methods, and compare their diagnostic performance in differentiating benign from malignant orbital tumors.
Materials and Methods: Diffusion-weighted imaging data of sixty-four patients with orbital tumors (33 benign and 31 malignant) were retrospectively analyzed. Two readers independently measured the ADC values using three different ROIs selection methods including whole-tumor (WT), single-slice (SS), and reader-defined small sample (RDSS). The differences of ADC values (ADC-ROI
WT, ADC-ROI
SS, and ADC-ROI
RDSS) between benign and malignant group were compared using unpaired t test. Receiver operating characteristic curve was used to determine and compare their diagnostic ability. The ADC measurement time was compared using ANOVA analysis and the measurement reproducibility was assessed using Bland- Altman method and intra-class correlation coefficient (ICC).
Results: Malignant group showed significantly lower ADC-ROI
WT, ADC-ROI
SS, and ADC-ROI
RDSSthan benign group (all p <
0.05). The areas under the curve showed no significant difference when using ADC-ROI
WT, ADC-ROI
SS, and ADC-ROI
RDSSas differentiating index, respectively (all p > 0.05). The ROI
SSand ROI
RDSSrequired comparable measurement time (p > 0.05), while significantly shorter than ROI
WT(p < 0.05). The ROI
SSshowed the best reproducibility (mean difference ± limits of agreement between two readers were 0.022 [-0.080–0.123] x 10
-3mm
2/s; ICC, 0.997) among three ROI methods.
Conclusion: Apparent diffusion coefficient values based on the three different ROI selection methods can help to differentiate benign from malignant orbital tumors. The results of measurement time, reproducibility and diagnostic ability suggest that the ROI
SSmethod are potentially useful for clinical practice.
Keywords: Diffusion weighted imaging; Apparent diffusion coefficient; Orbit; Tumor; DWI; ADC
Received April 3, 2016; accepted after revision June 10, 2016.
Corresponding author: Fei-Yun Wu, MD, PhD, Department of Radiology, First Affiliated Hospital of Nanjing Medical University, No. 300, Guangzhou Road, Nanjing 210000, China.
• Tel: (86) 13815868181 • Fax: (86) 25-83724440
• E-mail: [email protected]
This is an Open Access article distributed under the terms of the Creative Commons Attribution Non-Commercial License (http://creativecommons.org/licenses/by-nc/3.0) which permits unrestricted non-commercial use, distribution, and reproduction in any medium, provided the original work is properly cited.
Korean J Radiol 2016;17(5):650-656
INTRODUCTION
Accurate differentiation between benign and malignant
http://dx.doi.org/10.3348/kjr.2016.17.5.650pISSN 1229-6929 · eISSN 2005-8330
orbital tumors is very important for the pre-treatment
plan (1). Conventional computed tomography (CT) and
magnetic resonance imaging (MRI) play an essential role in
the display of normal structure and location of the orbital
lesions; however, the role of conventional CT and MRI
features in differentiating benign from malignant orbital
tumors is limited (2, 3). Diffusion-weighted imaging (DWI)
allows quantification of the diffusion properties of water
molecules (4), and its derived apparent diffusion coefficient
(ADC) map is widely accepted as a useful tool to detect
and characterize orbital lesions (5-9). Generally, due to the
enlarged nuclei, hyper-cellularity, and subsequent limited
DWI scan as part of pretreatment MRI evaluation for orbital tumors from March 2013 to December 2015. First, according to the definition of orbital indeterminate lesions proposed in previous studies (5, 9), the patients of cavernous malformation (n = 30), lymphangioma (n = 1), venous varix (n = 5), and epidermoid cyst (n = 10) were excluded based on characteristic findings on conventional MRI. Six patients were excluded because the largest diameter of the lesion was < 1 cm, 8 patients were excluded because of the poor image quality of DWI. Finally, 64 patients (36 men and 28 women; mean age, 49.8 ± 15.2 years; range, 18–90 years) were enrolled in our study.
Sixty-four patients contained 33 benign and 31 malignant tumors. Demographic and histological information of the two groups was shown in Table 1. The final diagnosis was made based on surgical pathology results in 58 patients, typical imaging features and long-term follow-up in 2 patients with optic nerve sheath meningioma, and follow- up after steroid treatment in 4 patients with inflammatory pseudotumor.
MR Scan
MRI was performed using a 3T MR system (Verio;
Siemens, Erlangen, Germany), with a twelve-channel head coil. Conventional MR images were acquired as follows:
unenhanced axial T1-weighted imaging (repetition time [TR]/echo time [TE], 600/10 msec); axial, coronal and sagittal T2-weighted imaging (TR/TE, 4700/79 msec) with fat saturation; contrast-enhanced axial, coronal and sagittal T1-weighted imaging (TR/TE, 500/10 msec). For contrast- enhanced axial T1-weighted imaging, a standard dose of 0.1 mmol/kg of gadolinium-diethylene triamine pentaacetic acid (Magnevist; Bayer Schering Pharma AG, Berlin, Germany) was administered at a rate of 4 mL/s, followed by extra-cellular space, malignant orbital tumors demonstrate
lower ADC value than the benign tumors (5-10). However, the reproducibility of ADC measurements is still a challenge during clinical practice. Previous study has shown that ADC value can be affected by several factors, such as the magnetic field strength, MRI acquisition parameters, and also the region of interest (ROI) selection methods (10).
Previous DWI related studies have mainly utilized three kinds of ROI selection methods to obtain ADC values, including whole tumor ROI, single slice ROI, and reader- defined small sample ROI in selected slices (11). ROI on single or selected slice may lead to inter-reader variability, and does not reflect the tissue heterogeneity (12). Whole- tumor ROI can overcome this problem, however, it is a time consuming process, which limits its clinical application (12). The influence of ROI selection methods on the ADC measurements has been evaluated in the liver (13), ovaries (14), pancreas (11, 15), and breast (16). However, to our knowledge, no previous study has addressed the influence of the three different ROI selection methods on the ADC measurements, and their diagnostic abilities for differentiating benign from malignant orbital tumors.
Therefore, the aim of our study was to assess the
diagnostic performance of the ADC values based on different ROI selection methods in differentiating benign from malignant orbital tumors at 3T MR.
MATERIALS AND METHODS
Patients
Institutional Review Board approval was obtained for this study, and the requirement for written informed consent was waived because of its retrospective nature. Our MRI database identified 124 consecutive patients who underwent
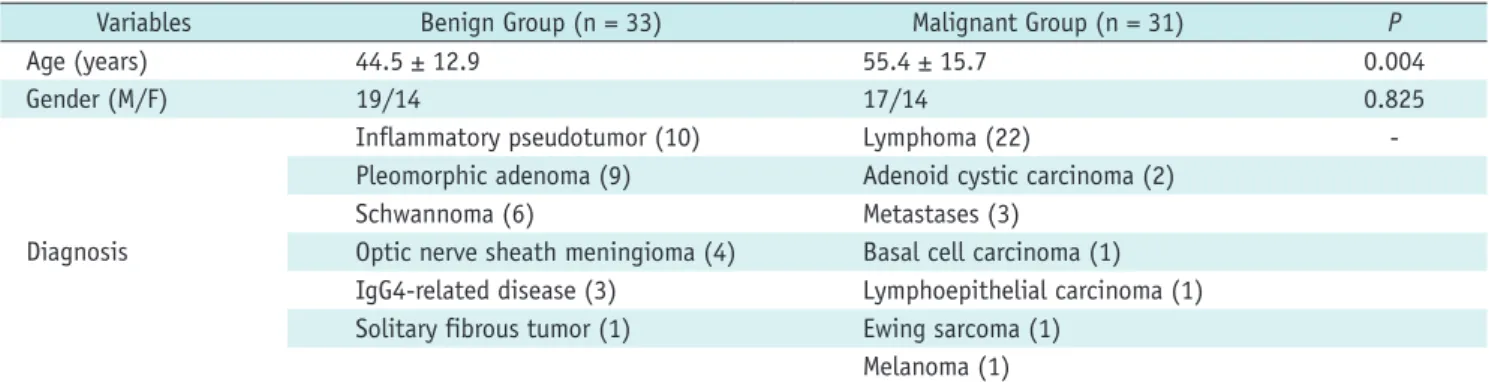
Table 1. Demographic and Histological Information between Two Groups
Variables Benign Group (n = 33) Malignant Group (n = 31) P
Age (years) 44.5 ± 12.9 55.4 ± 15.7 0.004
Gender (M/F) 19/14 17/14 0.825
Diagnosis
Inflammatory pseudotumor (10) Lymphoma (22) -
Pleomorphic adenoma (9) Adenoid cystic carcinoma (2)
Schwannoma (6) Metastases (3)
Optic nerve sheath meningioma (4) Basal cell carcinoma (1) IgG4-related disease (3) Lymphoepithelial carcinoma (1) Solitary fibrous tumor (1) Ewing sarcoma (1)
Melanoma (1)
Data in parentheses indicates number of corresponding patients in our study. F = female, IgG4 = immunoglobulin G4, M = male
a 20-mL bolus of saline at the same injection rate.
Diffusion weighted imaging was obtained in the transverse plane using the single-shot spin-echo echo- planar sequence with three orthogonal diffusion gradients.
Imaging parameters for DWI were as follows: TR/TE, 4000/85 ms; b factors, 0 and 800 s/mm
2; section thickness, 4 mm with no gap; flip angle, 15°; field of view, 200 x 200 mm; matrix, 384 x 384; number of sections, 10; number of averages, 6. The total acquisition time of DWI was 4 minutes 14 seconds.
Imaging Analysis
Diffusion weighted imaging data were processed using an off-line in-house software (FireVoxel; CAI
2R; New York University, New York, NY, USA) (12). The ADC map was constructed and the ADC value was calculated using the following mono-exponential fitting formula: ADC = -ln (S
b/S
0) / b, where b represents the diffusion sensitivity coefficients, and S
band S
0represent the corresponding signal values of the given ROI.
When applying the whole-tumor ROI (ROI
WT) method, freehand ROIs were drawn along the border of the high signal of the tumor on DWI (b = 800) to cover the entire tumor area on each tumor containing slice, and the mean ADC value was derived and defined as ADC-ROI
WT. When applying single-slice ROI (ROI
SS) method, the slice in which the tumor demonstrated the largest diameter was chosen.
Free-hand ROIs were drawn to cover as much tumor tissue as possible in this slice. Similarly, the mean ADC value was derived and defined as ADC-ROI
SS. When applying reader-defined small sample ROI (ROI
RDSS) method, three freehand circular ROIs (area range, 0.467–0.622 cm
2; mean, 0.506 cm
2) were drawn on the area in which the tumor demonstrated relative higher signal intensity on DW image (b
= 800). ADC values obtained from three ROIs were averaged for further analysis and designated ADC-ROI
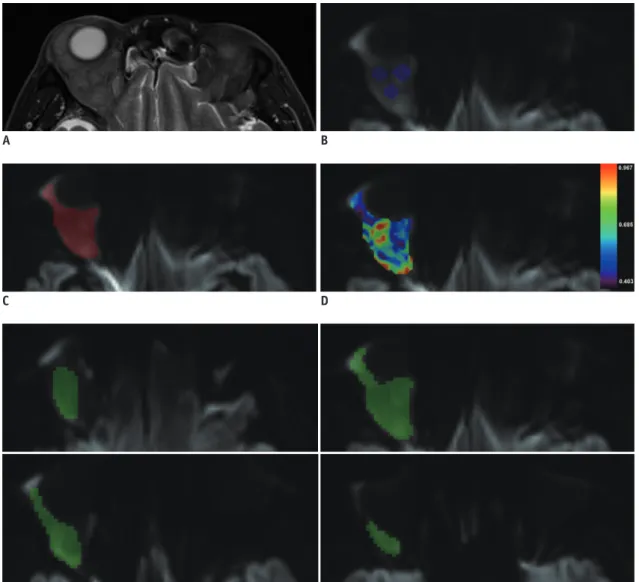
RDSS. For the three ROI methods, the visually cystic and necrotic areas were excluded with reference to T2-weighted and contrast enhanced T1-weighted images; and the time required for ADC measurements based on three different ROI methods was also recorded. Schematic illustration of the three different ROI selection methods was shown in Figure 1.
Two experienced neuro-radiologists (reader 1 with 14 years of experience; reader 2 with 5 years of experience) independently measured the tumor ADC values according to the three ROI selection methods. The measurement results were averaged between the two readers for further analyses.
Statistical Analysis
Numeric data were reported as mean ± standard deviation.
Kolmogorov-Smirnov test was used for analyzing the normality of data distribution. Unpaired t test was used to compare the difference of age and mean ADC values between benign and malignant orbital tumors group. Chi- square test was used to compare the difference of gender between the two groups. Multiple receiver operating characteristic (ROC) curves comparison according to the method of DeLong et al. (17), were used to compare the diagnostic ability of the mean ADC values based on three different ROIs in predicting malignant orbital tumors.
The times required for ADC measurement based on the three ROI selection methods were compared with ANOVA analysis. Inter-reader variability of orbital tumor ADC measurements for each ROI selection method was analyzed by using the intra-class correlation coefficient (ICC) (18), and the method of Bland-Altman (19). The statistical significance threshold was set at a two-sided p value <
0.05. All statistical analyses were carried out using two statistical packages (SPSS version 19.0; SPSS Inc., Chicago, IL, USA and MedCalc version 13; MedClac Software, Ostend, Belgium).
RESULTS
There was significant difference in age (p = 0.004), while no difference in gender (p = 0.825) between the benign and malignant groups. Table 2 summarized the comparison of ADC-ROI
WT, ADC-ROI
SS, and ADC-ROI
RDSSvalue between benign and malignant group. Malignant group demonstrated lower mean ADC-ROI
WT, ADC-ROI
SS, and ADC-ROI
RDSSvalue than benign group (ADC-ROI
WT, 0.808 ± 0.280 vs. 1.795
± 0.470, p < 0.001; ADC-ROI
SS, 0.773 ± 0.230 vs. 1.754 ± 0.461, p < 0.001; ADC-ROI
RDSS, 0.675 ± 0.213 vs. 1.605 ± 0.423, p < 0.001). Comparison of ADC-ROI
WT, ADC-ROI
SS, and ADC-ROI
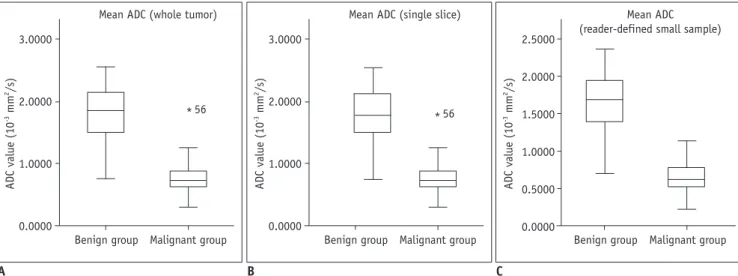
RDSSvalue between the two groups was also shown in box plots (Fig. 2).
The average time required for ADC-ROI
WT, ADC-ROI
SS, and ADC-ROI
RDSSmeasurement was 82.1 ± 26.3, 30.0 ± 6.5, and 31.5 ± 8.3 seconds. The time required for ADC- ROI
WTmeasurement was significantly longer than ADC- ROI
SSand ADC-ROI
RDSS(both p < 0.001), while no significant difference was found in the time required for ADC-ROI
SSand ADC-ROI
RDSS(p = 0.093).
Receiver operating characteristic curves analysis indicated
that setting the ADC-ROI
WT= 1.251 x 10
-3mm
2/s, ADC-ROI
SS= 1.084 x 10
-3mm
2/s, ADC-ROI
RDSS= 1.140 x 10
-3mm
2/s as threshold value resulted in optimal diagnostic value {(ADC- ROI
WT; area under curve [AUC], 0.948; sensitivity, 96.8%;
specificity, 84.9%) (ADC-ROI
SS; AUC, 0.966; sensitivity, 93.6%; specificity, 90.9%) (ADC-ROI
RDSS; AUC, 0.969;
sensitivity, 100%; specificity, 84.9%)}. Multiple ROC curves comparison indicated that the AUCs showed no significant differences when using ADC-ROI
WT, ADC-ROI
SS, and ADC- ROI
RDSSas differentiating index, respectively (ADC-ROI
WTvs.
ADC-ROI
SS, p = 0.073; ADC-ROI
SSvs. ADC-ROI
RDSS, p = 0.610;
ADC-ROI
WTvs. ADC-ROI
RDSS, p = 0.064). ROC analyses using
ADC-ROI
WT, ADC-ROI
SS, and ADC-ROI
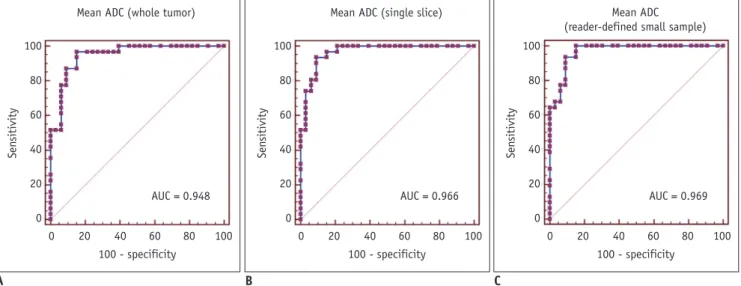
RDSSto predict orbital malignancy were showed in Table 3 and Figure 3.
The mean difference (bias) and limits of agreement between two readers were 0.022 (-0.080–0.123) x 10
-3mm
2/s for single-slice ROI (ICC, 0.997; 95% confidence interval [CI], 0.994–0.998), 0.024 (-0.245–0.292) x 10
-3mm
2/s for ROI
WT(ICCs, 0.977; 95% CI, 0.962–0.986), and 0.192 (-0.135–0.518) x 10
-3mm
2/s for small solid sample ROI (ICC, 0.959; 95% CI, 0.933–0.974). The mean ADCs in small solid sample ROI were more scattered than the other two ROI methods. Graphic illustrations of these data with
A B
C D
E
Fig. 1. Schematic illustration of three ROI selection methods on DW (b = 800 s/mm2) images obtained from 70-year-old patient with orbital lymphoma.
Axial T2-weighted image shows lesion molding in right orbit (A). For reader-defined small sample ROI, three freehand circular ROIs with mean area of approximately 0.5 cm2 were drawn on area in which tumor showed relative higher signal intensity on DW image (b = 800) (B).
For selected slice ROI, slice in which tumor showed largest diameter was chosen. Free-hand ROIs was drawn to cover as much tumor tissue as possible in this slice (C), then corresponding ADC map could be generated and embed within DW image (D). For whole-tumor ROI, freehand ROIs were drawn along border of tumor to cover entire tumor area on each tumor-containing slice (E, four maps). ADC = apparent diffusion coefficient, DW = diffusion weighted, ROI = regions of interest
Bland-Altman plots were displayed in Figure 4.
DISCUSSION
In this study, we compared the mean ADC values derived from three different ROI selection methods of the benign and malignant orbital tumors. ADC values based on the three ROI selection methods of the malignant orbital tumors were significantly lower than those of the benign tumors. In addition, ROI
SSshowed the best reproducibility among three ROI selection methods; whereas, the ROI
SSand ROI
RDSSshowed significantly shorter measurement time than ROI
WT. Based on the measurement time, reproducibility and diagnostic ability, ROI
SShas the potential for use in measurement of the ADC value of orbital tumors in clinical
practice.
The present results demonstrated that ADC values based on the three different ROI selection methods of the malignant orbital tumors were significantly lower than those of the benign tumors. Enlarged nuclei and hyper- cellularity in malignant tumors would reduce the diffusivity of water protons in the extracellular and intracellular space, and result in decreased ADC values (5, 8, 9). In addition, despite variation in diagnostic performance of the ADC values based on the three ROI selection methods, the AUC values from ROC analyses showed no significant difference among these three methods. Our study results indicated that ADC values based on the three ROI selection methods might be useful metrics for predicting orbital malignancy.
Each ROI selection method has its own merits and
Table 2. Comparison of ADC between Two GroupsADC Value Benign Group (n = 33) Malignant Group (n = 31) P
ADC-ROIWT 1.795 ± 0.470 0.808 ± 0.280 < 0.001
ADC-ROISS 1.754 ± 0.461 0.773 ± 0.230 < 0.001
ADC-ROIRDSS 1.605 ± 0.423 0.675 ± 0.213 < 0.001
Data are reported as mean ± standard deviation; unit for ADC value is x 10-3 mm2/s. ADC = apparent diffusion coefficient, ROI = region of interest, ROIRDSS = ROI based on reader-defined small sample in selected slices, ROISS = ROI based on single slice, ROIWT = ROI based on whole tumor
Table 3. Diagnostic Ability of ADC Based on Different ROIs for Predicting Orbital Malignancy
Variables Cut-Off Value AUC Sensitivity (%) Specificity (%)
ADC value
ADC-ROIWT 1.251 0.948 (0.862–0.988) 96.8 (83.3–99.9) 84.9 (68.1–94.9)
ADC-ROISS 1.084 0.966 (0.887–0.995) 93.6 (78.6–99.2) 90.9 (75.7–98.1)
ADC-ROIRDSS 1.140 0.969 (0.892–0.996) 100 (88.8–100) 84.9 (68.1–94.9)
Data in parentheses are 95% confidence intervals. Unit for ADC value is x 10-3 mm2/s. ADC = apparent diffusion coefficient, AUC = area under curve, ROI = region of interest, ROIRDSS = ROI based on reader-defined small sample in selected slices, ROISS = ROI based on single slice, ROIWT = ROI based on whole tumor
Fig. 2. Box-and-whisker plots of ADC-ROIWT (A), ADC-ROISS (B), and ADC-ROIRDSS (C) values between benign and malignant groups.
*Outliers. ADC = apparent diffusion coefficient, ROI = region of interest, ROIRDSS = ROI based on reader-defined small sample in selected slices, ROISS = ROI based on single slice, ROIWT = ROI based on whole tumor
A B C
3.0000
2.0000
1.0000
0.0000
3.0000
2.0000
1.0000
0.0000
2.5000 2.0000 1.5000 1.0000 0.5000 0.0000
ADC value (10-3 mm2/s) ADC value (10-3 mm2/s) ADC value (10-3 mm2/s)
Benign group Benign group Benign group
Mean ADC (whole tumor) Mean ADC (single slice) Mean ADC
(reader-defined small sample)
Malignant group Malignant group Malignant group
56 56
* *
limitations. During clinical usage, ROI
RDSSwas the most commonly used ROI selection method for measuring the ADC values. Previous studies indicated that since the ROI
RDSSwas commonly placed on the area where the tumor showed relative higher signal intensity on DW images, ROI
RDSStended to reflect the most solid, cellular or viable portion of the tumor (11, 20). However, our study results indicated that inter-reader variability was an major limitation of ROI
RDSS. To overcome this limitation, some researchers proposed the ROI
WTapproach (5, 7, 12). However, since the ROI
WTapproach is a time-consuming process, much longer measurement time could be a limitation for its
routine application in clinical practice. In contrast, the ROI
SShad significantly better reproducibility than ROI
RDSS, and significantly shorter measurement time than ROI
WT. Thus, the ROI
SSwould be the most appropriate approach to measure ADC values of orbital tumors in clinical practice.
Our study has some limitations. First, the study
population was relatively small. Future studies are required to validate the present results in a larger population.
Second, final diagnosis of some cases was based on the typical imaging appearance and long-term follow-up or diagnostic treatment, without histological conformation.
Third, 8 of 124 DWI studies could not be interpreted due to
Fig. 3. ROC analyses using ADC-ROIWT (A), ADC-ROISS (B), and ADC-ROIRDSS (C) values to differentiate benign from malignant orbital tumors. Multiple ROC curves comparison indicated no significant differences on area under curves when using ADC-ROIWT, ADC-ROISS, and ADC-ROIRDSS as differentiating index, respectively (ADC-ROIWT vs. ADC-ROISS, p = 0.073; ADC-ROISS vs. ADC-ROIRDSS, p = 0.610; ADC-ROIWT vs. ADC- ROIRDSS, p = 0.064). ADC = apparent diffusion coefficient, AUC = area under curve, ROC = receiver operating characteristic, ROI = region of interest, ROIRDSS = ROI based on reader-defined small sample in selected slices, ROISS = ROI based on single slice, ROIWT = ROI based on whole tumorA B C
100 80 60 40 20 0
100 80 60 40 20 0
100 80 60 40 20 0
Sensitivity Sensitivity Sensitivity
100 - specificity 100 - specificity 100 - specificity
0 20 40 60 80 100 0 20 40 60 80 100 0 20 40 60 80 100
Mean ADC (whole tumor) Mean ADC (single slice) Mean ADC
(reader-defined small sample)
AUC = 0.948 AUC = 0.966 AUC = 0.969
Fig. 4. Bland-Altman plots of inter-reader agreement for ADC-ROIWT (A), ADC-ROISS (B), and ADC-ROIRDSS (C). Difference of mean ADC value between two readers (y-axis) was plotted against mean ADC value of two readers (x-axis), with mean absolute difference (bias) (solid line) and 95% confidence interval of mean difference (limits of agreement) (dashed lines). ADC = apparent diffusion coefficient, ROI = region of interest, ROIRDSS = ROI based on reader-defined small sample in selected slices, ROISS = ROI based on single slice, ROIWT = ROI based on whole tumor
A B C
0.6 0.5 0.4 0.3 0.2 0.1 0.0 -0.1 -0.2 -0.3
0.3 0.2 0.1 0.0 -0.1
0.8 0.6 0.4 0.2 0.0 -0.2
ADC reader 1 - ADC reader 2 ADC reader 1 - ADC reader 2 ADC reader 1 - ADC reader 2 -0.4
Mean ADC of reader 1 and 2 Mean ADC of reader 1 and 2 Mean ADC of reader 1 and 2
0.0 0.5 1.0 1.5 2.0 2.5 3.0 0.0 0.5 1.0 1.5 2.0 2.5 3.0 0.0 0.5 1.0 1.5 2.0 2.5 3.0
Mean ADC (whole tumor) Mean ADC (single slice) Mean ADC
(reader-defined small sample)
+1.96 SD
+1.96 SD
+1.96 SD
-1.96 SD -1.96 SD
-1.96 SD
Mean Mean
0.29 Mean
0.12
0.52
-0.24 -0.08
-0.13
0.02 0.02
0.19
inadequate image quality. Future study using periodically rotated overlapping parallel lines with enhanced
reconstruction technique or readout-segmented echo-planar imaging technique might be helpful to reduce the artifacts (9, 21).
In conclusion, our study showed that the ADC values derived from all three ROI selection methods could help to differentiate benign from malignant orbital tumors. The ROI selection methods had no definite influence on the diagnostic performance of ADC values.
The results of measurement time, reproducibility and diagnostic ability suggest that the ROI
SSmethod could be used to measure the ADC value of orbital tumors in clinical practice.
REFERENCES
1. Tailor TD, Gupta D, Dalley RW, Keene CD, Anzai Y. Orbital neoplasms in adults: clinical, radiologic, and pathologic review. Radiographics 2013;33:1739-1758
2. Gufler H, Preiß M, Koesling S. Visibility of sutures of the orbit and periorbital region using multidetector computed tomography. Korean J Radiol 2014;15:802-809
3. Xian J, Zhang Z, Wang Z, Li J, Yang B, Man F, et al. Value of MR imaging in the differentiation of benign and malignant orbital tumors in adults. Eur Radiol 2010;20:1692-1702 4. Lim HK, Lee JH, Baek HJ, Kim N, Lee H, Park JW, et al. Is
diffusion-weighted MRI useful for differentiation of small non-necrotic cervical lymph nodes in patients with head and neck malignancies? Korean J Radiol 2014;15:810-816 5. Xu XQ, Hu H, Su GY, Zhang L, Liu H, Hong XN, et al. Orbital
indeterminate lesions in adults: combined magnetic resonance morphometry and histogram analysis of apparent diffusion coefficient maps for predicting malignancy. Acad Radiol 2016;23:200-208
6. Sepahdari AR, Kapur R, Aakalu VK, Villablanca JP, Mafee MF.
Diffusion-weighted imaging of malignant ocular masses:
initial results and directions for further study. AJNR Am J Neuroradiol 2012;33:314-319
7. Xu XQ, Hu H, Su GY, Liu H, Hong XN, Shi HB, et al. Utility of histogram analysis of ADC maps for differentiating orbital tumors. Diagn Interv Radiol 2016;22:161-167
8. Razek AA, Elkhamary S, Mousa A. Differentiation between benign and malignant orbital tumors at 3-T diffusion MR- imaging. Neuroradiology 2011;53:517-522
9. Sepahdari AR, Aakalu VK, Setabutr P, Shiehmorteza M, Naheedy JH, Mafee MF. Indeterminate orbital masses:
restricted diffusion at MR imaging with echo-planar diffusion-weighted imaging predicts malignancy. Radiology 2010;256:554-564
10. Haradome K, Haradome H, Usui Y, Ueda S, Kwee TC, Saito K, et al. Orbital lymphoproliferative disorders (OLPDs): value of MR imaging for differentiating orbital lymphoma from benign OPLDs. AJNR Am J Neuroradiol 2014;35:1976-1982
11. Ma C, Liu L, Li J, Wang L, Chen LG, Zhang Y, et al. Apparent diffusion coefficient (ADC) measurements in pancreatic adenocarcinoma: a preliminary study of the effect of region of interest on ADC values and interobserver variability. J Magn Reson Imaging 2016;43:407-413
12. Wu CJ, Wang Q, Li H, Wang XN, Liu XS, Shi HB, et al.
DWI-associated entire-tumor histogram analysis for the differentiation of low-grade prostate cancer from intermediate-high-grade prostate cancer. Abdom Imaging 2015;40:3214-3221
13. Colagrande S, Pasquinelli F, Mazzoni LN, Belli G, Virgili G.
MR-diffusion weighted imaging of healthy liver parenchyma:
repeatability and reproducibility of apparent diffusion coefficient measurement. J Magn Reson Imaging 2010;31:912- 920
14. Mukuda N, Fujii S, Inoue C, Fukunaga T, Tanabe Y, Itamochi H, et al. Apparent diffusion coefficient (ADC) measurement in ovarian tumor: effect of region-of-interest methods on ADC values and diagnostic ability. J Magn Reson Imaging 2016;43:720-725
15. Liu L, Ma C, Li J, Wang L, Chen LG, Zhang Y, et al. Comparison of the diagnostic performances of three techniques of ROI placement for ADC measurements in pancreatic adenocarcinoma. Acad Radiol 2015;22:1385-1392
16. Giannotti E, Waugh S, Priba L, Davis Z, Crowe E, Vinnicombe S. Assessment and quantification of sources of variability in breast apparent diffusion coefficient (ADC) measurements at diffusion weighted imaging. Eur J Radiol 2015;84:1729-1736 17. DeLong ER, DeLong DM, Clarke-Pearson DL. Comparing
the areas under two or more correlated receiver operating characteristic curves: a nonparametric approach. Biometrics 1988;44:837-845
18. Cohen J. Weighted kappa: nominal scale agreement with provision for scaled disagreement or partial credit. Psychol Bull 1968;70:213-220
19. Bland JM, Altman DG. Statistical methods for assessing agreement between two methods of clinical measurement.
Lancet 1986;1:307-310
20. Ahlawat S, Khandheria P, Del Grande F, Morelli J, Subhawong TK, Demehri S, et al. Interobserver variability of selective region-of-interest measurement protocols for quantitative diffusion weighted imaging in soft tissue masses: comparison with whole tumor volume measurements. J Magn Reson Imaging 2016;43:446-454
21. Wan H, Sha Y, Zhang F, Hong R, Tian G, Fan H. Diffusion- weighted imaging using readout-segmented echo-planar imaging, parallel imaging, and two-dimensional navigator- based reacquisition in detecting acute optic neuritis. J Magn Reson Imaging 2016;43:655-660