Diffusion-Weighted Magnetic Resonance Imaging for the Evaluation of Prostate Cancer: Optimal B Value at 3T
9
0
0
전체 글
(2) Koo et al.. Previous studies have demonstrated the usefulness of DWI in the evaluation of prostate cancer using a variety of imaging parameters, which led to conflicting results for cancers and benign prostatic tissues in quantitative analysis (4-9). Of several DWI parameters, the b value is one of the most important because sensitivity to diffusion-based contrast is primarily controlled by this value. Furthermore, apparent diffusion coefficient (ADC) values may be affected because the signal intensity in DWI is influenced by T2, ADC, b value, spin density, and TE. However, many published studies have used a wide range of b values from 500-2000 s/mm2 in prostate DWI (4-9), which highlights the need to optimize b values. To the best of knowledge, no published studies have been shown to assess the utility of DWI under different b values in differentiating qualitatively and quantitatively between cancers and benign prostatic tissues. Therefore, the purpose of the present study was to retrospectively determine the optimal b value of DWI for the prediction of localized prostate cancer, and to evaluate the utility of DWI under different b values in differentiating between cancers and benign prostatic tissues.. MATERIALS AND METHODS Patients This study was approved by our institutional review board. Requirements for written informed consent were waived because it was a retrospective analysis. Between October 2008 and February 2009, 95 patients underwent MR imaging followed by radical prostatectomy. Fifteen of these patients were excluded from the study because they underwent outside MR imaging or had a time interval of more than 4 months between surgery and MR imaging. Thus, a total of 80 patients (mean age: 66 years; range: 45-81 years) were included in our study. All patients underwent transrectal ultrasound (TRUS)guided biopsy at an average of 21 days before MRI (range: 2-85 days) or an average of 23 days after MRI (range: 0-89 days). The time intervals between MRI and surgery ranged from 1 to 120 days (mean: 34 days). The preoperative median PSA level was 7.16 ng/mL (range: 1.24-56.98 ng/ mL). The median Gleason score at biopsy was 7 (range: 6-9). MR Techniques All MR imaging was performed with a 3T MR system (Intera Achieva 3T, Philips Medical System, Best, The Netherlands) 62. equipped with a 6-channel SENSE coil (Philips Healthcare, Best, The Netherlands). All patients underwent T1-weighted, T2-weighted imaging (T2WI) and DWI. Before scanning, each patient received an intramuscular injection of 20 mg butyl scopolamine (Buscopan, Boehringer, Ingelheim, Ingelheim am Rhein, Germany) to suppress bowel peristalsis; no bowel preparation was performed. T2-weighted turbo spin-echo images were acquired in three orthogonal planes (transverse, sagittal, and coronal). T2WI scan parameters were as follows: repetition time (TR)/ echo time (TE), 3566-3631/100 msec; slice thickness, 3 mm; interslice gap, 1 mm; 512 x 352 matrix; field of view (FOV), 20 cm; number of signals acquired (NSA), 3; and sensitivity encoding (SENSE) factor, 2. Axial T1-weighted turbo field echo sequences (5-mm slice thickness; FOV, 26 cm) were acquired to detect biopsy artifacts and assess lymph nodes. Diffusion-weighted MR images were acquired in the transverse plane using the single-shot echo planar imaging (EPI) technique with parallel imaging and fat suppression (spectral attenuation inversion recovery). Scan parameters were as follows: TR/TE, 4830-4840/75-76; slice thickness, 3 mm; interslice gap, 1 mm; matrix, 112 x 110; FOV, 20 cm; SENSE factor 2; and NSA, 3. The frequency direction was anteroposterior to decrease motion or susceptibility artifacts over the prostate. Diffusion-encoding gradients were applied as 5 b values from 0 to 2000 s/mm2 (0, 300, 700, 1000, and 2000 s/mm2) along the three orthogonal directions of motion-probing gradients. The b values were varied by changing the amplitude of the diffusion gradient with all timing parameters fixed. The ADC maps were automatically constructed on a pixel-by-pixel basis (for b values of 0 and for each b value from 300 to 2000 s/mm2). The DWI acquisition time was less than 5 minutes. Imaging Analysis All MR images were archived using a picture archiving and communication system (PACS; PathSpeed Workstation; GE Medical Systems, Milwaukee, WI, USA). Two radiologists who were unaware of the clinical, surgical, and histological findings analyzed the MR images retrospectively and independently. The experienced reader had completed a genitourinary fellowship and had read more than 900 MR examinations of the prostate. The less-experienced reader had completed a body fellowship and had read approximately 70 MR examinations of the prostate at the time of the study. Korean J Radiol 14(1), Jan/Feb 2013. kjronline.org.
(3) Optimal B Values in DW MR Imaging for Prostate Cancer Evaluation. For qualitative analysis, the prostate gland was divided into 10 prostate sectors: base (right and left), midgland (right and left), and apex (right and left) in the peripheral (PZ), and base (right and left) and midgland (right and left) in the transition zone (TZ). The blinded readers were independently asked to identify the presence or absence of cancer on DWI. Based on the anatomical details of T2WI, index DWI as well as ADC maps at b = 300, 700, 1000 and 2000 s/mm2 were analyzed using a five-point scale: 1, definitely benign; 2, probably benign; 3, indeterminate; 4, probably cancer; 5, definitely cancer; and the results for each reader were compared. The diagnostic criteria for cancer on DWI were low focal signal lesions relative to benign prostate tissues within the prostate on ADC maps that showed high signal intensity on index DWI. To assess the quality of DWI with different b values, quantitative measurement of the signal-to-noise ratio (SNR) is a fundamental quantitative method because it has enormous impact on the diagnostic quality of clinical studies. However, we did not measure the SNRs of DWI with different b values because we used parallel imaging technique (i.e., SENSE factor) on DWI. The SNR measurements under parallel imaging technique are complicated and difficult. Quantitative analysis was performed more than 2 months after qualitative analysis. All MR images were also transferred to an independent workstation with manufacturer-supplied software (Philips Healthcare, Best, The Netherlands). Two readers analyzed the mean ADC values in consensus, and they were measured in benign tissues and cancers in the PZ and TZ based on the histopathologic findings. By referring to a standardized diagram, circular ROIs were manually generated on the T2weighted images for cancers and benign tissues in the PZ and TZ in each patient. These ROIs on the T2-weighted images were automatically superimposed on four different ADC maps by means of image-registration software; when cancer was visualized on at least one of four different ADC maps, an ADC value in cancer was measured. When the ROIs were drawn, great care was taken to exclude both the neurovascular bundle and the urethra to reduce any error in ADC calculations. ADC values in cancers were assessed twice at the same site, and the average was calculated. The values in benign tissues were calculated at three different sites and averaged. Each ROI had a mean area of 28 mm2 (range, 10.5-220 mm2). Cancer detected with ADC maps was considered to be kjronline.org. Korean J Radiol 14(1), Jan/Feb 2013. matched lesions when cancer was at least partially present in the same area on the standardized cancer map. To allow for reasonable differences in registration and deformation between ADC maps and histopathologic findings, cancers were considered to be of comparable sizes if the maximal transverse diameters calculated from ADC maps were within 50-150% of the maximal transverse diameters calculated by histopathology (10). To minimize the mismatch of cancers between ADC maps and histopathologic findings on the quantitative analysis, areas of cancers chosen on ADC maps were smaller than those on histopathologic findings. Furthermore, small cancers with a maximal transverse diameter of less than 5 mm were excluded from this study. Histopathologic Examination In all 80 patients, prostate cancer was proven histopathologically after radical prostatectomy. All specimens were marked with ink and fixed overnight in 10% buffered formalin. Transverse step sections were obtained at 3-mm intervals in a plane perpendicular to the prostatic urethra. All slides obtained from tissue slices were reviewed by an experienced pathologist who was unaware of the MRI findings. The reviewer recorded the sizes, locations, and Gleason scores of all cancer foci on a standardized diagram divided into base, mid-gland, and apex for each lobe. Statistical Analysis Statistical analyses included calculations of sensitivity, specificity, positive predictive value (PPV), and negative predictive value (NPV) in the localization of prostate cancer by dichotomizing the readings. Scores of 3 to 5 were considered “present.” Comparisons of results from b = 300, 700, 1000 and 2000 s/mm2 were performed using Cochran’s Q test followed by multiple comparisons by the McNemar test with Bonferroni correction. Receiver operating characteristic (ROC) curves were generated for the probability of prostate cancer location using four different b values in the two readers. The diagnostic performance was then assessed by calculating the area under the curve (AUC). The statistically significant differences in the AUC were determined using the χ2 test. The mean ADC values of cancers and benign tissues of both PZ and TZs at each b value were compared using paired Student’s t test with Bonferroni correction. Interreader agreement between the experienced and less-experienced reader was analyzed by kappa statistics. Statistical analysis was performed using PASW software (version 18.0; SPSS, 63.
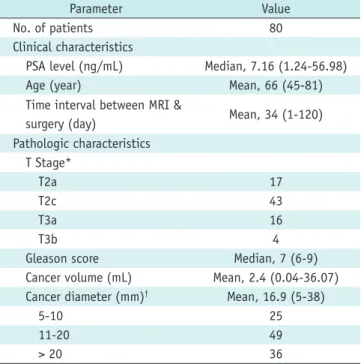
(4) Koo et al.. Inc., Chicago, IL, USA). Two-tailed tests were used to calculate all p values. P values < 0.05 were considered significant.. RESULTS The patient and cancer characteristics are summarized in Table 1. Histopathologic Findings Eighty patients who underwent radical prostatectomy had 136 instances of cancer. Among them, 110 cancers with maximal transverse diameters ≥ 5 mm were detected Table 1. Summary of Clinical and Pathologic Characteristics Parameter No. of patients Clinical characteristics PSA level (ng/mL) Age (year) Time interval between MRI & surgery (day) Pathologic characteristics T Stage* T2a T2c T3a T3b Gleason score Cancer volume (mL) Cancer diameter (mm)† 5-10 11-20 > 20. Value 80 Median, 7.16 (1.24-56.98) Mean, 66 (45-81) Mean, 34 (1-120). 17 43 16 4 Median, 7 (6-9) Mean, 2.4 (0.04-36.07) Mean, 16.9 (5-38) 25 49 36. Note.— Numbers in parentheses are ranges. *Data are given as numbers of specimens, †Data are given as numbers of cancers. PSA = prostate-specific antigen. in surgical specimens. The mean cancer size was 16.9 mm (range: 5-45 mm); 25 were between 5 and 10 mm in maximal transverse diameter, 49 were between 10 and 20 mm, and the remaining 36 were more than 20 mm. The mean volume of the 136 cancers was 2.40 mL (range, 0.0436.07 mL). The Gleason cancer scores ranged from 6 to 9 (median, 7). Qualitative Analysis of DWI Of the 110 pathologically proven cancers, 92 (84%) were identified on ADC maps. Table 2 presents the visual assessment results on a per-tumor basis of ADC maps at b = 300, b = 700, b = 1000, and b = 2000 s/mm2 for detecting localized prostate cancer at 3T for the experienced and lessexperienced readers. The sensitivity for the experienced reader was significantly greater at b = 1000 (85%) than at b = 300 (35%), b = 700 (78%), and b = 2000 s/mm2 (74%) (Figs. 1, 2) (p < 0.001). The sensitivity was significantly greater at b = 700 than at b = 300 and 2000 s/mm2 (p < 0.05), and the sensitivity at b = 2000 was significantly greater than at b = 300 s/mm2 (p < 0.001). However, the specificity was the greatest at b = 2000 s/mm2 among other b values (p < 0.05). Although the sensitivity for the less-experienced reader was only 45% for the b value of 1000 s/mm2, it was significantly greater than at the other b values (p < 0.01); the sensitivity was significantly greater at b = 700 than at b = 300 and 2000 s/mm2 (p < 0.001). The specificity was the greatest at b = 2000 s/mm2 among other b values (p < 0.01). Figure 3 shows the results of ROC curve analyses for prostate cancer detection by both readers. For the experienced reader, the AUCs in sequence from b = 300 to b = 2000 s/mm2 were 0.69, 0.88, 0.91 and 0.87, and that of b = 1000 s/mm2 was significantly different from the others (p < 0.01); however, no significant difference between 700. Table 2. Results of Qualitative Assessment of Four Different ADC Maps for Predicting Localized Prostate Cancer at 3T by Experienced and Less-Experienced Readers B values B = 300 B = 700 B = 1000 B = 2000. Sensitivity (%) LessExperienced Experienced Reader Reader 35 (75/205) 29 (59/205) 78 (160/205) 40 (82/205) 85 (174/205) 45 (93/205) 74 (152/205) 29 (59/205). Specificity (%) LessExperienced Experienced Reader Reader 93 (553/595) 85 (507/595) 92 (546/595) 86 (513/595) 94 (557/595) 83 (496/595) 96 (573/595) 92 (548/595). PPV (%) LessExperienced Experienced Reader Reader 63 (72/114) 40 (59/147) 77 (160/209) 50 (82/164) 82 (174/212) 48 (93/192) 87 (152/174) 56 (59/106). NPV (%) Experienced Reader 81 (553/686) 92 (546/591) 95 (557/588) 92 (573/626). LessExperienced Reader 40 (59/147) 50 (82/164) 48 (93/192) 56 (59/106). Note.— Raw data are in parentheses. Unit of b value is s/mm2. ADC = apparent diffusion coefficient, PPV = positive predictive value, NPV = negative predictive value. 64. Korean J Radiol 14(1), Jan/Feb 2013. kjronline.org.
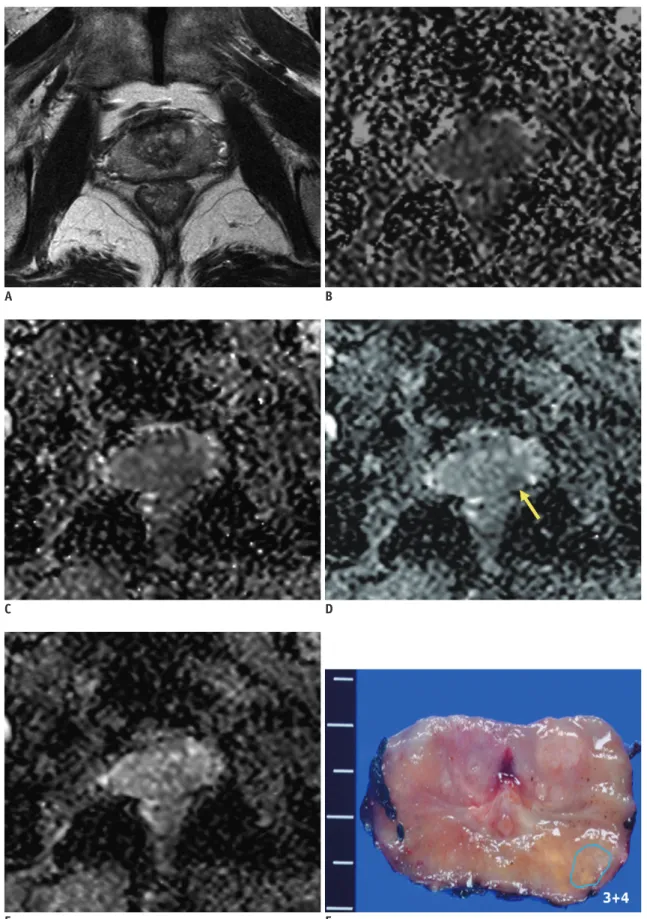
(5) Optimal B Values in DW MR Imaging for Prostate Cancer Evaluation. A. B. C. D. E F Fig. 1. Prostate cancer in left transition zone (TZ) in 72-year-old man.. A. Transverse T2-weighted turbo spine echo image shows ill-defined, low-signal lesions in both TZs. B-E. Transverse apparent diffusion coefficient (ADC) maps of b = 300 (B), 700 (C), 1000 (D) and 2000 s/mm2 (E) show focally restricted mass (arrow) in only left TZ (measured ADC of cancer = 1.57, 0.96, 0.88 and 0.69 x 10⁻³ mm2/s in sequence). Surgical specimen confirmed cancer in corresponding site on ADC maps.. kjronline.org. Korean J Radiol 14(1), Jan/Feb 2013. 65.
(6) Koo et al.. A. B. C. D. E F Fig. 2. Prostate cancer in peripheral zone (PZ) of left mid-gland in 71-year-old man.. A. Transverse T2-weighted turbo spin echo image shows ill-defined, low-signal lesions in both PZs. B-E. Transverse apparent diffusion coefficient (ADC) map of b = 1000 s/mm2 (D) shows well-delineated, restricted mass (arrow) in left PZ. However, mass is obscure on transverse ADC maps of b = 300 (B), 700 (C and 2000 (E) s/mm2. Surgical specimen confirmed cancer in left PZ.. 66. Korean J Radiol 14(1), Jan/Feb 2013. kjronline.org.
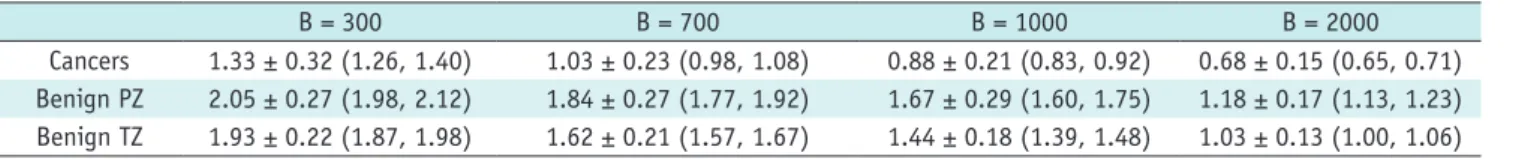
(7) Optimal B Values in DW MR Imaging for Prostate Cancer Evaluation. and 2000 s/mm2 was seen. For the less-experienced reader, the AUCs of b = 700 (0.65), b = 1000 (0.65) and b = 2000 s/mm2 (0.64) were significantly greater than at b = 300 s/ mm2 (0.59) (p < 0.01); no significant differences among b = 700, 1000 and 2000 s/mm2 were seen (p > 0.05). The inter-reader agreements between the experienced and less experienced reader were fair for all b values: b = 300 (κ = 0.22), b = 700 (κ = 0.25), b=1000 (κ = 0.27), b = 2000 s/ mm2 (κ = 0.27).. DISCUSSION Recently, prostate DWI at 3T has been widely used clinically (3, 9, 11-13). However, prostate DWI at 3T has several limitations to overcome. Among these, the lack of standardization of imaging parameters is a major problem. Many methods are applied for prostate DWI using various b values at many institutions (1). For standardization, it is crucially important to determine optimal values for factors in DWI, especially the b value, which is essential for producing high-quality ADC maps that affect the accuracy of ADC measurements and visual imaging interpretations (14). Thus, we sought to identify the optimal b value of prostate DWI for predicting prostate cancer locations. According to the results, the sensitivity and AUC for predicting prostate cancer location for the experienced reader were significantly greater with an ADC map of 1000 s/mm2 than with ADC maps of 300, 700 and 2000 s/mm2. These findings suggest that the optimal b value for prostate DWI at 3T is 1000 s/. 1.0. 1.0. 0.8. 0.8. 0.6. 0.6. Sensitivity. Sensitivity. Quantitative Analysis of DWI Table 3 presents mean ADC values at each b value for cancers and benign prostate tissue in PZ and TZ. Mean ADC values were measured for all 92 cancers. However, only 55 patients for benign PZ and 69 patients for benign TZ could be measured, because the borders between cancers and benign tissues were not well-delineated on the ADC maps. The mean ADC values (± standard deviation) of the cancers were 1.33 ± 0.32, 1.03 ± 0.23, 0.88 ± 0.21, and 0.68 ± 0.15 x 10⁻³ mm2/s in sequence from b = 300 to b = 2000 s/mm2. These values were significantly lower than those of benign. tissue in PZ or TZ (p < 0.001).. 300 AUC = 0.69 ± 0.02 700 AUC = 0.88 ± 0.02 1000 AUC = 0.91 ± 0.02 2000 AUC = 0.87 ± 0.02. 0.4. 0.2. 0.0. 0.4 300 AUC = 0.59 ± 0.02 700 AUC = 0.65 ± 0.02 1000 AUC = 0.65 ± 0.02 2000 AUC = 0.64 ± 0.02. 0.2. 0.0. 0.2. 0.4 0.6 1-Specificity. 0.8. 1.0. 0.0. 0.0. 0.2. 0.4 0.6 1-Specificity. 0.8. 1.0. A B Fig. 3. Results of ROC curve analyses for predicting prostate cancer location for experienced (A) and less-experienced (B) readers. AUC = area under curve, ROC = receiver operating characteristic. Table 3. Mean ADC Values for Cancers and Benign Prostate Tissues Cancers Benign PZ Benign TZ. B = 300 1.33 ± 0.32 (1.26, 1.40) 2.05 ± 0.27 (1.98, 2.12) 1.93 ± 0.22 (1.87, 1.98). B = 700 1.03 ± 0.23 (0.98, 1.08) 1.84 ± 0.27 (1.77, 1.92) 1.62 ± 0.21 (1.57, 1.67). B = 1000 0.88 ± 0.21 (0.83, 0.92) 1.67 ± 0.29 (1.60, 1.75) 1.44 ± 0.18 (1.39, 1.48). B = 2000 0.68 ± 0.15 (0.65, 0.71) 1.18 ± 0.17 (1.13, 1.23) 1.03 ± 0.13 (1.00, 1.06). Note.— ADC values (x 10-3 mm2/s) are expressed as mean ± standard deviation (95% confidence interval). ADC = apparent diffusion coefficient, PZ = peripheral zone, TZ = transition zone. kjronline.org. Korean J Radiol 14(1), Jan/Feb 2013. 67.
(8) Koo et al.. mm2 for predicting prostate cancer location. Thus, in clinical practice, the application of this optimal b value of 1000 s/ mm2 at 3T DWI using a phased-array coil might be expected to improve diagnostic performance for the qualitative or quantitative evaluation of prostate cancer. Until now, to the best of our knowledge, there have been no qualitative analyses using a variety of b values to improve the diagnostic ability of detecting prostate cancer. Instead, some studies compared the results of b values of 1000 and 2000 s/mm2 (4, 15). Their results were that additional values could not be obtained using a b value of 2000 s/mm2 over using a b value of 1000 s/ mm2. In contrast, a recent study (5) reported that the diagnostic performance of DWI using a b value of 2000 s/ mm2 was superior to that of 1000 s/mm2; however, that study used only index DWI for diagnostic criteria in cancer detection. Thus, their results are not surprising since the signal intensity of a normal prostate gland is very high and is often not suppressed using index DWI when using b values around 1000 s/mm2, due to T2-shine-through effects (1, 16). To overcome this persistent high signal within the prostate, several experts have used both index DWI and ADC maps in DWI interpretation to predict prostate cancer location (1, 16). In the qualitative analysis of the present study, the sensitivity and AUC for the prediction of prostate cancer at b value of 1000 s/mm2 were 85% and 0.91, respectively, for the experienced reader, which were significantly greater than at other b values. Although the specificity of b = 2000 s/mm2 was significantly greater than those of other b values, those of b = 300, 700 and 1000 s/mm2 were at least 92%, which might suggest that readings of prostate DWI are particularly useful to obtain high specificity. For the less-experienced reader, the sensitivity for the prediction of prostate cancer was as low as 45% at b = 1000 s/mm2, which was significantly greater than those at other b values; the AUCs were significantly greater at b = 700, 1000 and 2000 s/mm2 than at b = 300 s/mm2. Therefore, based on these qualitative analyses of the two readers, we believe that the optimal b value of DWI at 3T is 1000 s/mm2 for predicting prostate cancer. Possible explanations are suggested as follows: for b = 300 s/mm2, the signal intensity of background prostate parenchyma on ADC maps is too dark to differentiate the benign tissue from the cancer, possibly due to low difference in tissue diffusivity between cancer and benign tissue; for b = 2000 s/mm2, the decrease in SNRs within malignant or benign 68. tissue may affect the imaging quality of the ADC map; and for b = 700 s/mm2, although the results were similar at b = 1000 s/mm2, the signal intensity of background prostate parenchyma on the ADC map was slightly darker for b = 700 s/mm2, leading to inferior results for b = 1000 s/mm2. However, further studies should be performed because cancer detectability and reproducibility of these results in the present study depend on the DWI protocols as well as readers’ experience. To date, in the quantitative analyses, ADC values of prostate cancer and benign prostate tissues have shown varying results (4, 6-9). In the present study, the mean ADC values of prostate cancer and benign prostate tissues were different as compared with previous studies (4, 6-9), and particularly, the values of the present study in prostate cancer and benign prostatic tissues were lower, possibly due to the use of patients with different characteristics as well as different DWI parameters such as b values, TE or MR scanner. All values other than the b-value were fixed in DWI to eliminate their effects, and our results revealed that ADC values of benign and malignant tissues decrease with increasing b-values. These results agree with those of several previous studies of DWI. DeLano et al. (17) reported that ADC values decrease when b-values increase beyond 1000 s/mm2; Shinmoto et al. (18) showed that bioexponential diffusion decay functions were required for prostate cancer diffusion signal decay curves when sampled over an extended b value range. In the present study, although the mean ADC values of prostate cancer under different b values of DWI were significantly lower than those of benign prostatic tissues, considerable overlaps were found between the cancer and benign prostatic tissues. Particularly, low-grade prostate cancers had greater ADC values than intermediate- or highgrade cancers (19). As such, low-grade cancers might be more difficult for differentiation from benign prostate tissues. Therefore, we believe that the use of ADC values alone could result in the misdiagnosis of prostate cancer. This study has several limitations. First, correlations between DWI and step-section histopathologic findings might be difficult. Because surgical specimens often shrink after formaldehyde fixation, the alignment of MR images and step-section histopathologic findings was difficult. MR images of the prostate were not necessarily perpendicular to the prostatic urethra due to the orientation within the body. Second, this was a retrospective study. A larger, prospective study is warranted. Third, some patients had Korean J Radiol 14(1), Jan/Feb 2013. kjronline.org.
(9) Optimal B Values in DW MR Imaging for Prostate Cancer Evaluation. hemorrhages in the prostate after biopsy that may have affected the ADC values of benign prostate tissue and the diagnostic accuracy for the prediction of localized cancer. However, according to a recent study, even if 65% of the patients had hemorrhages in the prostate after biopsy, the effect on DWI was trivial (9). Fourth, our readers had different levels of experience with interpreting prostate MR imaging in predicting localized prostate cancer. Finally, we did not measure the SNRs in DWI with different b values. The SNR measurements in DWI using parallel imaging are complicated and difficult, especially in daily practice. A future study is needed. In conclusion, for predicting prostate cancer, the optimal b value for 3T DWI was found to be 1000 s/mm2.. REFERENCES 1. Kim CK, Park BK, Kim B. Diffusion-weighted MRI at 3 T for the evaluation of prostate cancer. AJR Am J Roentgenol 2010;194:1461-1469 2. Yakar D, Hambrock T, Huisman H, Hulsbergen-van de Kaa CA, van Lin E, Vergunst H, et al. Feasibility of 3T dynamic contrast-enhanced magnetic resonance-guided biopsy in localizing local recurrence of prostate cancer after external beam radiation therapy. Invest Radiol 2010;45:121-125 3. Turkbey B, Shah VP, Pang Y, Bernardo M, Xu S, Kruecker J, et al. Is apparent diffusion coefficient associated with clinical risk scores for prostate cancers that are visible on 3-T MR images? Radiology 2011;258:488-495 4. Kim CK, Park BK, Kim B. High-b-value diffusion-weighted imaging at 3 T to detect prostate cancer: comparisons between b values of 1,000 and 2,000 s/mm2. AJR Am J Roentgenol 2010;194:W33-W37 5. Katahira K, Takahara T, Kwee TC, Oda S, Suzuki Y, Morishita S, et al. Ultra-high-b-value diffusion-weighted MR imaging for the detection of prostate cancer: evaluation in 201 cases with histopathological correlation. Eur Radiol 2011;21:188-196 6. Pickles MD, Gibbs P, Sreenivas M, Turnbull LW. Diffusionweighted imaging of normal and malignant prostate tissue at 3.0T. J Magn Reson Imaging 2006;23:130-134 7. Haider MA, van der Kwast TH, Tanguay J, Evans AJ, Hashmi AT, Lockwood G, et al. Combined T2-weighted and diffusionweighted MRI for localization of prostate cancer. AJR Am J Roentgenol 2007;189:323-328 8. deSouza NM, Riches SF, Vanas NJ, Morgan VA, Ashley SA, Fisher C, et al. Diffusion-weighted magnetic resonance imaging: a potential non-invasive marker of tumour. kjronline.org. Korean J Radiol 14(1), Jan/Feb 2013. aggressiveness in localized prostate cancer. Clin Radiol 2008;63:774-782 9. Kim CK, Park BK, Lee HM, Kwon GY. Value of diffusionweighted imaging for the prediction of prostate cancer location at 3T using a phased-array coil: preliminary results. Invest Radiol 2007;42:842-847 10. Jager GJ, Ruijter ET, van de Kaa CA, de la Rosette JJ, Oosterhof GO, Thornbury JR, et al. Dynamic TurboFLASH subtraction technique for contrast-enhanced MR imaging of the prostate: correlation with histopathologic results. Radiology 1997;203:645-652 11. Oto A, Kayhan A, Jiang Y, Tretiakova M, Yang C, Antic T, et al. Prostate cancer: differentiation of central gland cancer from benign prostatic hyperplasia by using diffusion-weighted and dynamic contrast-enhanced MR imaging. Radiology 2010;257:715-723 12. Heo SH, Jeong YY, Shin SS, Kim JW, Lim HS, Lee JH, et al. Apparent diffusion coefficient value of diffusion-weighted imaging for hepatocellular carcinoma: correlation with the histologic differentiation and the expression of vascular endothelial growth factor. Korean J Radiol 2010;11:295-303 13. Moon WJ, Lee MH, Chung EC. Diffusion-weighted imaging with sensitivity encoding (SENSE) for detecting cranial bone marrow metastases: comparison with T1-weighted images. Korean J Radiol 2007;8:185-191 14. Saritas EU, Lee JH, Nishimura DG. SNR dependence of optimal parameters for apparent diffusion coefficient measurements. IEEE Trans Med Imaging 2011;30:424-437 15. Kitajima K, Kaji Y, Kuroda K, Sugimura K. High b-value diffusion-weighted imaging in normal and malignant peripheral zone tissue of the prostate: effect of signal-tonoise ratio. Magn Reson Med Sci 2008;7:93-99 16. Rosenkrantz AB, Kong X, Niver BE, Berkman DS, Melamed J, Babb JS, et al. Prostate cancer: comparison of tumor visibility on trace diffusion-weighted images and the apparent diffusion coefficient map. AJR Am J Roentgenol 2011;196:123-129 17. DeLano MC, Cooper TG, Siebert JE, Potchen MJ, Kuppusamy K. High-b-value diffusion-weighted MR imaging of adult brain: image contrast and apparent diffusion coefficient map features. AJNR Am J Neuroradiol 2000;21:1830-1836 18. Shinmoto H, Oshio K, Tanimoto A, Higuchi N, Okuda S, Kuribayashi S, et al. Biexponential apparent diffusion coefficients in prostate cancer. Magn Reson Imaging 2009;27:355-359 19. Hambrock T, Somford DM, Huisman HJ, van Oort IM, Witjes JA, Hulsbergen-van de Kaa CA, et al. Relationship between Apparent Diffusion Coefficients at 3.0-T MR Imaging and Gleason Grade in Peripheral Zone Prostate Cancer. Radiology 2011 [Epub ahead of print]. 69.
(10)
수치
관련 문서
Consequently, Zr-Cu binary alloys have the potential to be used as biomaterials with nullifying magnetic properties for magnetic resonance imaging diagnosis and
Utility of T1-and T2-weighted high-resolution vessel wall imaging for the diagnosis and follow up of isolated posterior inferior cerebellar artery dissection with
(3) Using the different importance levels of each criterion for the given alternative and the elements of the fuzzy global decision matrix, the fuzzy evaluation value
Selection of optimal prostate specific antigen cutoffs for early detection of prostate cancer: receiver operating characteristic curves.. Polascik TJ, Oesterling JE,
웹 표준을 지원하는 플랫폼에서 큰 수정없이 실행 가능함 패키징을 통해 다양한 기기를 위한 앱을 작성할 수 있음 네이티브 앱과
_____ culture appears to be attractive (도시의) to the
The “Asset Allocation” portfolio assumes the following weights: 25% in the S&P 500, 10% in the Russell 2000, 15% in the MSCI EAFE, 5% in the MSCI EME, 25% in the
1 John Owen, Justification by Faith Alone, in The Works of John Owen, ed. John Bolt, trans. Scott Clark, "Do This and Live: Christ's Active Obedience as the
