kfas
9
0
0
전체 글
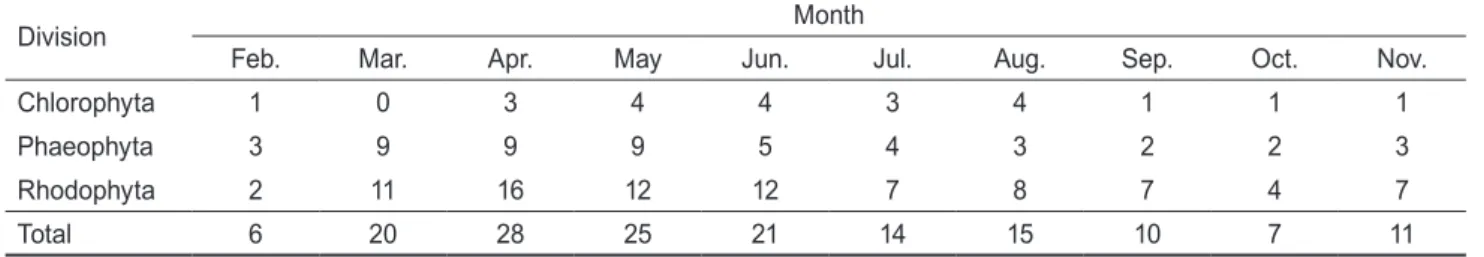
(2) 263. 동해 비화 조하대 해조류 군집구조의 계절적 변화. 재료 및 방법 조사지 개황 삼척시의 비화해역은 조석간만의 차이가 남.서해 연안에 비 해 적은 반면에 외해의 형태를 가지고 있어 조류 흐름이 최대 0.5 m/s 이상으로 비교적 강한 흐름을 보인다. 수온은 동해 저층냉수의 변동에 따라 계절적으로 온도차가 매우 크며, 특 히 표.저층 간의 수온 차이가 크다(NFRDI, 2008; 2009). 조 사 해역은 대부분 외해와 연결되어 있어 해류의 흐름이 원활 하며 저층은 암반 및 암초 지역이 잘 발달되어 있어 갯녹음이 발생하기 이전에 갈조류인 미역(Undaria pinnatifida), 다시 마(Saccarina japonica), 모자반류(Sargassum spp.) 등과 같 은 대형 해조류가 풍부하게 서식하였다(Jang, 1994).. 해조상 해조상 및 해조류의 군집구조에 대한 조사는 동해 중북부 삼 척시 비화연안(N 37° 12´, E 129° 20´)에서 2006년 2월부터 2006년 11월까지 10회에 걸쳐 월별로 실시되었다. 생물량 측 정을 위한 정량 조사는 조하대 수심 5, 10, 15 m에 10 cm×10 cm로 구획된 방형구(50 cm×50 cm)를 3개씩 놓고, 방형구 내에 출현하는 해조류를 끌칼을 이용하여 채집하였다. 채집 된 재료는 현장에서 10% 포르말린-해수 용액으로 고정하여 실험실로 운반한 후 현미경 검경을 통해 동정하였으며, 출현 종의 목록 및 국명은 Lee and Kang (2002)에 따랐다. 생물량 은 방형구별로 채집된 분류군 중에서 피도가 2% 이상인 해조 류를 담수로 깨끗이 씻어서 모래 등의 이물질을 제거한 후 종 별로 습중량을 0.1 g 수준까지 측정하였고, 이 자료를 단위면 적당 생물량(g wet wt m-2)으로 환산하여 계산하였다.. 군집구조 연구 해역의 해조류 군집의 생태학적 지수는 조사시기별 로 출현한 해조류의 종별 평균 생물량과 종수를 근거로 하. 여 Margalef (1958)의 풍도지수(richness index, R), Shannon (1948)의 다양도지수(diversity index, H'), Pielou (1969)의 균등도지수(evenness index, J')와 McNaughton (1967)의 우 점도지수(dominance index)를 구하고 각 정점의 유사도(similarity)를 분석하였다(Bray and Curtis, 1957). 생물량 자료를 변환(Square root transformation)하여 유사도를 분석하였으 며, 그룹간 유의차 유무는 SIMPROF (similarity profile) test 로 검정하였다. 또한, 그룹 간 유의차가 확인되면 SIMPER (Similarity percentage) 분석을 실시하여 각 그룹 간 비유사 도(dissimilarity)에 기여하는 종을 확인하였다. 군집분석은 PRIMER version 6 (Clarke and Gorley, 2006)를 이용하여 산출 및 도식화 하였다.. 성게류 밀도 조사 해조류의 정량 채집과 함께 동일 방형구에 출현하는 성게류 를 전량 채집하여 종별 밀도(individ. m-2)를 측정하였다. 채 집된 성게류의 분류 및 동정은 Shin (2011)의 방법에 따랐다.. 결. 과. 해조류 종조성 본 연구기간에 비화해역에서 출현한 해조류는 총 57종(녹조 7종, 갈조 15종, 홍조 35종)이었으며, 분류군별로 녹조류가 12.28%, 갈조류가 26.32%, 홍조류가 61.40%를 차지하여 홍 조류, 갈조류, 녹조류 순으로 출현비율을 보였다(Table 1). 전 체 조사정점의 월별 해조류 출현종수는 6-28종으로서 4월에 최대였고 2월에 최소였다(Table 2). 10회 조사 중 갈조류 야키 시리구멍쇠미역(Agarum clathratum)이 9회 관찰되었으며, 홍조류 잔금분홍잎(Acrosorium polyneurum)과 누은분홍잎 (Acrosorium yendoi)이 8회 출현하여 높은 출현율을 나타냈 다. 이외에도 미역(U. pinnatifida), 청각(Codium fragile), 우 뭇가사리(Gelidium amansii), 모로우붉은실(Polysiphonia 1000. Biomass (g wet wt/m2). 배제하고 단순히 해조류의 고사, 소멸에 의한 피도를 바탕으 로 갯녹음을 판단하였다. 동해안의 해조류에 대한 연구는 대부분이 접근이 용이한 조간대를 대상으로 수행되었으며(Boo and Lee, 1986; Boo, 1987; Lee and Lee, 1988; Lee et al., 1993; Lee and Kim, 1999), 조하대 해조군집에 관한 연구는 매우 드물며(Chung et al., 1991; Shin et al., 2008a, b; Choi et al., 2009), 수행되 었다 하더라도 해조상 및 군집구조에만 초점이 맞추어져, 조 식동물(성게류)에 관한 연구는 수행되지 않았다. 따라서, 본 연구는 갯녹음 해역으로 분류된 삼척시 비화연안의 조하대 해 조상 및 군집구조와 조식동물(성게류) 밀도의 관계를 바탕으 로 갯녹음 해역의 특징을 밝히고자 한다.. 800. Undaria pinnatifida. Sargassum Horneri. Delesseria serrulata. Codium fragile. polysiphonia morrowii. Other species. 600 400 200. 0. Feb.. Mar. Apr.. May.. Jun.. Jul.. Month. Aug. Sep.. Oct.. Nov.. Fig. 1. Monthly variations of the average biomass (g wet wt m-2) of dominant seaweeds on the subtidal rocky shore of Bihwa, Korea (2006. 2-11)..
(3) 김영대 . 박미선 . 유현일 . 민병화 . 진형주. 264. Table 1. Marine algal lists and biomass (g wet wt m-2) occurred at Bihwa in east coast of Korea Species Chlorophyta Ulva japonica Ulva pertusa Ulva sp. Cladophora sakaii Codium arabicum Codium fragile Phaeophyta Leathesia difformis Colpomenia bullosa Colpomenia sinuosa Desmarestia ligulata Desmarestia viridis Undaria pinnatifida Agarum clathratum Dictyopteris undulata Dictyota dichotoma Dictyota linearis Tinocladia crassa Pachydictyon coriaceum Sargassum sp. Sargassum confusum Sargassum horneri Rhodophyta Porphyra sp. Delisea pulchra Galaxaura falcata Bossiella cretacea Amphiroa anceps Gelidium sp. Gelidium amansii Asparagopsis taxiformis Bonnemaisonia hamifera Gloiopeltis tenax Chondracanthus tenellus Grateloupia elliptica Grateloupia sparsa Grateloupia turuturu Tichocarpus crinitus Plocamium telfairiae Gracilaria gigas Chondrus ocellatus Rhizoclonium sp. Rhodymenia intricata Rhodymenia pertusa Lomentaria catenata Chrysymenia wrightii Ptilota serrata Acrosorium sp. Acrosorium polyneurum Acrosorium yendoi Delesseria serrulata Dasya sessilis Champia expansa Chondrophycus intermedia Laurencia pinnata Polysiphonia morrowii Symphyocladia latiuscula Symphyocladia linearis Symphyocladia pennata. Month. Feb.. Mar.. Apr.. May. 2.87. 6.19 32.08. 0.1 0.77. 0.97 1.47 0.1 3.7. 18.08 48.48. 1.61 0.03. 1.53. 9.84 2.42. 340 8.67 0.08 0.12 2.92. 0.11. Jun.. 46.97 17.78 1.2. Jul.. Aug.. 0.45 0.02. 0.07. 2.22. 0.63. 7.1. 50.73 6.23. 2.58. 7.34. 60.56 269.6 1.08. 0.57 0.17. 0.31. 0.34. 264.8. 0.16. 0.19 0.09 1.28. 121.8 5.34. 0.29 0.28. 0.47. 0.64. 10.82 0.01. 15.46 0.08 0.37 44.98 0.78. 8.2. 13.04. 0.91 1.13 62.77 0.22. 41.17. 56.5. 16.13. 18.78. 131 31.84. 14.33 31.84. 3.31. 2.77. 1.25 0.35. 1.81 227.6. 0.32. 0.3. 0.19. 4.1. 1.28. 2.92. 0.04 3.93. 1.39 1.35. 8.26 0.2. 0.3. 0.97. 0.92. 0.91 0.08. 1.38 1.35. 0.02. 1.77. 1.46. 1.94 3.4 0.01. 0.13 0.36. 0.66. 0.66 0.12. 0.41. 0.31. 13.07 0.1 5.74. 0.03 0.44 0.7 0.2. 1.04. 0.49 4.57. 0.13 17.51 0.09 0.28. 0.42 0.13 24.5. 0.22. 0.21. 0.57. 21.07. Nov.. 8.17. 0.26. 0.79. Oct.. 0.1 0.97 0.04. 0.02 0.09. Sep.. 0.06 3.16. 0.48 2.04 60.76. 7.44 0.59 5.66. 0.11 44.36. 4.44. 5.38. 49.77 0.04. 0.37. 0.04.
(4) 265. 동해 비화 조하대 해조류 군집구조의 계절적 변화. Table 2. The number of seaweed species collected at Bihwa in east coast of Korea Month. Division. Feb.. Mar.. Apr.. May. Jun.. Jul.. Aug.. Sep.. Oct.. Nov.. Chlorophyta. 1. 0. 3. 4. 4. 3. 4. 1. 1. 1. Phaeophyta. 3. 9. 9. 9. 5. 4. 3. 2. 2. 3. Rhodophyta. 2. 11. 16. 12. 12. 7. 8. 7. 4. 7. Total. 6. 20. 28. 25. 21. 14. 15. 10. 7. 11. Table 3. Indices of seaweed community structure from Feb. to Nov. 2006 at the coast of Bihwa, Korea Community indices. 2006 Feb.. Mar.. Apr.. May. Jun.. Jul.. Aug.. Sep.. Oct.. Nov.. Dominance index (DI). 0.82. 0.59. 0.80. 0.59. 0.60. 0.85. 0.67. 0.92. 0.76. 0.80. Richness index (R). 1.40. 3.76. 4.07. 3.80. 3.54. 2.15. 3.16. 2.14. 1.83. 3.10. Evenness index (J'). 0.63. 0.61. 0.42. 0.55. 0.60. 0.46. 0.59. 0.28. 0.66. 0.45. Diversity index (H'). 1.13. 1.82. 1.41. 1.75. 1.84. 1.20. 1.61. 0.64. 1.28. 1.09. morrowii)이 60%이상의 출현율을 보였다(Table 1).. 생물량 및 우점종 연구기간 동안, 비화해역의 해조류 생물량(g wet wt m-2) 은 평균 241.90 g (25.26-760.34 g)으로 4월에 최대였고, 11월에 최소였다. 분류군별 평균 생물량은 녹조류 23.61 g (9.76%), 갈조류 169.19 g (69.94%), 그리고 홍조류가 49.10 g (20.30%)으로 갈조류가 가장 높은 비율을 차지하였다. 월 별 총 생물량에 대한 녹조류의 비율은 0.00-84.82%로 9월부 터 11월까지 분류군중 가장 높은 생물량을 보였고, 갈조류는 5.30-94.68%로 3월부터 8월까지 우점분류군이었다. 홍조류 는 3.52-82.29%로 2월에만 최대 생물량을 보이는 우점 분류 군으로 확인되었다. 비화해역의 생물량을 토대로 한 우점종은 연평균 88.66 g의 생물량을 보인 미역(U. pinnatifida)이었으며, 준우점종은 괭. Biomass (g wet wt/m2). 1000 800. Undoria pinnatifida. Sargassum horneri. Delesseria serrulata. Codium fragile. Polysiphonia morrowii. Other species. 600 400 200 0 5. 10 Depth (m). 15. Fig. 2. Vertical distribution of the average biomass (g wet wt m-2) of dominant seaweeds on the subtidal rocky shore of Bihwa, Korea (2006. 2-11).. 생이모자반(Sargassum honeri, 49.32 g)이었다. 이외에도 보 라잎(Delesseria serrulata)과 청각(C. fragile)이 연평균 10 g 이상의 생물량을 보였다(Table 1). 월별 우점종과 준우점종 은, 2월에 모로우붉은실(P. morrowii)과 참산말(Desmarestia ligulata), 3월에 보라잎(D. serrulata)과 참산말(D. ligulata) 이, 4월에는 미역(U. pinnatifida)과 괭생이모자반(S. honeri) 이었다. 5. 6, 7월에는 괭생이모자반(S. honeri)이 우점종이 었으며 준우점종은 각각 보라잎(D. serrulata), 가는보라색 우무(Symphyocladia linearis), 괭생이모자반(S. honeri)이 었다. 8월에는 야키시리구멍쇠미역(Agarum clathratum)이 우점하였으며 준우점종은 청각(C. fragile)이었다. 9, 10, 11 월에는 8월에 준우점종이었던 청각(C. fragile)이 우점하는 것으로 확인되었고 준우점종은 각각 굵은마디말(Bossiella cretacea), 알쏭이모자반(Sargassum confusum), 참곱슬이 (Plocamium telfairiae)로 확인되었다(Fig. 2). 수심별 생물량은 수심 5 m에서 422.08 g, 10 m에서 213.27 g, 15 m에서 91.26 g을 보여 수심 5 m에서 가장 높은 생물량 을 보였고 수심이 깊어짐에 따라 감소하였다. 수심별 우점종 과 준우점종은 수심 5 m에서 미역(U. pinnatifida, 184.92 g) 과 괭생이모자반(S. honeri, 79.45 g)으로서 비화 전 해역의 우점종 및 준우점종과 일치하였으며, 10 m에서는 준우점종 이던 괭생이모자반(S. honeri, 68.42 g)이 우점하었고 우점종 인 미역(U. pinnatifida, 49.13 g)이 준우점하였다. 반면 15 m 에서는 미역(U. pinnatifida, 32.28 g)이 우점종이었으며, 야 키시리구멍쇠미역(A. clathratum, 25.72 g)이 준우점하는 것 으로 확인되었다(Fig. 2 ). 정점의 출현종과 종별 평균 생물량 자료로 집괴분석을 한 결과 통계적 유의차를 보이는 5개 그룹 즉, A그룹(2월), B그 룹(9월), C그룹(10, 11월), D그룹(7, 8월), E그룹(3, 4, 5, 6월) 으로 구분되었다(Fig. 5A, B). 각 그룹의 유사도를 보면 9월.
(5) 266. 김영대 . 박미선 . 유현일 . 민병화 . 진형주. Table 4. SIMPER analysis showing the contribution (%) of each species for dissimilarity between each Group Mean abundance (gwet wt./m2) Species Group A Group B Group A and B: Average dissimilarity = 100.00 Codium fragile 0 7.52 Grateloupia sparsa 4.59 0 Polysiphonia morrowii 2.86 0 Bossiella cretacea 0 2.14 Desmarestia ligulata 1.92 0 Agarum clathratum 0 1.82 Group A Group C Group A and C: Average dissimilarity = 94.90 Grateloupia sparsa 4.59 0 Codium fragile 0 4.17 Polysiphonia morrowii 2.86 0.6 Desmarestia ligulata 1.92 0 Sargassum confusum 0 1.52 Agarum clathratum 0 1.39 Plocamium telfairiae 0 1.27 Undaria pinnatifida 1.24 0 Group A Group D Group A and D: Average dissimilarity = 93.49 Sargassum horneri 0 7.83 Agarum clathratum 0 5.64 Undaria pinnatifida 1.24 7.62 Grateloupia sparsa 4.59 0 Codium fragile 0 3.81 Polysiphonia morrowii 2.86 0 Group E Group B Group E and B: Average dissimilarity = 89.53 Undaria pinnatifida 12.26 0 Codium fragile 0.57 7.52 Delesseria serrulata 6.2 0 Sargassum horneri 4.31 0 Ulva pertusa 3.55 0 Polysiphonia morrowii 3.8 0 Groups E Group C Group E and C: Average dissimilarity = 89.37 Undaria pinnatifida 12.26 0 Delesseria serrulata 6.2 0 Codium fragile 0.57 4.17 Sargassum horneri 4.31 0 Ulva pertusa 3.55 0 Desmarestia ligulata 2.46 0 Group A Group E Group A and E : Average dissimilarity = 85.13 Undaria pinnatifida 1.24 12.26 Delesseria serrulata 0 6.2 Grateloupia sparsa 4.59 0.6 Sargassum horneri 0 4.31 Ulva pertusa 0 3.55 Group E Group D Group E and D: Average dissimilarity = 70.13 Sargassum horneri 4.31 7.83 Undaria pinnatifida 12.26 7.62 Delesseria serrulata 6.2 0.05 Agarum clathratum 1.96 5.64 Codium fragile 0.57 3.81 Ulva pertusa 3.55 0.07 Polysiphonia morrowii 3.8 0 Group D Group B Group D and B: Average dissimilarity = 65.17 Undaria pinnatifida 7.62 0 Sargassum horneri 7.83 0 Agarum clathratum 5.64 1.82 Codium fragile 3.81 7.52 Bossiella cretacea 0 2.14 Acrosorium polyneurum 2.13 0.37 Group D Group C Group D and C: Average dissimilarity = 63.71 Undaria pinnatifida 7.62 0 Sargassum horneri 7.83 0 Agarum clathratum 5.64 1.39 Sargassum confusum 0 1.52 Group B Group C Group B and C: Average dissimilarity = 43.64 Codium fragile 7.52 4.17 Bossiella cretacea 2.14 0.28 Sargassum confusum 0 1.52 Plocamium telfairiae 0.15 1.27 Delisea pulchra 0.7 0 Polysiphonia morrowii 0 0.6. Contribution (%). Cumulative contribution (%). 27.98 17.09 10.66 7.95 7.16 6.77. 27.98 45.07 55.73 63.68 70.84 77.61. 20.56 18.7 10.14 8.62 6.84 6.24 5.68 5.55. 20.56 39.26 49.4 58.01 64.85 71.1 76.78 82.33. 14.55 13.41 13.02 10.91 9.69 6.81. 14.55 27.96 40.98 51.89 61.58 68.39. 17.19 11.02 9.51 5.54 5.13 5. 17.19 28.2 37.71 43.26 48.38 53.38. 18 10.02 6.08 5.78 5.37 5.19. 18 28.01 34.09 39.87 45.24 50.43. 16.67 10.47 6.87 6.04 5.62. 16.67 27.14 34.01 40.05 45.67. 11.11 10.41 9.41 5.81 5.36 5.18 5.18. 11.11 21.52 30.93 36.73 42.09 47.27 52.45. 21.56 19.82 12.17 11.01 6.8 5.11. 21.56 41.38 53.55 64.56 71.37 76.48. 23.58 21.47 14.93 5.36. 23.58 45.05 59.98 65.34. 28.84 16.08 13.17 9.66 6.04 5.17. 28.84 44.92 58.09 67.75 73.79 78.97.
(6) 267. 동해 비화 조하대 해조류 군집구조의 계절적 변화. 과 10월은 83.44%의 유사도를 가지는 그룹 C였으며, 6월과 7월(그룹 D)은 53.87%로, 2, 3, 4, 5월(그룹 E)은 26.58% 이 상의 유사도로 각각 하나의 그룹으로 묶였다. 그룹 B와 C는 56.36%의 유사도로 구분되었으며, 그룹 B와 C는 그룹 D와 31.81%의 유사도로 구분되었다. 또한 B, C, D는 그룹 E와 18.29%로, 그룹 B, C, D, E는 그룹 A와 9.19%의 유사도로 구분되어 총 5개의 유의한 차이를 보이는 그룹으로 구분되었 다(Fig. 3; SIMPROF test, P<0.05). Bray Curtis similarity와 SIMPROF test에 의해 구분된 다섯 그룹의 그룹 간의 차이를 나타내는 종을 확인하기 위해 SIMPER 분석을 실시하여 비. 유사성(disimilarity)에 기여하는 종을 확인한 결과는 Table 4 와 같다. 각 그룹간 비유사도는 43.64-100.00%로 A와 B의 비유사도가 100%로 가장 높았고, 그룹 B와 C간의 비유사도 가 가장 낮았다. 그룹 A와 B의 비유사도에 기여도가 가장 높 은 종은 27.98%의 기여도를 보인 청각(C. fragile) 이었고, 명 주지누아리(Grateloupia sparsa, 17.09%), 모로우붉은실(P. morrowii, 10.66%), 굵은마디말(B. cretacea, 7.95%), 참산 말(D. ligulata, 7.16%), 야키시리구멍쇠미역(A. clathratum, 6.77%)이 기여도 5%이상으로 그룹 간의 차이를 나타내는 종 이었다. 반면 비유사도가 가장 낮은 그룹 B와 C의 비유사. Transform: Square root Resmblance: S17 Bray Curtis similarity. 0. (A). 2D Stress. 0.05. May. Similarity. (B). 20. Apr. 20. 53. Jul. Similarity. 80 A. 40. Jun. Mar. B C. Aug. D E. 60. Oct. C. D. Feb. May.. Apr.. Jun.. Mar.. Aug.. Jul.. B. Nov.. A. Oct.. Sep.. 100. Feb.. 80. E. Month. Fig. 3. Cluster (A) and MDS (B) analysis performed based on Bray-Curtis similarity of square root transformed seaweed floras and biomass. 40 Strongylocentrotus intermedius. Stongylocentrotus nudus. 2. Density (individuals/m ). 35. Hemicentrotus pulcherrimus. 30. 도에 기여도가 가장 큰 종은 28.84%의 기여도를 보인 청각 과 굵은마디말(B. cretacea, 16.08%)이었으며, 알쏭이모자반 (S. confusum, 13.17%), 참곱슬이(P. telfairiae, 66%), 나도 꿩꼬리(Delisea pulchra, 6.04%), 모로우붉은실(P. morrowii, 5.17%)이 5% 이상의 기여도를 보였다(Table 4).. 25. 군집지수. 20 15 10 5 0 Feb.. Mar.. Apr.. May.. Jun.. Jul.. Aug. Sep.. Oct.. Nov.. Month. Fig. 4. Monthly variations of sea urchin density in the subtidal rocky shore of Bihwa, Korea (2006. 2-11).. 해조류의 생물량을 이용하여 산출한 다양한 군집지수를 살 펴보면, 우점도 지수(DI)는 0.59-0.92의 범위로, 제 1, 2우점 종인 청각(C. fragile, 56.50 g)과 알쏭이모자반(S. confusum, 4.57 g)이 전체 생물량(66.61 g)의 91.68%를 차지하여 최대 (0.92)였고 3월과 5월에 각각 참산말(D. ligulata), 보라잎(D. serrulata)과 미역(U. pinnatifida)과 보라잎(D. serrulata)이 제 1, 2우점종으로 전체 생물량의 59.35%와 59.18%를 차지 하여 0.59로 최저였다. 출현종수와 관련된 풍도지수(R)는 가 장 많은(28종) 해조류가 출현한 4월에 가장 높은 값(4.07)을, 최소 출현종수를 보인 2월(6종)에 가장 낮은 값(1.40)을 보 였다. 출현종수와 생물량에 따라 변화하는 균등도지수(J')는.
(7) 1000. 30. 2. Sea urchins. -2. Seaweed Biomass (g wet wt m ). Seaweed. 25. 800. 20 600 15 400 10 200. Sea urchins Density (individuals/m ). 김영대 . 박미선 . 유현일 . 민병화 . 진형주. 268. 5. 0. 0 Feb. Mar. Apr. May. Jun. Jul. Aug. Sep. Oct. Nov.. Month. Fig. 5. The relationship of both the number of sea urchin and the biomass of seaweeds in the subtidal rocky shore of Bihwa, Korea (2006. 2-11). 0.28-0.66으로 제 1 우점종이 전체 생물량의 84.82%를 차지 한 9월에 가장 낮았고, 제 1 우점종이 전체 생물량의 60.30% 를 차지한 10월에 비교적 다양한 해조류의 생물량이 고루 분 포함으로 인하여 가장 높았다. 출현종수와 종간 생물량의 분 포인 균등도지수에 의해 결정되는 다양도지수(H')는 0.641.84의 범위로 제 1, 2 우점종이 생물량의 대부분을 차지하고 출현종수 또한 매우 적은 9월(10종)에 최저였고 21종의 해조 류에 생물량이 비교적 고루 분포한 6월에 최대였다(Table 3).. 성게류 밀도 조사기간 동안 출현한 성게류는 총 3종이 출현하였다. 조사 시기별 밀도는 8-24 individ. m-2으로 평균 18.5 individ. m-2 로 4월에 가장 낮은 밀도를 보였고 7월에 가장 높은 밀도를 보였다(Fig. 4, 5).. 고. 찰. 해조류는 해양생태계의 일차생산자로서 다양한 해양생물 의 산란장, 은신처, 성육장을 제공하며 먹이원으로 이용되기 도 한다(Ohno et al., 1990; Watanuki and Yamamoto, 1990; Tsutsui et al., 1996). 해조류는 암반에 부착하여 서식하며 조 식동물과 같은 생물학적 요인과 무생물학적(광, 파도 등) 요 인에 의해 출현종 및 군집구조 변화하는 특징으로 인해 생물 지시자(bio-indicator)로 이용된다(Arévalo et al., 2007). 최 근 전세계 연안의 해조류 생물량은 지속적으로 감소하고 있 으며(Yoo et al., 2004), 그 이유로 해수온 상승, 조식동물 등 이 거론되고 있다(Figueiredo et al., 1996; Choi et al., 2002). 갯녹음 해역은 해조류의 출현종수와 생물량이 감소하는 특 징을 보인다(Chung et al., 1998; Terawaki et al., 2001). 비화. 에서 출현한 해조류는 총 57종(녹조 7종, 갈조 15종, 홍조 35 종)으로 인근의 울진(87종)과 대진(73종)의 65.5%, 78.1% 수 준이었다(Choi et al., 2006; Kim et al., 2010). 해조류의 생물 량에 있어서도 비화해역은 평균 241.90 g으로 대진해역(평균 2,852.31 g)의 18.5%수준으로 나타났다. 이와 같이 인근의 다른 지역에 비해 해조류의 출현종수 및 생물량이 낮은 것으 로써 볼 때, 비화해역은 갯녹음의 특징을 나타내고 있으며 갯 녹음이 진행되고 있는 것으로 판단된다. 비화연안에서의 수 심별 생물량(g wet wt m-2)은 수심 5 m에서 422.08 g, 10 m에 서 213.27 g, 그리고 15 m에서 91.26 g으로 수심이 깊어질수 록 급속히 감소하는 경향을 보였다. 울진 해역의 경우, 수심 3 m에서 4,004.54 g을, 6 m에서 1,146.77 g, 9 m에서 394.67 g, 그리고 12 m에서 368.44 g으로 수심에 따라 생물량이 감 소하였다(Choi et al., 2006). 이러한 경향은 동해안의 수심에 따른 수온과 광량 감소 때문으로 판단된다(NFRDI, 2007). 이전에 수행된 동해안 해조상 보고에서 우점종과 준우점 종을 살펴보면, 대진의 경우 계절에 따라 차이가 있으나 일 반적으로 작은구슬산호말(Corallina pilulifera)과 왜모자반 (Sargassum yezoense)이 우점하였으며, 진두발(Chondrus ocellatus)과 괭생이모자반(S. honeri)이 준우점하였다. 또 한 죽변의 경우 무절산호조류(Melobesiodean algae)를 제외 하고 작은구슬산호말(C. pilulifera), 잔금분홍잎(A. polyneurum), 꽈배기모자반(Sargassum siliquastrum)과 톳(Hizikia fusiformis)이 우점 또는 준우점종으로 알려졌다(Shin et al., 2008a). 반면 대진과 죽변 사이에 위치한 비화에서는 연평균 88.66 g의 생물량을 보인 미역(U. pinnatifida)이 우점종이었 고 준우점종은 괭생이모자반(S. honeri, 49.32 g)이었다. 이 외에도 보라잎(D. serrulata)과 청각(C. fragile)이 연평균 10 g 이상의 생물량을 보여 지역에 따른 차이를 나타냈다(Table 1). 출현종과 종별 생물량을 바탕으로 산출한 월별 유사도를 보 면 10회의 조사가 유의성 있는 5개 그룹으로 구분되었다. 각 그룹간 비유사도는 43.64-100.00%로 1월과 9월 조사에서 비 유사성이 가장 높았고, 10월과 11월 조사의 비유사성이 가장 낮았다. 각 그룹간 차이에 있어 기여도가 높은 종을 기준으로 그룹간 차이를 나타내는 종을 확인해보면, 그룹 A는 명주지 누아리(G. sparsa)의 출현과 높은 생물량에 의해 다른 그룹과 구분되었었고, 그룹 B와 C는 청각(C. fragile)의 기여도가 가 장 높았고, 그룹 D는 괭생이모자반(S. honeri), 그룹 E는 미 역(U. pinnatifida)의 높은 생물량에 의해 다른 그룹과 구분되 었다(Table 4). 각 그룹간 비유사도에 기여도가 가장 높은 종 으로 확인된 4종의 해조류 중 명주지누아리를 제외한 3종이 일년생(annual)해조류로 확인되어(Kim et al., 2011) 비화해 역은 한 계절에만 출현하는 계절종에 의해 군집이 구성됨으 로 조사시기별 변화가 큰 것으로 나타났다. 연안의 해조류가 사라지는 갯녹음에 대한 정의는 명확하 게 되어 있는 반면 원인과 진단 기준은 불분명하다(Fujita, 2010). Fujita et al. (2008)은 단순히 해조류가 사라지는 현.
(8) 동해 비화 조하대 해조류 군집구조의 계절적 변화. 상을 갯녹음이라 하였으며 해조상이나 군집구조의 변화에 대 한 연구는 수행하지 않았다. 본 연구에서는 해조류 군집구조 및 종조성에 영향을 미쳐 갯녹음을 유발할 것으로 추정되는 성게의 밀도를 해조류 군집조사와 병행하였다. 성계류의 밀 도는 평균 18.5 individ. m-2 로 매우 높았으며, 4월에 최소 (8 individ. m-2), 7월에 최대(24 individ. m-2)였다. 성계류의 밀도와 해조류 생물량과의 관계를 보면, 성게류 밀도가 5-6 individ. m-2 이상이면 해조류 생물량이 감소하며(Fisheries Agency, 2007), 10 individ. m-2 이상이면 해조류의 서식이 어렵다고 알려져 있다(Fujita et al., 2008; Ling et al. 2010). 본 연구의 경우 성계류의 밀도가 최소인 4월에 해조류 생물 량이 급증하였고, 이후 성계류 밀도가 10 individ. m-2 이상 이 되면 해조류의 생물량은 지속적으로 감소하였다(Fig. 5). 따라서 성게류 밀도가 10 individ. m-2 이상인 시기의 해조류 생물량 감소는 성게류의 섭이에 의한 것이라 사료된다(Fujita et al., 2008; Ling et al. 2010). 또한, 성게 1마리는 하루에 10-16 g 의 해조류를 섭이하므로써(Kawamata, 1998), 고밀 도의 성게는 해조류 발생과 군집유지에 부정적인 영향을 미 칠 것으로 판단된다(Fujita, 2010). 이러한 성계류 증가의 원 인은 대구, 해달 등의 성계류에 대한 천적이 감소되었기 때문 으로(Steneck et al., 2002; Hereu et al. 2005), 해조류 군집과 조식동물과의 비율은 해조군집 유지에 주요한 요소로 사료된 다(Kim et al. 2007). 결론적으로, 비화의 해조류 출현종수 및 생물량이 주변 다 른 해역에 비해 매우 적은 반면 조식동물인 성게류의 밀도가 매우 높은 것으로 나타나 향후 해조류의 감소가 예상되고 갯 녹음이 더욱 심해질것으로 판단된다.. 사. 사. 본 연구는 국립수산과학원“어항을 활용한 다영양입체양식 기술 개발 적용”과제의 연구비 지원에 의해 이루어졌습니다. 또한, 논문작성에 많은 도움을 주신 동해수산연구소 연구원 분들께 감사의 뜻을 전합니다.. 참고문헌 Arévalo RS, Pinedo S and Ballesteros E. 2007. Changes in th composition and structure of Mediterranean rokey-shore communities following a gradient of nutrient enrichment: Descriptive study and test of proposed methodsto assess water quality regarding macroalgae. Mar Poll Bull 55, 104113. Boo SM. 1987. Distribution of marine algae from shore area of Kangwon province. Korean J Phycol 2, 223-235. Boo SM and Lee IK. 1986. Studies on benthic algal community in the east coast of Korea. I. Floristic composition and periodicity of Sokcho rocky shore. Korean J Phycol 1, 107-116. Bray JR and Curtis JT. 1957. An ordination of the upland for-. 269. est communities of Southern Wisconsin. Ecol Monogr 27, 325-349. Choi CG, Kwak SN and Sohn CH. 2006. Community structure of subtidal marine algae at Uljin on the east coast of Korea. Algae 21, 463-470. Choi CG, Lee HW and Hong BK. 2009. Marine algal flora and community structure in Dokdo, east sea, Korea. Kor J Fish Aquat Sci 42, 503-508. Choi CG, Takeuchi Y, Terawaki T, Serisawa Y, Ohno M and Sohn CH. 2002. Ecology of seaweed beds on two types of artificial reef. J Appl Phycol 14, 343-349. Chung H, Cho KW, Chung KH, Kim JH, Shin J, Seo Y, Kang JS and Lee IK. 1998. Ecological characteristics of algal whitening in coastal zone of Seogwipo area, Cheju Island. Algae 13, 361-374. Chung H, Lee HJ and Lee IK. 1991. Vertical distribution of marine algae on a Gallam rocky shore of the mid-east coast of Korea. Korean J Phycol 6, 55-67. Clarke KR and Gorley RN. 2006. PRIMER V6: User Manual/ Tutorial. PRIMER-E Ltd, Plymouth, U.K., 1-190. Dubois A and Katrin I. 2012. Seasonal variation in kelp phlorotannins in relation to grazer abundance and environmental variables in the Alaskan sublittoral zone. Algae 27, 9-19. Figueiredo MA, Kain JM and Norton TA. 1996. Biotic interactions in the colonization of crustose corallin e algae by epiphytes. J Exp Mar Biol Ecol 199, 303-318. Fisheries Agency 2007. Isoyake Taisaku Guideline, Maeda press, Tokyo, Japan, 1-208. Fujita D, Yuji M and Hisami K. 2008. Recovery from Urchin Barrens. Seizando Shoten. 1-291. Fujita D. 2010. Current status and problems of isoyake in Japan. Bull Fish Res Agen 32, 33-42. Hereu B., Mikel Z. and Cristina L.. 2005. The effects of predator abundance and habitat structural complexity on survival of juvenile sea urchins. Mar Biol 146, 293-299. Jang JW. 1994. Marine algal flora and community structure in Kangwon. Kangwon Prov., Korea, 1-122. Kawamata S. 1998. Effect of wave-inducted oscillatory flow on grazing by a subtidal sea urchin Stronglocentrotus nudus. J Exp Mar Biol Ecol 224, 31-48. Kim JH. 2002. Mechanisms of competition between canopyformining and turf-forming intertidal algae. Algae 17, 3339. Kim YD. 2001. Cellular and molecular biological studies of seaweed Porphyra pseudolinearis Udea. Ph.D. thesis, Pukyong National University, Pusan, Korea. Kim YD, Kim SK, Hong JP and Gong YG. 2007. The manual for the construction of seaweed forest on the east coast of Korea. NFRDI. Kim YD, Gong YG, Jeon CY, Song HI, Park MS, Lee CS, Yoo HI and Kim YH. 2010. Marine algal flora and community structure in Daejin on the mid-east coast of Korea. Kor J Fish Aquat Sci 43, 532-539..
(9) 270. 김영대 . 박미선 . 유현일 . 민병화 . 진형주. Lee JW and Lee HB. 1988. A floristic study on marine benthic algae of Yongil Bay and adjacent areas, eastern coast of Korea. Korean J Phycol 3, 165-182. Lee JW, Lee HB and Lee IK. 1993. A study on the community structure of intertidal marine benthic algae in the east coast of Korea I. An intertidal marine benthic algal community at Sokcho. Korean J Phycol 8, 67-75. Lee IK and Kim YH. 1999. Biodiversity and distribution of marine benthic organisms and uses of algal resources in the coastal zone of Korea and Japan I. Benthic marine algae in the east coast of Korea. Algae 14, 91-110. Lee YP and Kang SY. 2002. A Catalogue of the Seaweeds in Korea. Cheju National University Press, Cheju, Korea, 1-662. Ling SD, Ibbot S and Sanderson JC. 2010. Recovery of canopy-forming macroalgae following removal of the enigmatic grazing sea urchin Heliocidaris erythrogramma. Journal of J Exp Mar Biol Ecol 395, 135-146. Margalef R. 1958. Information theory in ecology. General Systematics 3, 36-71. McNaughton SJ. 1967. Structure and function in California grasslands. Ecology 49, 962-972. Nam KW, Kim YS, Kim YH and Sohn CH. 1996. Benthic marine algae in east coast of Korea: flora distribution and community structure. J Korean Fish Soc 29, 727-743. NFRDI Report. 2004. A Study on Construction of Seaweed Forest in the East Sea. In 2004 final report on fisheries life sciences and aquaculture sciences. Yemoonsa, Busan, Korea, 1-283. NFRDI Report. 2007. A Study on Construction of Seaweed Forest in the East Sea. In 2007 final report on fisheries life sciences and aquaculture sciences. Yemoonsa, Busan, Korea, 1-542. NFRDI Report. 2008. Annual Report of Oceanographic Observations, Volume 56. Dongwoo press, Gangneung, Korea, 1-887. NFRDI Report. 2009. Annual Report of Oceanographic Observations, Volume 57. Dongwoo press, Gangneung, Korea, 1-1302.. Ohno M, Arai S and Watanabe M. 1990. Seaweed succession on artificial reefs on different bottom substrata. J Appl Phycol 2, 327-332. Pielou EC. 1969. An introduction to Mathematical Ecology. Wiley, New York. U.S.A., 1-286 Shannon C. 1948. A mathematical theory of communication. Bell Syst Tech J 27, 379-423. Shin JD, Ahn JK, Kim YH, Lee SB, Kim JH and Chung IK. 2008a. Community structure of benthic marine algae at Daejin and Jukbyeon on the mid-east coast of Korea. Algae 23, 231-240. Shin JD, Ahn JK, Kim YH, Lee SB, Kim JH and Chung IK. 2008b. Temporal variations of seaweed biomass in Korean coast: Daejin, Gangwondo. Algae 23, 327-334. Shin S. 2011. Invertebrata Fauna of Korea. Vol. 32. National Institute of Biological Resources. Ministry of Environment. Seoul, Korea 1-122. Steneck RS, Graham MH, Bourque BJ, Corbett D Erlandson JM, Estes JA and Tegner MJ. 2002. Kelp forest ecosystems: biodiversity, stability, resilience and future trends. Environ Conservat 29, 436-459. Terawaki T, Hasegawa H, Arai S and Ohno M. 2001. Management-free techniques for restoration of Eisenia and Ecklonia beds along the central Pacific coast of Japan. J Appl. Phycol 13, 13-17. Tsutsui I, Arai S, Terawaki T and Ohno M. 1996. A morphometric comparison of Ecklonia kurome (Laminariales, Phaeophyta)from Japan. Phycol Res 44, 215-222. Watanuki A and Yamamoto H. 1990. Settlement of seaweeds on coastal structures. Hydrobiologia, 204-205, 275-280. Yoo JW, Son YS, Lee CG, Kim JS, Han CH, Kim CS, Moon YB, Kim DS and Hong JS. 2004. Distribution pattern of the sea urchin Strongylocentrotus nudus in relation to predation pressure in Hosan, the east coast of Korea. The Sea 9, 40-49.. 2012년 4월 2일 접수 2012년 5월 24일 수정 2012년 5월 29일 수리.
(10)
수치


+2

관련 문서
It considers the energy use of the different components that are involved in the distribution and viewing of video content: data centres and content delivery networks
2) Serum Cortisol, ACTH 3) Serum TSH and Free T4 4) Serum Prolactin and GH 5) Serum 25OHD and PTH.. What is the most common laboratory. abnormality expected in this
After first field tests, we expect electric passenger drones or eVTOL aircraft (short for electric vertical take-off and landing) to start providing commercial mobility
1 John Owen, Justification by Faith Alone, in The Works of John Owen, ed. John Bolt, trans. Scott Clark, "Do This and Live: Christ's Active Obedience as the
Anoxic
The eruption of East Asian financial crisis in 1997 has aroused heated debate on the re-evaluation of past economic achievements of East Asian countries
Time series of vertical cross section of potential vorticity and wind vector calculated by Case 1 along the A-A' line indicated at Fig.. Same
• Robert Krier, Stadtsraum in Theories und Praxis (Theory and Practice of Urban Space), 1975. • Urban space is defined as 'covering all types of space between buildings and
