2014 한국유체기계학회학술대회발표논문, 2014년11월26-28일, 부산
The KSFM Journal of Fluid Machinery: Vol. 18, No. 1, February, 2015, pp.65~71(Received 29 Sep. 2014; accepted for publication 04 Nov. 2014) 한국유체기계학회 논문집: 제18권, 제1호, pp.65~71, 2015(논문접수일자: 2014.09.29, 심사완료일자: 2014.11.04) 65
◎ Original Paper
ISSN (Print): 2287-9706
다단 원심펌프의 공동현상 유동해석
라키부자만*⋅서상호*†⋅김형호*⋅조민태**⋅신병록***1)
Cavitating Flow Analysis of Multistage Centrifugal Pump
Rakibuzzaman*, Sang-Ho Suh*†, Hyoung-Ho Kim*, Min-Tae Cho**, Byeong-Rog Shin***
Key Words : Cavitating flow analysis(
공동현상 유동해석), CFD(
전산유체역학), Homogeneous model(
균질모델), NPSH(
유효흡입수두), Vapor volume fraction(
증기체적분율)
ABSTRACT
The purpose of this study is to investigate cavitating flow of the multistage centrifugal pump. Cavitation is observed in the impeller leading edge and trailing edge of the suction area. Head coefficients are measured under different flow operating conditions. The Rayleigh-Plesset cavitation model is adapted to predict the occurrence of cavitation in the pump. The two-phase gas-liquid homogeneous CFD method is used to analyze the centrifugal pump performances with two equation transport turbulence model. The simulations are carried out with three different flow coefficients such as 0.103, 0.128 and 0.154. The occurrence of cavitation described according to water vapor volume fraction. The head versus NPSH (Net Positive Suction Head) also measured using different flow coefficients. Development of cavitation in the centrifugal pump impellerI is discussed.
It is showed that the simulation represents the head drop about 3%.
1. Introduction
Cavitation generally occurs if the pressure in a certain region of liquid flow drops below the vapor pressure and, consequently, the liquid is vaporized and filled with cavity
(1)
. The cavitating flow is usually observed in various propulsion systems and high-speed underwater objects, such as marine propellers, impellers of turbomachinery, hydrofoils, nozzles, torpedoes, etc.This phenomenon usually causes severe noise, vibration and erosion
(2-3)
. Therefore, in order to reduce these unfavorable effects, technology for accurate prediction and estimation of cavitation are very important in the development of high-speed fluid devices(4)
. Due to the importance of the cavitation phenomenon and the great process in the cavitation and turbulence models,numerical simulations have been widely used to investigate the cavitation flow field in the pumps
(5~9)
. In order to clarify and understand the behavior of cavity flow, cavity flow models and analytical methods for numerical simulations have been proposed(10~13)
. Potential flow methods have been employed for decades to model large cavities in a variety of liquid flow systems including pumps(5,14)
.The CFD plays an important role in the flow field analysis; the advanced commercial CFD software can be used for a wide range of flows, including the cavitating flows
(15~17)
. Over the last decade, due to the advancement of the physical modelling and the computational capabilities for cavitating problems, the methods based on the Navier-Stokes equations in computing cavitating flows have received increasingly more attention. These* Department of Mechanical Engineering, Soongsil University, 156-743, Korea
** Dooch Co. 295 Sagok-ri, Gyeonggi-do, 445-942
*** Institute of Flow Informatics, Korea
† 교신저자(Corresponding Author), E-mail : [email protected]
methods are divided into the following three main categories: the interface tracking method
(18)
, the barotropic equation method(19,23)
, and the two equations transport method (TEM)(20~22)
. Among them, the two equations TEM is most widely used strategy, where the flow is treated as a two-phase system with mass transfer between the vapor and liquid phases. In these models, either the simplified Rayleigh-Plesset (R-P) equation(20~22)
, or the empirical formula(21)
are used to establish the interphase mass transfer rates. The mechanisms for cavitation have been extensively investigated(23~24)
, and noticeable efforts have been made on the cavitaion and turbulence models for the simulation of cavitating flow(8)
. However, it is difficult to predict accurately cavitation flow simulation in the complex geometry centrifugal pumps. The present study of this paper is focused on the cavitation performance in the centrifugal pump impeller, the development of the cavitation at the suction leading edge of the impeller. In the numerical prediction, the Singhal(20)
proposed R-P cavitation model, and a two-phase homogeneous gas-liquid CFD method are used. The simulations are carried out with three different flow coefficients such as 0.103, 0.128, and 0.154. The head drop curves are calculated to predict the cavitating performance under cavitation model. In addition, a detailed analysis is accomplished in the vapor volume fraction.2. Mathematical Model and Numerical Method
The fluid in the cavitating flow field for the pump is considered as a homogeneous, compressible mixed medium of vapor and liquid. The governing differential equations are given as Eq.(1),(2);
(1)
(2)
Where ρ
m
and μ are the mixture density and dynamic viscosity, calculated by the weighted average of each phase volume fraction, u is the velocity, p is the pressure, and μt
is the turbulent viscosity respectively and subscripts i, j, k denotes the axes directions.Mixture density and turbulence viscosity are defined by Eq.(3):
(3)
The fluid density is a function of vapor mass fraction
f v, which is computed by solving a transport equation
coupled with the mass and momentum conservation
equations. Here, the cavitation model proposed by
Singhal et al.(20)
. The mixture density is as
(4)
(5)Where
f v , f g , f l are the component mass fraction of
the vapor, gas, and liquid; ρ v , ρ g , ρ l are the component
densities, and αv
, αg
, αl
are the volume fractions. The
vapor mass fraction f, is governed by a transport
equation
v
, αg
, αl
are the volume fractions. The vapor mass fraction f, is governed by a transport equation
∇∙
∇∙∇
(6)
The source term is the diffusion rate,
R e and R c
represents evaporation and condensation respectively and can be functions of flow parameters (pressure, flow velocity) and fluid properties (liquid and vapor phase densities, saturation pressure, and liquid-vapor surface tension). The formation and collapse of a cavity is modeled as a phase transformation. Mass transfer is modeled as finite rate interfacial processes as Eq.(7):
한국유체기계학회 논문집: 제18권, 제1호, 2015 67
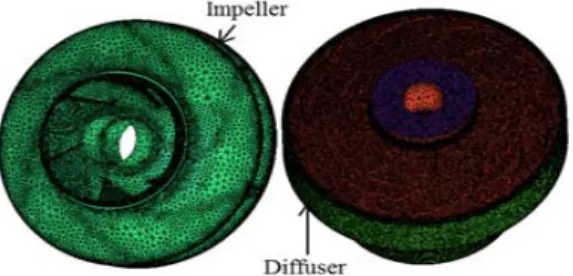
Fig. 1 Impeller-diffuser domain interface
Fig. 2 Meshing of impeller and diffuser of pump
Fig. 3 Front view of the impeller and name of various sections
(7)
The recommended values of the empirical factor constants C
e
and Cc
for 0.02 and 0.01 the gas mass fraction fg =1.5x10⁻⁵,
the surface tension coefficient σ=0.0717
N/m, p v
denote vaporization pressure, and k is the turbulent kinetic energy. ifp<p v
evaporation occurs and ifp>p v
condensation occurs. The k-ω based SST model accounts for the transport of the turbulent shear stress and highly accurate predictions of the onset and the amount of flow separation under adverse pressure gradients(16~17)
. The unknown turbulent viscosityμ t is determined by solving two additional
transport equations for the turbulent energy k,
and for
the turbulence frequency ω.
These two equations can be
written as Eq. (8, and 9)
k
-equation:
′
(8)ω
-equation:
(9)
Where,
P k is the production rate of turbulence, μ t is
the turbulent viscosity, α, β, β',
and
are
constants.
and
are constants.3. Computational Methodology
The model pump of impeller and diffuser were meshed using ANSYS ICEM-CFX (Ansys Inc., 2012, USA) based on the control volume-based finite element method (FEM). The strategy in the ANSYS-CFX is very robust and efficient in predicting the changing flows in the turbomachinery. The pump model impeller-diffuser domain, inlet, and outlet casing which were performed on the unconstructed prism tetrahedral cells generated by ICEM-CFD which is shown in Fig. 1. Impeller
domain was as rotating part with y-axis and the rotational speed was 3600 rpm, and diffuser was considered as stationary domain. A frozen rotor was applied to couple the rotation and stationary domains.
The impeller-diffuser domain is shown in Fig. 2. A commercial CFD code CFX with SST model was used
(2
5~27)
. The boundary conditions of pump model considered as static frame total pressure at inlet and mass flow rate at outlet under cavitation condition.
Generally the boundary of inlet and outlet is same as under non cavitation condition. As the wall boundary condition, no slip condition is on the wall surface. The volume fraction of the vapor and the water are assumed to be 0 and 1 respectively. A steady state analysis is performed in the pump simulation with the given rotational speed at 3600 rpm and the given mass flow rate.
Fig. 3 shows the front view of the impeller and name of various sections, used in the analysis of the
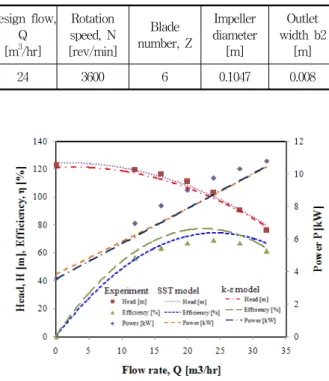
Design flow, Q [m 3 /hr]
Rotation speed, N [rev/min]
Blade number, Z
Impeller diameter [m]
Outlet width b2
[m]
24 3600 6 0.1047 0.008
Table 1 Pump important design specification
Fig. 4 Comparison of experiment and computational head, efficiency and power versus flow rate
cavitation simulation results. Table 1 shows the geometry specification of the centrifugal pump for simulation.
4. Results and discussion
The single-phase experimental and computational performances curves are shown in Fig. 4. The computational simulation is done by SST turbulence model. The SST model can be given the more accurate results than the other turbulence model such as k-
shown in Fig. 4. So, in the cavitation analysis we used k-ω based SST turbulence model. The average deviation for the head is only 5.34%. The efficiency is only 8.22%, respectively. So the numerical simulation results follow the trend to experimental results. For the cavitation conditions, the static pressure is imposed upstream and flow rate downstream. The different NPSH values are obtained by vapor pressure Pv involved in the definition of net positive suction head while the upstream pressure is kept constant.
NPSH is the total head of the fluid at the center line of impeller-above the vapor pressure of the fluid, and can be regarded as a measure for the margin against vaporization of the fluid entering the pump
(28)
. TheNPSH
is defined as Eq.(10)
(10)
Where p
in
is the static pressure at the pump inlet, pv
is the vapor pressure depends on the liquid temperature. Pump head
H
is the difference in total energies at pump inlet and outlet, and it is formulated as Eq. (11)
(11)Where p
1
and p2
are the pressure of suction and discharge of the pump; v1
and v2
are the velocities of the inlet and outlet of the pump; and z1
and z2
are the elevation of the pump system. In what follows, three dimensionless parameters are used to define the pump operating points and performance of the curve, namely, flow coefficient ,
head coefficientψ, and cavitation number σ,
(29)
defined as Eq.(12)
(12)
Where p
in
is the static pressure at the pump upstream, H is the pump head,U tip is the impeller peripheral speed.
4.1. Effect of NPSH
Fig. 5 shows a qualitative comparison of the
NPSH
value under differentNPSH
values (5.23m, 4.27m, 4.21m, and 3.71m). The simulated ones are predicted using SST turbulence model in combination with cavitation model and depicted as different net positive suction head. When the NPSH decreases means that head also becomes drop in that region as a result cavitation bubble grows on the impeller blade. At first the cavitation begins the impeller suction leading edge and then the vapor bubble increases gradually; their length increasing with the decreasingNPSH
values.The cavitation increases on the impeller blade from leading edge to trailing edge.
한국유체기계학회 논문집: 제18권, 제1호, 2015 69
Fig. 5 Cavity volume fraction in pump impeller for NPSH
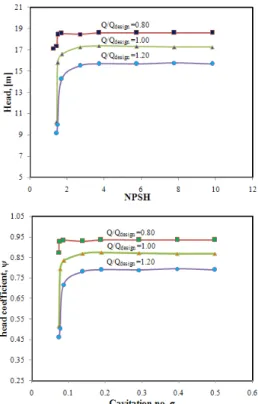
Fig. 6 Head drop predicted by numerical simulation (a) Head vs.
NPSH (b) Head coefficient vs. Cavitation number
Fig. 7 Volume fraction on the plane
4.1.1 Cavitation performance
Water and vapor are in equilibrium at the equilibrium vapor pressure p
v
. When the pressure is lowered the tension will increase and at some pressure vaporization will start. The pressure at which this presents is the inception pressure. Actually, the inception pressure depends on the size of the largest nuclei in the fluid. But it is difficult to predict the inception pressure. So, 3% head drop is accounts forcavitation. Fig. 6 shows the computed results under different operating conditions. Fig. 6 (a) represents the head vs.
NPSH
and Fig. 6 (b) shows the head coefficient vs. cavitation number inception lines. The cavitation is occurred due to gradually decreasing the NPSH or cavitation number. The cavitating behavior obtained at design flow rateQ n shows the cavitaties on
the suction side of the impeller blades. Head begins to
approximately drop when the cavitation reaches on the
suction impeller by two adjacent blades and rapidly
decreases by more than 10% of its non-cavitating
conditions. Three flow rates considered 0.8Qn
, 1.2Qn
and
Q n for NPSH values, respectively, of about 18.581m, 15.67m, and 17.24 m.
Fig. 6 (a) and (b) shows the same tendency at given different flow rates. In this figure head drop curve initially decreases of the cavitation number has no effect on the energy characteristics of the pump, and the head coefficient remains unchanged. When the value of NPSH as well as the cavitation value continues to decrease, the cavitation is gradually increases resulting the head as well as head coefficient is decreased. Also changing the flow rate of 1.2
Q n the head coefficient is lower than the design flow rate. The different critical cavitation numbers are used in the pump simulations; cavitation number is corresponding to the reduction of 3% of the head coefficient.
4.1.2 Water vapor volume fraction
To influence cavitation development on the pump performance, the contours of the water vapor volume fraction distribution is on the plane. The cavitation vapor volume fractions are shown in Fig. 7 which the contours define
from 0 to 1. Fig. 7 presents the four cavitation number water volume vapor fraction. The cavitation in the developed model pump is clearly observed by numerical simulations. The cavity bubble at first occurs on the suction side near the blade leading edge, in this case the pressure in that region near the shroud is smaller than of the hub due to the impeller rotational force. so the cavitation bubbles grows becomes larger from hub to shroud as shown in Fig. 7. For the σ = 0.2638, the cavitation can be is clearly on the suction side, at the leading edge of the impeller blades, when the value decreases, the length of cavities grows a significant extent on the impeller blades. Here the pump head begins to drop. For σ = 0.1891 the cavity almost interacts with the blades at the trailing edge of the neighboring blade, at this stage the flow channel is almost remarkably obstructed by the cavities, which is formed a large blockage in the internal flow and thereafter the pump head completely dropped. The distribution of the cavitation on the blade is asymmetrical because of the presence of the pump volute.
5. Conclusion
The improved computation model of shear stress transport (SST) turbulence is used to calculate the cavitating performance flow in the centrifugal pump at a design flow coefficient from 0.077 to 0.154. The effects of the compressibility of mixture fluid were applied of two-phase homogeneous method with Rayleigh- Plesset cavitation model under developed cavitating conditions. The development of the cavitating condition on the impeller blade was observed. In the suction side, the leading edge of the impeller blades, cavitation occurs at first and when the value of cavitation number decreases, the length of cavities grows a significant extent. The development of cavitation also causes the head drop of the pump performance.
Acknowledgement
This work was supported by the National Research Foundation of Korea (NRF) grant number by the Korea government through the Korea institute of Energy Technology Evaluation and Planning (KETEP). The grant number is 20132010101870 for the Promotion of Science.
References
(1) Kim, D. H., and Park, W. G. et al., 2012, "Numerical simulation of cavitating flow past axisymmetric body,"
Int. J. Naval Architect Ocean Engineering, Vol. 4, pp. 25 6~266.
(2) Knapp, R. T., Daily, J. W. and Hammitt, F. G., 1970, Cavitation, McGraw-Hill, New York, pp. 5~8.
(3) Pumping Station Engineering Hand Book, 1991, Japan Association of Agriculture Engineering Enterprises, Tokyo, pp. 50~90.
(4) Shin, B. R. et al., 2004, "Application of preconditioning method to gas-liquid two-phase flow computations,"
Journal of Fluids Engineering, ASME, Vol. 126, pp. 605~
612.
(5) Medvitz, R. B., Kunz, R. F., Boger, D. A. et al., 2002,
"Performance analysis of cavitating flow in centrifugal pumps using multiphase CFD," J. of Fluids Eng., Vol.
124, pp. 377~383.
(6) Pierrat, D., Gros, L. et al., 2008, "Experimental and numerical investigations of leading edge cavitation in a helico-centrifugal pump," 12th Int. Symp. on Transport Phenomena and Dynamic of Rotating Machinery, pp. 1~19.
(7) Pouffary, B., Patella, R. F., Reboud, J. L. et al., 2008,
"Numerical simulation of 3D cavitating flows analysis of cavitation head drop in turbomachinery," J. of Fluids Eng,, Vol. 130, pp. 301~310.
(8) Coutier, D. O., Fortes, P. R., Reboud, J. et al., 2003,
"Evaluation of the turbulence model influence on the numerical simulations of unsteady cavitation," J. of Fluids Eng,, Vol. 125, pp. 38~45.
(9) Katz, J. and Acosta, A., 1982, "Observations of nuclei in cavitating flows," Applied Scientific Reasearch, Vol. 38 pp. 123~132.
(10) LIU, H., REN, Y., WANG, K. et al., 2013, "Experimental investigation and numerical analysis of unsteady attached sheet cavitating flows in a centrifugal pump," Journal of Hydrodynamics, Vol. 25, No. 3, pp. 370~378.
(11) Baradaran, F. and Nikseresht, A. H., 2012, “Numerical simualation of unsteady 3D cavitating flows over axisymmetric cavitators”, Journal of Scientia Iranica, Vol. 19, No. 5, pp. 1258~1264.
(12) Fard, M. P. and Roohi, E., 2008, ‘‘Transient simulations of cavitating flows using a modified volume of fluid(VOF) technique," Int. J. Computational Fluid Dynamics, Vol. 22, No. 1~2, pp. 97~114.
(13) Senocak, I. and Shyy, W., 2001, "Numerical simulation of turbulent flows with sheet cavitation," Int. Symp. on Cavitation, Vol. A7, pp. 2~8.
(14) Funada, T. and Joseph, D. D., 2001, "Viscous potential
한국유체기계학회 논문집: 제18권, 제1호, 2015 71