2013 한국유체기계학회 학술대회 발표 논문, 2013년 11월 27-29일, 제주
The KSFM Journal of Fluid Machinery: Vol. 17, No. 5, October, 2014, pp.67~71(Received 5 Dec. 2013; accepted for publication 16 Apr. 2014)
◎ Original Paper ISSN (Print): 2287-9706
Internal Flow Analysis on an Open Ducted Cross Flow Turbine with Very Low Head
Qingsheng Wei * ⋅Yeong-Cheol Hwang ** ⋅Young-Do Choi ***
†1)Key Words : Open ducted cross-flow turbine(
개방형 횡류수차), Air layer(
공기층), Draft tube(
흡출관), Performance(
성능), Internal flow(
내부유동)
ABSTRACT
Recently, the cross flow turbine attracts more and more attention for its good performance over a large operating regime at off design point. This study adopts a very low head cross flow turbine that has barely been studied before, and investigates the effect of air layer on the performance of the cross flow turbine. As open duct is applied in this study and free surface model is used between the air layer and water, an engineering definition of efficiency, instead of traditional definition of efficiency, is used. As torque at the runner fluctuates up and down at a reasonable limit, statistical method is used. Pressure and water volume fraction contours are shown to present the characteristics of air-water flow. With constant air suction in the runner chamber, the water level gradually drops below the runner and efficiency of the turbine can be raised by 10 percent.
All considered, the effect of air layer on the performance of turbine is considerable.
1. Introduction
Cross flow turbine is ideal for the hydraulic environment of small, run of the river operations. Not only because it is easily structured and least expensive, but also because its efficiency is much less dependent on flow rate than other hydro turbines.
However, the low efficiency remains a problem.
Though invented in 1900 [1] that only 84% have been cited in the literatures while the predicted maximum efficiency is 88% according to current theory.[2]
In order to increase the efficiency, Tamil Chandran et al.[3] conducted an experiment on a cross flow turbine and it was suggested to improve the efficiency by modifying the guide vane profiles. Nakase et al.[4]
proved that optimization of the nozzle shape can be a good method. However, this study adopts a kind of cross flow turbine with very low head and open duct is applied to guide the water into the runner. As a result, the effect of above methods is limited.
However, Choi et al.[5] proved that the effect of air layer in the runner chamber is considerable for medium head cross flow turbine by experimental and CFD methods.
The purpose of this study is to investigate the effect of air layer for a 1.5m head cross flow turbine which is barely studied before, and to verify the possibility of air naturally sucked by adopting a valve in the air suction pipe. Two phase flow transient analysis is conducted under the condition of gravity to
* Graduate school, Mokpo National University
** Shinhan Precision Ltd.
*** Department of Mechanical Engineering, Institute of New and Renewable Energy Technology Research, Mokpo National University
† 교신저자(Corresponding Author), E-mail : [email protected]
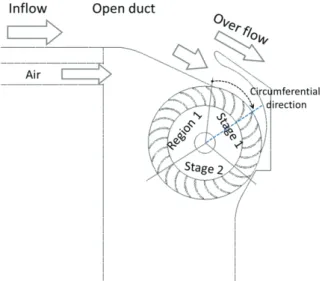
Fig. 2 Schematic of the open ducted cross flow turbine with air suction pipe installed in rear part of runner chamber
embody the air layer effect. Efficiency is traced toanalyze the effect of air layer at different water levels in runner chamber. Pressure contours showed that the air can be sucked into runner as the pressure at rear part of runner is below the atmosphere. Cases with different air flow rate are compared to get the ideal air suction. All considered, the effect of air layer for this very low head cross flow turbine is considerable.
(a)
(b)
Fig. 1 (a) Whole view and (b) cut-away view of cross flow turbine
2. Turbine model
Figure 1 shows the 3-D modeling of the cross flow turbine model which is used for CFD analysis in this
study. To reduce the cost, the construction is simplified with only a nozzle to guide water running into the runner. Open duct is used instead of closed duct. Air sucked from a pipe behind the rear part of runner chamber as shown in Fig. 2. For convenience, the runner is divided into three parts: Stage 1, Stage 2 and Region 1. The circumferential direction θ is clockwise starting from runner inlet. Table 1 shows the studied cases to improve the performance of cross flow turbine.
Case 0 is the case which air suction pipe not included in the design. Case 6 which shows an air suction ratio ranges from 0.21 to 1.40 is one that operated under the condition of opening for boundary condition of air suction pipe inlet, which means that air flow rate is real-time determined by differential pressure between the air suction pipe inlet and rear part of the runner chamber under determined pipe size.
3. Numerical methods and boundary condition
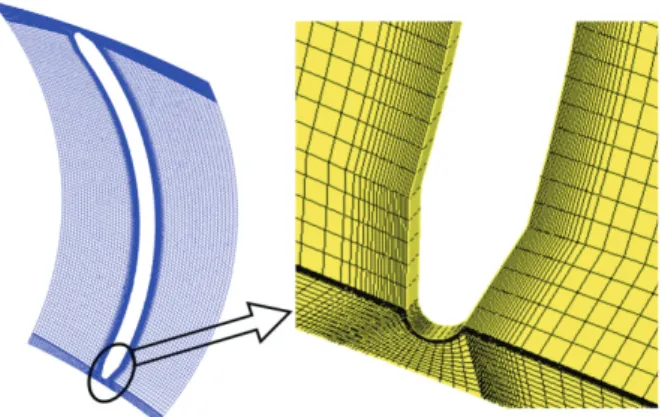
This study employs a commercial CFD code of ANSYS CFX to conduct CFD analysis. As gravity is a very important factor in this study, and the direction of gravity is not in line with that of runner rotating axis, only transient analysis can be conducted under this condition. y+ is a very important factor in transient analysis. In order to diminish the y+, hexahedral grids are applied with high density around the region near the surface of runner blades as shown in Fig. 3. 2-D analysis is applied to shorten the calculating time and
Fig. 3 Mesh of runner passage with inflations attached to blade surface
reduce the computational cost, which means that transverse flow along the thickness direction is not considered in this study. Furthermore, two phase flow calculation with a free surface between the air and water layer is used. The details boundary condition and numerical methods are shown in Table 2.
Test Cases Air Suction
(R V⋅Air =V Air /V Inflow ) RPM
Case 0 0.00000 132
Case 1 0.04438 132
Case 2 0.08875 132
Case 3 0.13313 132
Case 4 0.17750 132
Case 5 0.26625 132
Case 6 0.20970∼1.39665 132
Table 1 Cases of the CFD analysis
Numerical methods
Analysis type Transient analysis
Fluid type Water 20℃
Air 20℃
Turbulence model Shear stress transport Multiphase model Non-homogeneous
y+ Below 10 at runner
Below 50 at others
Boundary condition
Inflow inlet Normal speed
Air suction inlet Normal speed
Outlet Normal speed
Wall No-slip
Table 2 Numerical methods and boundary condition
4. Results and Discussion 4.1. Efficiency curves
Actual efficiency can be determined by eithermeasurement or computational intensive simulations of fluid flow through the turbine runner. For the engineering application, efficiency of this study is simply calculated based on potential energy difference between the upstream and downstream. Namely
(1)
where
η
is the efficiency of cross flow turbine,T
is the torque at runner;ω
is the rotational speed of runner rotating on its own axis;H
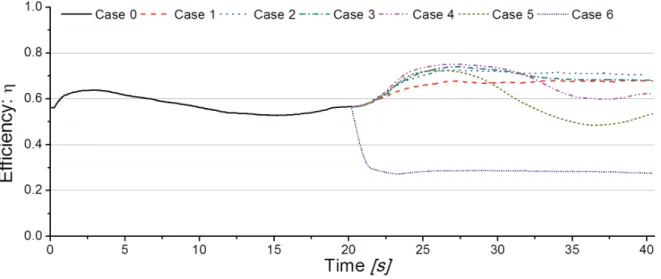
is the turbine head.The efficiency curves of the turbine are shown in Fig. 4. For convenience, three processes are defined in this paper: efficiency increasing process in which efficiency increases, efficiency steady process in which efficiency is in steady state, and efficiency decreasing process in which efficiency decreases. In Case 0, no air is sucked through air suction pipe. To shorten the calculating time, a water level close to bottom of runner is set at the beginning. As shown in Fig. 4, first turbine goes through an efficiency increasing process to reach a best efficient point and then efficiency decreases along the time step (TS). It takes some time to reach the efficiency steady state and final efficiency is as low as 60%. Taking the final state in Case 0 as initial condition, Cases 1 to 6 are calculated to investigate the effect of air suction through the pipe behind runner chamber. According to Fig. 4, efficiencies of Case 1 to Case 5 start to increase and the growth ratio gets larger with increasing of air suction ratio. Finally, the slope reaches the maximum point up to 75%. In Cases 3 and 4, the efficiency curves goes through two efficiency steady processes, i.e., the efficiency of turbine starts to increase to its maximum point with an averaged value of about 70%
and through an efficiency steady process for a while then decreases to reach a new equilibrium with a lower efficiency. However, compared with final efficiency in Case 0, it still increases to some extents. In Case 5, the efficiency curve goes through an efficiency
Fig. 4 Transient efficiency curves versus time by different cases
(a)
(b)
(c)
Fig. 5 Distributions of water volume fraction at (a) beginning (b) maximum efficiency point and (c) final
state in Case 6
(a)
(b)
(c)
Fig. 6 DDistributions of pressure at (a) beginning (b)
maximum efficiency point and (c) final state in Case 6
increasing process, an efficiency decreasing process and an efficiency steady process, i.e., efficiency starts to increase at the beginning, and after reaching the turning point, it showed a tendency to decrease and reach a steady state after a while. However, when opening condition is applied to the pipe inlet - in other words, the pipe is fully opened and air flow rate is determined by the differential pressure between the air inlet and runner chamber - the efficiency curve suddenly decreases to a very low level around 20%, which is only 1/3 of beginning.
4.2. Time serial distributions of water volume fraction and pressure of the fluid domain
The distributions of water volume fraction and pressure in fluid domain are shown in Figs. 5 and 6.
Attentions should be paid to that in Fig. 5, areas of water volume fraction 1 means those areas is filled with water, and 0 means those areas is filled with air.
Otherwise there is filled with mixture of water and air. Since Case 6 contains all the water distribution variations, it is chosen for detail explanation.
In draft tube without air suction, air flowed away with the water. As a result, pressure in the runner decreased lower than atmospheric pressure (see Fig.
6(a)) and vacuum formed. Thus water level in draft tube raised over runner as shown in Fig. 5(a), results in decrease of turbine efficiency. However, with air suction, pressure in the runner increased as shown in Fig. 6 (b). At meanwhile, the water level dropped down and efficiency increased. Moreover, when the water level dropped to bottom of runner, efficiency reached its maximum point. With excessive air suction, the water level continuously dropped beneath the runner and potential energy loss got larger. In Case 6, since air flow rate was so large that pressure in draft tube increased to atmospheric pressure (see Fig. 6(c)) and water level dropped to bottom of draft tube(see Fig. 5(c)), and no power was generated from
potential energy in draft tube and kinetic energy loss when water ran out of runner was considerable large.
5. Conclusions
According to above discussion, the conclusions can be drawn as follows:
Firstly, a suitable amount of air inflow can contribute to improve turbine performance. Secondly, air flow rate ratio sucked naturally is larger than that of other cases. In other words, a valve in air suction pipe can be used to decrease air flow rate to the optimal point. Thirdly, the efficiency of turbine reaches its maximum point when water level is around bottom of runner.
Acknowledgement
This work (Grant No. C0007317) was supported by Business for Cooperative R&D between Industry, Academy, and Research Institute funded Korea Small and Medium Business Administration in 2012..