Print ISSN: 2288-4637 / Online ISSN 2288-4645 doi:10.13106/jafeb.2021.vol8.no1.813
Relationships between Debt, Growth Opportunities, and Firm Value:
Empirical Evidence from the Indonesia Stock Exchange
Herry SUBAGYO1
Received: September 30, 2020 Revised: November 30, 2020 Accepted: December 14, 2020
Abstract
The relationship between capital structure policy and firm value is interesting to study because the concept of capital structure was initiated by Modigliani and Miller who claimed that the company’s capital structure is not a factor in its value. They asserted that linking leverage with firm value was irrelevant. Therefore, this study examined the role of growth opportunities as a moderating variable for the relationship between capital structure and firm value. The population of this study is 300 companies from the manufacturing sector that are listed on the Indonesia Stock Exchange (IDX) for the period 2015-2018. To analyze the data, the subgroup moderation method was employed by dividing the data into two parts: companies with high growth opportunities and companies with low growth opportunities. The results revealed that capital structure had a direct positive effect on firm value. Furthermore, the test results of the two regression models of growth opportunities as the moderating variable are very interesting. It was found that for companies with high growth opportunities, the use of debt had a negative effect on firm value, and conversely, the use of debt had a positive effect on firm value for companies with low growth opportunities. The statistical F-test results proved that growth opportunities are a moderating variable for the relationship between capital structure and firm value.
Keywords: Growth Opportunities, Capital Structure, Firm Value, Subgroup JEL Classification Code: G31, G32, G35
1 First Author and Corresponding Author. Faculty of Business and Economics, Universitas Dian Nuswantoro, Indonesia [Postal Address: Jl. Nakula I No. 11-15, Semarang, 50131, Indonesia]
Email: [email protected]
© Copyright: The Author(s)
This is an Open Access article distributed under the terms of the Creative Commons Attribution Non-Commercial License (https://creativecommons.org/licenses/by-nc/4.0/) which permits unrestricted non-commercial use, distribution, and reproduction in any medium, provided the original work is properly cited.
1. Introduction
The relationship between capital structure policy and firm value is interesting to study because the concept of capital structure was initiated by Modigliani and Miller who claimed that the company’s capital structure is not a factor in its value. They asserted that linking leverage with firm value was irrelevant (Modigliani & Miller, 1958). Realizing this concept’s weakness, revisions were made to take into consideration tax savings (Modigliani & Miller, 1963). The concept of capital structure was further developed by Stiglitz (1969) and Myers (1977), who explained that the use of debt has an optimum limit. Moreover, the use of debt must take into account the risk of possible failure so that it considers
bankruptcy costs and transaction costs. Furthermore, it was described that the company has an optimal level of debt and tries to adjust its debt level when it is in an over or under- leveraged position towards the optimal leverage. In a stable condition, the company adjusts its debt to its long-term average debt (Myers, 1977).
Ross (1977) stated that in the relationship between capital structure and firm value related to information asymmetry, managers with an informational advantage have an incentive to signal their private information through their choice of debt level. Ross (1977) was the first to address the function of the debt signaling mechanism where asymmetric information exists between management and investors, which also explains why existing investors avoid issuing new equity. Therefore, asymmetric information will be taken into account of how the management will take action as it concerns the signal perceived by the outside investors. When management issues new debt, it is perceived as a positive signal and has a positive effect on stock prices. Empirical evidence supporting the concept of information asymmetry has been carried out by Salehi and Biglar (2009), Maxwell and Kehinde (2012), and Aggarwal et al. (2019). Dang et al.
(2019) found a negative relationship between leverage and
firm value. Besides, Rahman (2018) and Dang et al. (2019), in their research studied the effect of growth, capital structure, firm size, and profitability on firm value. The results did not support the positive effect of capital structure on firm value.
Besides, growth factor also does not have any impact on firm value
Regarding information asymmetry, Myers and Majluf (1984) proposed a tiered funding concept, called a pecking order. According to them, the optimization of the capital structure is based on tiered funding decisions based on the order of the cheapest capital costs. Financing comes from three sources, internal funds, debt, and new equity. Companies prioritize their sources of financing, first preferring internal financing, and then debt, lastly raising equity as a “last resort”.
They argued that equity is a less preferred means to raise capital because when managers issue new equity, investors believe that managers think that the firm is overvalued and managers are taking advantage of this over-valuation. As a result, investors will place a lower value on the new equity issuance.
Several studies have shown support for pecking orders (Frank & Goyal, 2003; Ni & Yu, 2008; Kayhan & Titman, 1984). Support from other research results showed that the pecking order could explain the company’s deficit funding behavior (Bhama et al., 2016; Nguyen et al., 2019; Aggarwal
& Padhan, 2017; Qu et al., 2018; Li & Stathis, 2017; Saif- Alyousfi et al., 2020). However, some research results also contradicted the pecking order concept (Viviani, 2008:
Li & Stathis, 2017; Nguyen et al., 2019). They discovered that pecking orders did not apply to all types of companies.
Besides, an individual firm’s finance policy needs to be responsive to the firm’s characteristics and should match with the different borrowing requirements of listed firms. (Khan et al., 2020), and the capital structure was influenced by company growth (Vijayakumaran & Vijayakumaran, 2019;
Danila et al., 2020; Goyal et al., 2002); Bei & Wijewardana, 2012). Frank and Sanati (2019) stated that firms issue equity first, then increase real assets, and finally issue debt while repurchasing equity. After they obtain assets that can be pledged to lenders, firms substitute debt for equity to benefit from interest tax deductions.
The concept of capital structure that has been discussed is a form of approach that emphasizes balance without considering the company prospects. McConnell and Servaes (1995) expounded on the capital structure related to growth opportunities. They also explained that the optimal capital structure could shift with changes in growth opportunities.
For firms with ‘high-growth’ firm value is negatively correlated with leverage, whereas for firms with ‘low-growth’
firm value is positively correlated with leverage. Debt policy and equity ownership structure ‘matter’ and that how they matter differs between firms. Empirical evidence revealed that companies with high investment opportunities tended to
use low debt ratios (Vijayakumaran & Vijayakumaran, 2019;
Nguyen et al., 2019; Danila et al., 2020),
The relationship between investment opportunities and the firm value was illustrated by Myers (1977) that firm value is determined by the investment opportunity set (IOS). IOS is an investment decision in the form of a combination of assets in place and future investment options that will affect the value of the firm so that the opportunities investment set can be concluded a management decision in the future in the form of investments that affect the company’s return and market value. IOS is the company’s ability to exploit opportunities compared to other companies or reflect companies’ value with investment prospects in the future (Gaver & Gaver, 1993).
The relationship between investment opportunities and the firm value was clarified by Stulz (1990). Chen (2002) tested the influence of the debt structure on the company value given different growth opportunities with the companies. The market value of any firm is independent of its capital structure, given the assumptions of capital markets are perfect. It is observed that the optimal capital structures are closely related to the growth potential of the firms and some other variables, such as the size and the industry characteristics. Building on the argument that high-growth firms’ corporate value is negatively correlated with leverage, whereas for low-growth firms’ corporate value is positively correlated with leverage, they observed that the growth opportunities may influence the optimal capital structure. The reason is that the optimal leverage may shift with the changes in growth opportunities that lead to the changes in agency costs of debt and cost of managerial discretion.
Based on the findings of the relationship between growth opportunities, debt, and firm value by previous researchers, this research attempts to analyze the relationship between debt use, growth opportunities, and firm value. To test the relationship between the three variables, growth opportunities were placed as a moderating variable. It is expected that this research can contribute to explaining the relationship between debt and company value, especially in the manufacturing industry in Indonesia.
2. Literature Review and Hypothesis Development
2.1. Capital Structure and Firm Value
Capital structure is an interesting issue for continuous research (Nguyen & Tran, 2020). There is much debate about what factors determine capital structure policy; the theories built have not found an agreement because they are based on different assumptions. Each factor has a different impact, depending on the company’s conditions and position (Myers, 2003). Capital structure means the proportion of debt employed
in the company (debt ratio). Capital structure policy is a strategic policy because it relates to corporate risk. The use of debt can increase the risk of bankruptcy because the company must bear a fixed burden. On the other hand, debt can save tax payments from the interest costs paid (tax-deductible). For that reason, companies must be able to optimize their capital structure by considering these two interests.
The relationship between capital structure and the firm value was first suggested by Modigliani and Miller in their proposition, which stated that capital structure and firm value were irrelevant (Modigliani & Miller, 1958). After receiving criticism, a revision was made to take into account tax savings.
According to them, the accumulation of sustainable tax savings will increase company value (Modigliani & Miller, 1963).
Responding to the capital structure concept developed by Stiglitz (1969), the company might not be able to use the debt to its full potential. The use of debt must take into account bankruptcy costs and transaction costs. The company has an optimal debt level and tries to adjust its debt level when it is over or under- leveraged towards optimal leverage (Myers, 1977).
Myers (1984) tried to include the cost of financial distress, bankruptcy, and transaction costs in the trade-off theory, better known as the theory of balancing. The trade-off theory of capital structure is the idea that a company chooses how much debt finance and how much equity finance to use by balancing the costs and benefits. This theory rationalizes that structural policy affects firm value, and there is optimal leverage (debt ratio) in the relationship between capital structure and firm value. The use of debt will increase the firm’s value at a specific (optimal) leverage, and after that, the use of debt will decrease the firm’s value. Balancing theory also relates to company size; large companies, in general, have a lower bankruptcy possibility than small companies; therefore, they can easily attract debt than small companies. Empirical evidence has confirmed that debt has a positive effect on firm value at a certain level; after that, the debt does not affect firm value (Wang et al., 2011). Research results supporting the balancing theory have been carried out by Maxwell and Kehinde (2012), Dang (2013), Aggarwal and Padhan (2017), and Nguyen et al. (2019).
Myers and Majluf (1984) proposed a tiered funding concept, called a pecking order. According to them, the optimization of the capital structure is based on tiered funding decisions based on the order of the cheapest capital costs. Internal financing is the cheapest source of funds, and the next need is met by external sources of debt while issuing shares is the last alternative. Several studies have shown support for pecking orders (Frank & Goyal., 2003; Ni
& Yu., 2008; Kayhan & Titman, 1984). Support from other research results showed that the pecking order could explain the company’s deficit funding behavior (Bhama et al., 2016;
Nguyen et al., 2019; Aggarwal & Padhan, 2017; Qu et al., 2018; Li & Stathis, 2017; Saif-Alyousfi et al., 2020).
The relationship between leverage and the firm value was also analyzed by Ross (1977). He was the first to address the function of the debt signaling mechanism where asymmetric information exists between management and investors, which also explains why existing investors avoid issuing new equity. Therefore, asymmetric information will be taken into account of how the management will take action as it concerns the signal perceived by the outside investors. When management issues new debt, it is perceived as a positive signal and has a positive effect on stock prices. Empirical evidence supporting the concept of information asymmetry has been carried out by Salehi and Biglar (2009), Maxwell and Kehinde (2012), Aggarwal and Padhan (2017), Chabachib, Fitriana, Hersugondo, Pamungkas, & Udin (2019), and Ifada, Faisal, Ghozali, & Udin (2019). Based on the relationship between leverage and firm value, hypothesis 1 was proposed as follows:
H1: Capital structure affects firm value.
2.2. Growth Opportunities
Growth opportunities are interpreted as prospects for the availability of profitable investment opportunities (Danila et al., 2020). This investment opportunity is the availability of investment options that can generate net cash flows in the future. This profit prospect is an opportunity that will increase the company’s value. The company’s growth opportunity cannot be observed directly, so a proxy must be used. The indicator often used to describe investment opportunities is IOS. This IOS concept was introduced by Myers (1977).
According to him, the company value is a combination of assets owned and the selection of investments to be made.
This concept is essential because it can be used to measure future growth potential so that it is relevant for predicting the company owner’s wealth.
Graver and Graver (1993) presented additional evidence on the relation between the investment opportunity set and financing, dividend, and compensation policies. A company’s growth opportunities are related to the discretion of almost all expenditures, for example, capacity expansion, new product introductions, company acquisitions, investment in advertising, and asset replacement (Gaver & Gaver, 1993).
Furthermore, it is also explained that IOS is determined by the choice of business lines based on its competitive advantage.
Every company is in a different condition precisely so that the IOS for each company will be different. Kallapur and Trombly (2001) elucidate that IOS’s primary determinant is industry factors, such as a barrier to entry and product life cycle. The barrier to entry factor is a factor that can hinder the entry of competitors into the industry. Industries with a successful short product life require much investment in research and development and a skilled research person.
In terms of proxies for growth opportunities, Gaver and Gaver (1993) suggested six proxies that can be used to measure investment opportunities: 1) Market to book value of assets ratio, 2) Market to book value of equity ratio, 3) R&D expenditures to the book value of assets ratio, 4) the earnings/
price ratio, 5) the variance of the total return of the firm, and 6) the frequency that the firm is included in the holdings of growth-oriented mutual funds. Besides, Kallapur and Trombly (2001) explained the concept of the investment set (IOS: i.e.
chances to invest for expansion, new products, cost reduction, etc.) and its effects on firm value. Reviews previous research on the theoretical relationships between IOS and optimal contracting resulting from shareholder/debtholder conflict, agency costs, and performance measurement problems;
and empirical research on its links with company policy on financing, dividends, and compensation. They classified IOS into three main categories: 1) Price-based proxies; this approach is based on the premise that company growth opportunities are indicated partially in the stock price, including companies with a higher market value growth opportunity than their book value. 2) Investment-based proxies, this approach is based on the premise that high investment activity is positively related to IOS. 3) Variance measure; this measurement is based on the idea that investment options become more valuable when using size variability to estimate growing options.
Adam and Goyal (2008) evaluated the performance of several proxy variables for a firm’s investment opportunity set.
The results show that, on a relative scale, the market‐to‐book assets ratio has the highest information content concerning investment opportunities. Though both the market‐to‐book equity and the earnings–price ratios are related to investment opportunities, they do not contain information that is not already contained in the market‐to‐book assets ratio.
Barclay et al. (2006) stated that the market to book asset ratio is the most suitable proxy for investment opportunities.
Hermuningsih (2013) in his research utilized four proxies as indicators of growth opportunities: Investment to Sale (INVOS), Price-earnings ratio (PE), Market to Books Total Assets (MTBA), and Market to Books Total Equity (MTBE).
In his research, a positive relationship between growth opportunities and the firm value was found. Kim et al. (2018) employed R&D proxies in their research, which discovered a positive relationship between growth opportunities and firm value. Companies with growth opportunities had a positive effect on firm value, and conversely, companies with no growth opportunities had a negative effect.
2.3. Growth Opportunities, Capital Structure, and Firm Value
Stulz (1990) argues the relationship between investment opportunities and capital structure. According to him,
management tends to prioritize increasing investment (over investment), including less profitable investments, because management does not participate in company ownership.
Due to information asymmetry, when profitable investment opportunities are opened, management is forced to reduce investment. As a result, there is underinvestment. Besides, debt policies can limit management’s discretion in over- investing and under-investing. The relationship between growth opportunities, debt, and firm value asserted that debt had a positive effect on firm value when the company had a low growth opportunity, and debt had a negative impact on firm value when the company’s growth opportunity is high (Gaver & Gaver, 1993; McConnell & Servaes, 1995; Goyal et al., 2002; Billett et al., 2007). Chen and Zhao (2006) how that firms with higher market-to-book ratios face lower debt financing costs and borrow more. The relation between the market-to-book ratio and leverage ratio is positive for most firms while a negative relation is driven by a subset of firms with high market-to-book ratios. They researched and found that most of the companies that they studied had a positive relationship between growth opportunities and leverage. Gul and Kealey (1999) examined companies in Korea about the relationship between growth opportunities, leverage, and dividends, and the results revealed that growth opportunities were related to leverage, but not to dividends.
Barclay et al. (2006) investigated that companies with high growth opportunities proxied with growth tended to have low leverage. The firm value increases with additional growth options; therefore, not only does leverage decline but the firm’s optimal total debt level declines as well. This result implies a negative relation between book leverage and growth options. Companies with high growth opportunities tended to have low leverage (Quynh-Nhu, 2009; Danila et al., 2020). Mendoza et al. (2019) found a non-linear negative effect of growth opportunities on debt. They showed that growth opportunities had a negative impact, while leverage had a positive impact, although their effects are not persistent and depend on the level of these attributes.
Previous research studies indicated that the relationship between growth opportunities and capital structure tended to be conditional, as Stulz (1990) explained. Many researchers support the fact that the effectiveness of using debt is determined by the availability of growth opportunities. Thus,
H2: Growth opportunities moderate the effect of capital structure on firm value.
3. Research Methods
The population of this was 300 companies from the manufacturing sector listed on the IDX for the 2015-2018
period. The independent variable in this study was the capital structure measured by debt to total assets, while the dependent variable was the firm value assessed by Tobin q. As for growth opportunities, it was proxied by the Market Book value of Equity (MBE), which was placed as a moderating variable.
To test the role of growth opportunities in moderating the effect of capital structure on firm value, a sub-group moderation model was employed with the SPSS 23 version.
The testing process was performed by dividing the data into two groups (Helm & Mark, 2012): companies with high growth opportunities and low growth opportunities. The groups’ division was based on the data’s mean value of the growth opportunity variable to obtain a significant difference in value; five percent above and below the midpoint was omitted.
Moderation test steps:
1. Regressing the independent variable debt to the dependent variable Q in all samples. This test was carried out to obtain the Sum square Residual (SSR) using all data.
Q = α + β1 Debt + ε1 ... (1) 2. Regressing the independent variable DebtH against
the dependent variable QH for the high growth opportunity (MBEH) sample to obtain Sum Square Residual (SSRH)
QH = α + β2 Debt H + ε2 ... (2) 3. Regressing the independent variable debt to dependent
variable Q for low growth opportunity (MBEL) Sum Square Residual (SSRL)
QL = α + β3 DebtL + ε3 ... (3) 4. Calculating the statistical F-value using the equation:
( )
( ( ) ( )
F 2
SSR SSRH SSRL K SSRH SSRL NH NL K
− +
= + + − ... (4)
Where:
K = Number of categories (high and low) N = Number of samples
4. Results and Discussion
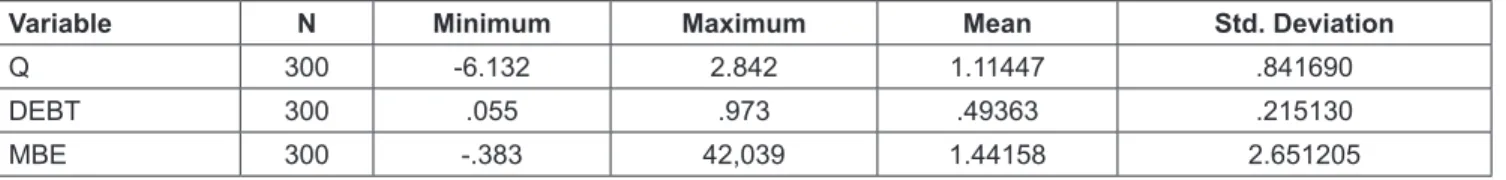
The following table 1 presents the descriptive statistics of three variables used in this study: capital structure proxied by a debt ratio, firm value proxied by Tobin’s q, and the growth opportunity variable predicted as the moderator variable.
The mean value was Q>1, which indicated that manufacturing companies tended to show growth. However, some companies had negative growth values, and the minimum value was (-6.132). The use of debt to support capital in the manufacturing sector tended to be high. It could be seen from the mean debt value of 0.49363; almost fifty percent of the capital was financed from debt. This condition could affect the level of company risk.
Table 2 above displays the regression test results that placed the capital structure variable as the independent variable and firm value as the dependent variable. In model 1, it was tested using all data. The results showed that the capital structure had a direct positive effect on firm value. These results support previous research conducted by Hermuningsih (2013), Aggarwal and Padhan (2017), and Uzliawati et al. (2018) that the structure positively impacted firm value.
In regression model 2, a regression test of the debt’s effect on firm value was performed using data on companies with high growth opportunities. The result shows that the capital structure had a significant negative effect. This result is in line with previous research, stating that debt could increase firm value, but the use of debt that exceeded the optimal limit would have a negative impact on firm value (Adenugba et al., 2016). This study’s results complement previous research with the same object by Danila et al. (2020) who showed that companies’ use of debt with the opportunity to grow tended to suppress dividends such that the market responded negatively, whereas in regression model 3, for companies with low growth opportunities, the results revealed a positive effect of the use of debt on firm value.
The findings of contradictions between companies with high growth opportunities and low growth opportunities indicated over and under leverage. These findings align with previous research conducted in the oil and gas industry by (Syaifulhaq et al., 2020), who found that debt was inversely related to debt when firms had a growth opportunity.
Viewed from the perspective of balancing theory by Myers (1984), the use of debt (debt ratio) of a company has an optimal limit. Debt can increase firm value at a certain level, and after it has exceeded the optimal limit, the use of debt will decrease firm value. The use of debt can increase the risk of bankruptcy because the firm has to bear a fixed burden. On the other hand, debt can save tax payments from the interest costs paid (tax-deductible). This study’s results indicated an overuse of debt in companies with high growth opportunities, and conversely, companies with low growth opportunities indicated that their use of debt had not exceeded the optimal limit. However, this study has not tested the optimal amount of debt for companies as members of the manufacturing industry.
The correlation test results of debt, growth opportunities, and firm value are very interesting. Companies with high growth opportunities had a negative influence on the company.
Conversely, companies with low growth opportunities had a positive effect on firm value. It indicated that companies with debt were not flexible when growth opportunities were high, meaning that their debt limited their ability to make open investments. As a result, many investment opportunities could be realized and were responded to negatively by the market. This study’s results reinforce previous research carried out by Stulz (1990), who found a tendency for management to prioritize investment (over investment), including less profitable investments. When profitable investment opportunities were opened, management had limitations in investing, resulting in underinvestment. This condition would be responded to negatively by the market such that the share price would decrease. Several studies’
results that are in agreement with the findings of Stulz (1990) stated that growth opportunities were inversely related to leverage and firm value (Gaver & Gaver, 1993; McConnell &
Servaes, 1995; Goyal et al., 2002; Billett et al., 2007). There is a significant difference in market response to companies using high leverage and low leverage (Ferris et al., 2018).
This study placed growth opportunities as a moderating variable using the subgroup model. This test was intended to determine whether growth opportunities played a role in strengthening or weakening capital structure’s influence on firm value. To test the role of moderation using model 3, it is as follows:
( )
( ) ( )
( )
( ) ( )
(
2
96,407 53,291 5,362 2 337,3868 53,291 5,362 150 149 4
− +
+ + −
− +
= =
+ + −
SSR SSRH SSRL K SSRH SSRL NH NL K
Based on the ANOVA test results, the results disclosed that the F-count was higher than the F-table value (337.3>
6.94427191). Thus, it is known that growth opportunities were statistically proven to moderate the effect of capital structure on firm value. It denoted that the effectiveness of debt policies to increase firm value was moderated by the availability of growth opportunities. This study’s results have proven that one factor determining the effectiveness of using debt is growth opportunities. The use of debt effectively affected firm value when the growth opportunities were low, and when the growth opportunities were high, the use of debt did not effectively affect firm value.
Concerning differences in the concept of capital structure proposed by previous studies, Ross (1997) suggested the existence of information asymmetry between investors and management, and the use of debt has been responded positively. Modigliani and Miller (1963) argued that the use of debt could boost firm value, and Myers and Majluf (1984) suggested a tiered funding concept. This study’s findings provide a different view of the effect of the use of debt on firm value.
5. Conclusion
This research is motivated by the difference in the concept of the relationship between capital structure and firm value, which is still an interesting topic. It employed 300 samples of company data in the manufacturing sector, listed on the Indonesia Stock Exchange for the period 2015-2018. The effect of capital structure policy was tested on firm value by placing growth opportunities as a moderating variable.
Table 1: Descriptive Statistics
Variable N Minimum Maximum Mean Std. Deviation
Q 300 -6.132 2.842 1.11447 .841690
DEBT 300 .055 .973 .49363 .215130
MBE 300 -.383 42,039 1.44158 2.651205
Table 2: Regression Regression
Model Variable Coefficient P-value
Model 1 (Constant) .684 .000
DEBT .884 .000
Model 2 (Constant) 2.212 .000
DEBTH -.980 .000
Model 3 (Constant) .523 .000
DEBTL .471 .000
Table 3: ANOVA Regression
Model Sum square
Residual (SSR) F P-value
Model 1 96.407 367.065 .000
Model 2 53.291 18.286 .000b
Model 3 5.362 46.239 .000
The placement of growth opportunities as a moderating variable is based on the findings of previous research carried out by Stulz (1990), McConnell and Servaes (1995), and Billett et al. (2007) who showed that the effect of capital structure on firm value was inversely related to growth opportunities. Companies with high growth opportunities had a negative effect on firm value, and companies with low growth opportunities had a positive effect on firm value. Besides, three regression models were performed: regression model 1 examined the direct effect of capital structure on firm value using total data, and the results showed that capital structure had a direct positive effect on firm value.
Furthermore, a regression model 2 test was conducted, which placed high growth opportunities as the moderating variable. The same was done for model 3, placing low growth opportunities as a moderating variable. The test results of the two regression models showed that for companies with high growth opportunities, the use of debt had a negative effect on firm value, and conversely, for companies with low growth opportunities, the use of debt had a positive effect on firm value. These findings corroborate previous findings, which form the basis of this research model (Stulz,1990; McConnell & Servaes, 1995;
Billett et al., 2007).
The statistical F-test results have proven that growth opportunities are a moderating variable for the relationship between capital structure and firm value. This study’s findings provide a different view from the concept of capital structure proposed by Ross (1997), Modigliani and Miller (1963), and Myers and Majluf (1984).
References
Adam, T., & Goyal, V. K. (2008). The investment opportunity set and it’s proxy variables : Theory and evidence The Journal of Financial Research, 16(1), 41–63. https://doi.org/10.1111/
j.1475-6803.2008.00231.x
Adenugba, A. A., Ige, A. A., & Kesinro, O. R. (2016). Financial leverage and firms’ value : a study of selected firms in Nigeria.
European Journal of Research and Reflection in Management Sciences, 4(1), 14–32.
Aggarwal, D., & Padhan, P. C. (2017). Impact of capital structure on firm value: Evidence from the Indian hospitality industry.
Theoretical Economics Letters, 07(04), 982–1000. https://doi.
org/10.4236/tel.2017.74067
Aggarwal, R., Jindal, V., & Seth, R. (2019). Board diversity and firm performance: The role of business group affiliation.
International Business Review, 28(6), 101600. https://doi.
org/10.1016/j.ibusrev.2019.101600
Barclay, M. J., Smith, C. W., & Morellec, E. (2006). On the debt capacity of growth options. Journal of Business, 79(1), 37–59.
https://doi.org/10.1086/497404
Bei, Z., & Wijewardana, W. P. (2012). Financial leverage, firm growth, and financial strength in the listed companies in Sri Lanka. Procedia - Social and Behavioral Sciences, 40, 709–715. https://doi.org/10.1016/j.sbspro.2012.03.253 Bhama, V., Jain, P. K., & Yadav, S. S. (2016). Testing the pecking
order theory of deficit and surplus firms: Indian evidence.
International Journal of Managerial Finance, 12(3), 335–350.
https://doi.org/10.1108/IJMF-06-2014-0095
Billett, M. T., King, T. H. D., & Mauer, D. C. (2007). Growth opportunities and the choice of leverage, debt maturity, and covenants. Journal of Finance, 62(2), 697–730. https://doi.
org/10.1111/j.1540-6261.2007.01221.x
Chabachib, M., Fitriana, T. U., Hersugondo, H., Pamungkas, I. D.,
& Udin, U. (2019). Firm value improvement strategy, corporate social responsibility, and institutional ownership. International Journal of Financial Research, 10(4), 152-163. https://doi.
org/10.5430/ijfr.v10n4p152
Chen, K. (2002). The influence of capital structure on company value with different growth opportunities. In: Paper for EFMA 2002 Annual Meeting. https://doi.org/10.2139/
ssrn.313960
Chen, L., & Zhao, X. (2006). On the relation between the market- to-book ratio, growth opportunity, and leverage ratio. Finance Research Letters, 3(4), 253–266. https://doi.org/10.1016/j.
frl.2006.06.003
Dang, H. N., Vu, V. T. T., Ngo, X. T., & Hoang, H. T. V. (2019).
Study the impact of growth, firm size, capital structure, and profitability on enterprise value: Evidence of enterprises in Vietnam. Journal of Corporate Accounting & Finance, 30(1), 144–160. https://doi.org/10.1002/jcaf.22371
Dang, V. A. (2013). Testing capital structure theories using error correction models: Evidence from the UK, France, and Germany. Applied Economics, 45(2), 171–190. https://doi.org /10.1080/00036846.2011.597724
Danila, N., Noreen, U., Azizan, N. A., Farid, M., & Ahmed, Z.
(2020). growth opportunities, capital structure, and dividend policy in an emerging market: Indonesia case study. The Journal of Asian Finance, Economics, and Business, 7(10), 1-8. https://doi.org/10.13106/jafeb.2020.vol7.no10.001 Ferris, S. P., Hanousek, J., Shamshur, A., & Tresl, J. (2018).
Asymmetries in the firm’s use of debt to changing market values. Journal of Corporate Finance, 48, 542–555. https://doi.
org/10.1016/j.jcorpfin.2017.12.006
Frank, M. Z., & Goyal, V. K. (2003). Testing the pecking order theory of capital structure. Journal of Financial Economics, 67(2003), 217-248. https://doi.org/10.1016/S0304-405X(02) 00252-0 Frank, M. Z., & Sanati, A. (2019). Financing corporate growth.
SSRN Electronic Journal. https://doi.org/10.2139/ssrn.
3377665
Gaver, J. J., & Gaver, K. M. (1993). Additional evidence on the association between the investment opportunity set and corporate financing, dividend, and compensation policies.
Journal of Accounting and Economics, 16, 125–160.
Goyal, V. K., Lehn, K., & Racic, S. (2002). Growth opportunities and corporate debt policy: The case of the US defense industry.
Journal of Financial Economics, 64(1), 35–59. https://doi.
org/10.1016/S0304-405X(02)00070-3
Gul, F. A., & Kealey, B. T. (1999). Chaebol, investment opportunity set and corporate debt and dividend policies of Korean companies. Review of Quantitative Finance and Accounting, 13(4), 401–416. https://doi.org/10.1023/A:1008397808221 Helm, R., & Mark, A. (2012). Analysis and evaluation of moderator
effects in regression models: State of art, alternatives, and empirical example. Review of Managerial Science, 6(4), 307–332. https://doi.org/10.1007/s11846-010-0057-y
Hermuningsih, S. (2013). Profitability, growth opportunity, and capital. Bulletin of Monetary, Economics and Banking, 1, 115–
136. https://doi.org/10.21098/bemp.v16i2.440
Ifada, L. M., Faisal, F., Ghozali, I., & Udin, U. (2019). Company attributes and firm value: Evidence from companies listed on Jakarta islamic index. Espacios, 40(37), 1-14. http://www.
revistaespacios.com/a19v40n37/19403711.html
Kallapur, S., & Trombley, M. A. (2001). The investment opportunity set: determinants, consequences, and measurement.
Managerial Finance, 27(3), 3-15. https://doi.org/10.1108/
03074350110767060
Kayhan, A., & Titman, S. (1984). Firms’ histories and their capital structures. Journal of Financial Economics, 83(1), 1-32. https://
doi.org/10.2139/ssrn.552144
Khan, K., Qu, J., Shah, M. H., Bah, K., & Khan, I. U. (2020). Do firm characteristics determine the capital structure of Pakistan listed firms? A quantile regression approach. Journal of Asian Finance, Economics, and Business, 7(5), 61–72. https://doi.
org/10.13106/jafeb.2020.vol7.no5.061
Kim, W. S., Park, K., Lee, S. H., & Kim, H. (2018). R & D investments and firm value: Evidence from China. Sustainability, 10(11).
https://doi.org/10.3390/su10114133
Li, H., & Stathis, P. (2017). Determinants of capital structure in Australia: An analysis of important factors. Managerial Finance, 43(8), 881–897. https://doi.org/10.1108/MF-02-2017-0030 Maxwell, O., & Kehinde, F. (2012). Capital structure and firm
value: Empirical evidence from Nigeria. International Journal of Business and Social Sciences, 3(19), 252–261.
McConnell, J. J., & Servaes, H. (1995). Equity ownership and the two faces of debt. Journal of Financial Economics, 39(1), 131–
157. https://doi.org/10.1016/0304-405X(95)00824-X
Modigliani, F., & Miller, M. H. (1958). The Cost of capital, corporation finance, and the theory of investment. The American Economic Review, 48(3), 261–297. https://doi.
org/10.1136/bmj.2.3594.952
Modigliani, F., & Miller, M. H. (1963). Corporate income taxes and the cost of capital. The American Economic Review, 53(3), 433–443. https://www.jstor.org/stable/1809167
Muñoz Mendoza, J. A., Sepúlveda Yelpo, S. M., & Veloso Ramos, C. L. (2019). Non-linear effects of ownership structure, growth opportunities and leverage on debt maturity in Chilean firms.
Revista Mexicana de Economía y Finanzas, 14(1), 21–40.
https://doi.org/10.21919/remef.v14i1.357
Myers, S. C. (1977). Determinants of corporate borrowing.
Journal of Financial Economics, 5(2), 147–175. https://doi.
org/10.1016/0304-405X(77)90015-0
Myers, S. C. (2003). Financing of corporations. Handbook of the Economics of Finance, 1(1), 216–247.
Myers, S. C., & Majluf, N. S. (1984). Corporate financing and investment decisions when firms have information that investors do not have. Journal of Financial Economics, 13(2), 187–221. https://doi.org/10.1016/0304- 405X(84)90023-0
Nguyen, Ho, & Vo. (2019). An empirical test of capital structure theories for the Vietnamese listed firms. Journal of Risk and Financial Management, 12(3), 148. https://doi.org/10.3390/
jrfm12030148
Nguyen, N. M., & Tran, K. T. (2020). Factors affecting the capital structure of listed construction companies on the Hanoi stock exchange. The Journal of Asian Finance, Economics, and Business, 7(11), 689-698. https://doi.org/10.13106/jafeb.2020.
vol7.no11.689
Ni, J., & Yu, M. (2008). Testing the pecking-order theory: Evidence from Chinese listed companies. Chinese Economy, 41(1), 97–
113. https://doi.org/10.2753/CES1097-1475410105
Qu, W., Wongchoti, U., Wu, F., & Chen, Y. (2018). Does information asymmetry lead to higher debt financing? Evidence from China during the NTS Reform period. Journal of Asian Business and Economic Studies, 25(1), 109–121. https://doi.org/10.1108/
jabes-04-2018-0006
Quynh-Nhu, D. (2009). Leverage, growth opportunities, and stock price response to new financing. International Journal of Business and Management, 4(9), 35–49. https://doi.
org/10.5539/ijbm.v4n9p35
Rahman, S. M. K. (2018). Effect of financial leverage on a firm’s market value creation in Bangladesh. International Journal of Corporate Finance and Accounting, 4(2), 41–58. https://doi.
org/10.4018/ijcfa.2017070103
Ross. S. (1997). The determination of financial structure: The Incentive-Signalling Approach. The Bell Journal of Economics, 8(1), 23–40. https://doi.org/10.2469/dig.v27.n1.2
Saif-Alyousfi, A. Y. H., Md-Rus, R., Taufil-Mohd, K. N., Mohd Taib, H., & Shahar, H. K. (2020). Determinants of capital structure: Evidence from Malaysian firms. Asia-Pacific Journal of Business Administration, 1(1), 1-11. https://doi.org/10.1108/
apjba-09-2019-0202
Salehi, M., & Biglar, K. (2009). Study of the relationship between capital structure measures and performance: Evidence from Iran. International Journal of Business and Management, 4(1), 97–103. https://doi.org/10.5539/ijbm.v4n1p97
Stiglitz, J. E. (1969). A re-examination of the Modigliani-Miller of the Miller theorem. The American Economic Review, 59(5), 784–793. https://EconPapers.repec.org/RePEc:aea:aecrev:
v:59:y:1969:i:5:p:784-93
Stulz, R. M. (1990). Managerial discretion and optimal financing policies. Journal of Financial Economics, 26(1), 3–27. https://
doi.org/10.1016/0304-405X(90)90011-N
Syaifulhaq, M. D. H., Herwany, A., & Layyinaturrobaniyah.
(2020). Capital structure and firm ’ s growth in relations to firm value at oil and gas companies Listed on Indonesia Stock Exchange. Journal of Accounting Auditing and Business, 3(1), 14–28. https://doi.org/10.24198/jaab.v3i1.
24760
Uzliawati, L., Yuliana, A., Januarsi, Y., & Santoso, M. I. (2018).
Optimization of capital structure and firm value. European Research Studies Journal, 21(2), 705–713. https://doi.
org/10.35808/ersj/1034
Vijayakumaran, S., & Vijayakumaran, R. (2019). Debt maturity and the effects of growth opportunities and liquidity risk on leverage: Evidence from Chinese listed companies. Journal of Asian Finance, Economics, and Business, 6(3), 27–40. https://
doi.org/10.13106/jafeb.2019.vol6.no3.27
Viviani, J. L. (2008). Capital structure determinants: An empirical study of French companies in the wine industry. International Journal of Wine Business Research, 20(2), 171–194. https://
doi.org/10.1108/17511060810883786
Wang, X., Liu, L., & Meng, C. (2011). Modeling risk management for resources and environment in China. In: D. D. Wu & Y.
Zhou (Eds), Computational risk management (pp.193–202).
Verlag Berlin Heidelberg: Springer.