Measurement of Neutron Capture Gamma-ray Spectrum of Natural Gold in the keV Energy Region
Jae Hong Lee, Samyol Lee, Sangbock Lee, Junhaeng Lee and Gyehwan Jin Department of Radiological Science, Nambu University, Gwangju 506-706
<요 약>
동경공업대학교의3MV펠레트론가속기를 사용하여10에서90keV영역에 대하여197Au의 중성자포획
스펙트럼을 측정하였다 중성자 펄스빔은. 7Li(p,n)7Be반응을 통하여 발생되었다 사용되어진 양성자 빔.
의 폭은1.5-ns였다 금 시료에 입사된 중성자의 에너지 스펙트럼은. 6Li-glass섬광검출기의 중성자 비행
시간법을 사용하여 측정하였다 금 시료의 중성자포획에 의해서 발생된 감마선은. anti-Compton NaI(TI)
검출장비를 사용하여 측정되었다 본 연구에서는 개의 중성자 에너지 역영을 선택했고 각각의 에너지. 5 ,
영역에서 얻어진 감마선파고스펙트럼을 표시하였다 본 연구에서 얻어진 스펙트럼은 처음으로 얻어진.
결과이며 중성자 결합에너지부근에 몇 개의 천이 피크가 보인다, .
Abstract
keV-neutron capture gamma-ray spectrum of197Au(natural gold) sample have been measured in neutron energy range from 10 to 90 keV using the 3-MV pelletron accelerator of the Research Laboratory for Nuclear Reactors at the Tokyo Institute of Technology. Pulsed keV neutrons were produced from the7Li(p,n)7Be reaction by bombarding on the7Li target with the 1.5-ns bunched proton beam. The incident neutron spectrum on the Au sample was measured by a6Li-glass scintillation detector and TOF method. Capture gamma-rays from Au sample were measured by anti-Compton NaI(TI) spectrometer. Five average neutron energy regions were selected to obtain the neutron capture spectrum. Several gamma-ray peaks in the spectrum were found in the present experiment.
Key word 197Au, neutron, capture gamma ray, time-of-flight(TOF), spectrum, anti-Compton NaI(TI) spectrometer
. Introduction.
Ⅰ
Measurement of neutron capture -ray spectrum givesγ information to understand the nuclear structure and the data to calculate the neutron capture cross section. This kind of information for neutron capture -ray spectrumγ is very useful for investigating the Nuclear Physics, Nuclear Engineering, Nucleosynthesis and Radiation Therapy. The s-process of nucleosynthesis in the red
giant star is very important to create of the heavy nuclide to Bi at the star of 1 to 3 times mass of sun.
therefore, present measurement in the neutron energy region from 10 to 90keV is very important s-process because the temperature of s-process are 6 to 12keV and 30KeV. Gold is widely used as a standard material for nuclear reaction field and monitering the neutron capture therapy. Therefore, precise measurement of the spectrum for the 197Au(n, )γ198Au reaction os of great
importance in the nuclear reaction and neutron capture therapy. furthermore, a preciss neutron capture spectrum is required for checking the universal validity of evaluated neutron capture cross-section, and for neutron activation analysis, especially epithermal activation analysis. However, although the spectrum for the
197Au(n, )γ198Au reaction has been measured several times in the other neutron energy region. However, the present situation, there are no the neutron capture spectrum of the 197Au(n, )γ198Au reaction in the keV region. therefore, Present the research measured γ-ray spectrum of 197Au(n, )γ198Au reaction in the keV region.
Anti-Compton NaI(Tl) spectromer and 3-MV Pelletron accelerator was employed for the present measurement of experiment.
. Experiment.
Ⅱ
The capture γ-ray spectrum of 197Au was measured by using the 3-MV Pelletron accelerator of the Research Laboratory for Nuclear Reactors(RLNR) at the Tokyo Institute of Technology. The measurements were performed in the neutron energy region of 10 to 90 keV. Pulsed keV-neutrons were produced via the
7Li(p,n)7Be reaction by bombarding a metallic lithium target with the 1.5-ns bunched proton beam from the 3-MV Pelletron accelerator of RLNR.
The lithium target was made by evaporating metallic lithium on a copper disk with a diameter of 3㎝and a thickness of 0.4 . The diameter and the thickness of㎜ the lithium layer were about 2㎝ and a few μm, respectively. The lithium target was cooled by water to prevent the lithium from being scattered and lost. The temperature of the lithium target was kept at less than 27 . A time-of-Flight(TOF) method was employed in℃ the present experiments. The neutrons were captured by a sample located at an angle of 0 with respect to the〫 proton-beam direction. The neutron flight path was about 12㎝ for the energy region experiment(10 - 90 keV). Emitted -rays from the sample were detected byγ
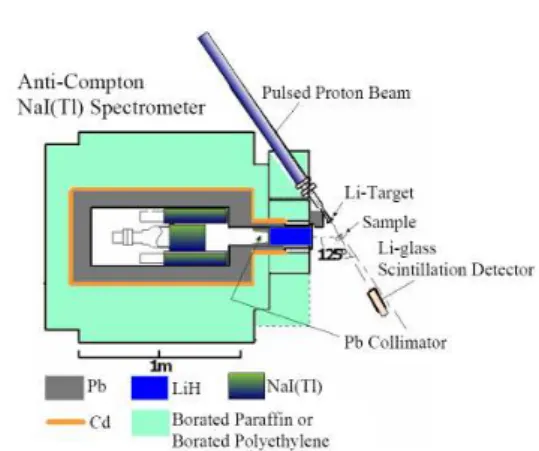
a heavy shielded anti-Compton NaI(Tl) spectrometer while a 6Li-glass scintillation detector was used to determine the energy spectrum of the incident neutrons on the sample by a TOF method. A typical experimental arrangement is shown in Figure.1 . The characteristic of the Au sample is summarized inTable.1 . Since a neutron has no charge, it cannot generate any ionization directly in matter. In order to measure a neutron , the secondary charged particle from its nuclear reaction is usually used. In the present experiments, the
6Li(n, ) reaction was used for detecting neutrons. Theα incident neutron spectrum on a capture sample was measured by means of a TOF method with a 6Li-glass scintillation detector. A 5.0-㎜ diameter by 5.0-㎜
6Li-glass detector located 30㎝from the neutron source was used for the measurements in the 10-90 keV region.
The anti-Compton NaI(TI) spectrometer system was used for detecting the capture γ-ray at an angle 125〫 with respect to the proton beam direction. The size of main NaI(Tl) spectrometer used in the present experiments was 152-㎜ in diameter and 203-㎜ in length, and the main detector was centered in a 330-㎜
outer diameter by 356-㎜ NaI(Tl) hollow Compton- suppression detector. The anti-Compton NaI(TI) spectrometer was set in a heavy shield consisting of borated paraffin, borated polyethylene, cadmium, and potassium-free lead. A 6LiH shield that effectively absorbed the neutrons scattered by the sample was added in the -ray collimator of the spectrometer shield.γ The pulse height signals of the main detector were taken from the dynode of the photomultiplier while the start signal of the time digitizer was taken from the anode.
The stop signal of the time discrimination level was set to 30 keV. The anti-coincident method was adopted so as to reject secondary γ-ray due to Copmton scattering and pair production. Background cosmic γ-rays could also be rejected. The capture events detected by the spectrometer were stored into a computer as two-dimensional data based on the TOF and the pulse
Fig.1. A typical experiment arrangement
Chemical form 197Au
Physical form metal plate Chemical purity(%) 99.999
Net weight(g) 3.43
Diameter( )㎜ 15.0
Thickness( )㎜ 1.0
Table 1. Characteristics of Au sample.
. Measurement of spectra.
Ⅲ
1. Incident Neutron Flux
The energy distribution of the incident neutrons was measured by the small or large 6Li-glass scintillation detector without sample by using Time-of-Flight(TOF) method. The kinetic energy of a neutron is given by, in non-relativistic case,
(1)where is the rest mass of neutron, the flight path, and the TOF of the neutron. Therefore, the neutron energy could be determined if we measured the TOF of neutron. From Eq(1), a more practical equation is derived as follows:
×sec
(2)Figure 2 shows the TOF spectrum measured by the small 6Li-glass detector for the blank runs in the neutron energy region 10-90 keV. The net TOF spectrum was converted to the energy spectrum by using Eq(2). Finally, the neutron energy spectrum was normalized and the normalized neutron energy spectrum for the energy experiments are shown in Fig.3. Figure 4 shows the block diagram for measurement of neutron flux.
500 600 700 800 900 1000
Li(p,
γ) Be
Channel
Fig.2. TOF spectrum measured by the small6Li-glass detector for the blank runs in the energy region from 10 to 90 keV measurements of197Au
20 40 60 80 100
Energy [keV]
Fig.3. Neutron flux of incident on the sample in the present experiment.
Fig.4. Electronic block diagram for measurement of neutron flux.
2. Gamma Ray Spectrum of 197Au(n, )γ198Au Reaction
The γ-ray spectra of 197Au(n, )γ198Au Reaction were measured by anti-Compton NaI(Tl) spectrometer.
employing a TOF method. The energy resolution of main detector was 7.0%(FWHM) at 0.662 MeV, and the time resolution was 4.0 ns(FWHM) for the 0.511 MeV γ -ray. The distance was fixed to 86.0㎝ between the center of capture sample and the front surface center of main detector. Figure 6. shows the block diagram for capture γ-ray spectrum of 197Au. The PH signals of main detector were taken from the 12th dynode of photomultiplier, while the timing signals were taken from the anode. The stop signals for a TAC were taken from the time pick-off unit described above. The PH signals of Compton-suppression detector were made by summing up the anode outputs from ten
30keV. The high voltage for each of ten photomultipliers was adjusted so as to generate the same PH outputs for an 241Am source at the center of detector.
Fig.6. The block diagram for the measurement of neutron capture -ray spectrum ofγ 197Au(n, )γ198Au.
. Result Discussion.
Ⅳ &
The capture -rays ofγ 197Au were measured in the incident neutron energy region of 10 to 90keV, using a 1.5-ns pulsed neutron source by the 7Li(p,n)7Be reaction and an anti-Compton NaI(Tl) γ-ray spectrometer. The measured spectrum were show in Fig.7, 8, 9, 10, and 11, respectively. These spectra seem to be same pattern. However, in the 16.80 keV region spectrum the peak in the energy region of 5.5 MeV, 6.2 MeV and in the 47 keV region spectrum the peak in the energy region of 1.5 MeV looks like bump as special decay mode. To obtain more precise the gamma ray spectrum from the197Au(n, )γ198Au, we will have to unfold these spectrum by using FERDOR Code. Measurement of gamma ray spectrum of
197Au(n, )γ198Au will be compared with the present result.
4 5 6 7
(Neutron Energy: 32.8 keV)
-ray Energy (MeV)
Fig.8. Neutron capture γ-ray spectrum of 197Au(n, )γ198Au Reaction in the average neutron energy region 32 keV.
4 5 6 7
(Neutron Energy: 47.2 keV)
-ray Energy (MeV)
Fig.9. Neutron capture γ-ray spectrum of 197Au(n, )γ198Au Reaction in the average neutron energy region 47 keV.
4 5 6 7
(Neutron Energy: 62.1 keV)
-ray Energy (MeV)
Fig.10. eutron capture γ-ray spectrum of 197Au(n, )γ198Au Reaction in the average neutron energy region 62 keV
4 5 6 7
(Neutron Energy: 76.2 keV)
-ray Energy (MeV)
Fig.11. Neutron capture γ-ray spectrum of 197Au(n, )γ198Au Reaction in the average neutron energy region 76 keV
References
[1] G.F.Knoll, Radiation Detection and Measurement, N.Y. ; J.Woley & Sons, 2000, ch 3, 8, 10.
[2] S.Y.Lee, S.Yamamoto, and K.Kobayashi, “Neutron Capture Cross-Section Measurement of Rhodium in the Energy Region from 0.003eV to 80keV by TOF,” Nuclear Science and Energing, Vol.144, No.1, PP.94-107
[3] T.Matsumoto, M.Igashira and T.Ohsaki,
“Measurement of keV-Neutron Capture Cross Sections and Capture Gamma-ray Spectra of99Tc,”
Journal of Nuclear Science and Technology, Vol.40, No.2, PP.61-68
[4] J.R,Yoon, T.I.Ro, and S.Y.Lee, “127I의 에너지 의존 중 성자 포획단면적 측정.” Sae Mulli(The Korean Physical Society), Vol.50. No4. PP. 224-231
[5] S.Y.Lee, S.B.Lee, J.H.Lee, G.H.Jin, “B3G3O12감마선 검출기 및 전자선형가속기를 이용한127I(n, )γ128I반응률 측정” 1st NBU Radiology 2006 Workshop, Vol.1, No.1, PP103-110