]. Korean Math. Soc.
Vo!. 14, No. 2, 1978.
USE OF THE WILCOXON TEST FOR THE PARALLELISM OF TWO REGRESSION LINES
By
MOON SUP SONG1. Introduction.
Consider the regression model
Yij=ai+ (3iX;j+e;j, j=l, 2, "', N;, i= 1,2
where the X's are known constants, the a's are nuissance parameters, and the (3's are regression parameters. The Y's are observable while the e's are mutually independent unobservable random variables. For line i, the e/s are identically distributed according to the unknown continuous cdf Fi(e).
We wish to test the null hypothesis that two regression lines are parallel, i. e., we want to test
Ho: (31
=(32'
When the error terms er's and e/ s are normally distributed with the same variance, the Student's t-test may be applied. However, there are many good and simple nonparametric tests for the regression problems which do not require any assumptions other than independent samples from identically distributed continuous populations. This paper presents a test which is valid for two arbitrary distributions of two sets of error terms.
Sen (1969) studied a class of more general models including the case of non-identical distributions. Hollander (1970) proposed a distribution-free si- gned rank test for. testing Ho. But his method is applicable only for the case of equal numbers of observations from the two lines. Potthoff (1974) introduced a conservative nonparametric test which resembles the Wilcoxon two-sample test. According to the Monte Carlo values in Hollander (1970), the Pottoff's test is too conservative for potential users. Potthoff's test also requires the assumption that no X/s are equal and no Xls are equal.
Trying to avoid the disadvantages of the Hollander's and Potthoff's tests, we propose a method to utilize the ordinary Wilcoxon two-sample statistic applied to the slope estimators (Y
li -Y
1i')/(X
li-X
li,)and (Y
2j -Y
2/ ) /(X
2j -X
2/ ) .This method is nonparametric in the sense that continuity is the
Received by the editors Oct. 20, 1977.
onli assumption made concerning the error distributions F
land F
2,but it"
is not distribution-free. We present some Monte Carlo results which suggest the usage of the ordinary Wilcoxon two-sample statistic even when F
lif=F
2•2. Procedures and statement of results.
We assume that Nl = 2m and N
2= 2n. To use the slope estimators proposed' by Hollander (1970), for line i=l pair the Xl/s to form m groups of the- form (Xl> Xl')' and for line i=2 pair X
2/s to form n groups of the form (X
2,X
2,),each containing two unequal X's. For each group compute a slope estimator of f3i of the form (Y- Y') / (X-X') where Y, Y' are obser- vations corresponding to the paired X, X' points. The grouping depends..
only on the {Xij} configurations. Random pairing may be suggested as a safeguard against the introduction of biases.
,Then, the Wilcoxon (1945) two-sample test, or equivalently, the Mann- Whitney (1947) two-sample test can be applied to these slope estimators~
,Thus our test of Ho will be based on the statistic
.. .
(2.1) W=(1/mn)I; I;U(Vij)
;=1 j=l
where U(V) equals 0 if V~O and 1 if V>O, and where Y
2j -Y
2j,Y
li -Y
li,Vij X
2j-X
2j,Xli-Xli' .
Note that the V's are, in general, not identically distributed, but they are independent and symmetric.
The one-sided test of Ho based on (2.1) against alternatives f32>f3l rejects.
for large values of W. Our proposed test W will use the exact critical va- lues of the ordinary Wilcoxon test statistic or will treat
(2.2) (W -1/2)![ (m+n+ 1) /12mn]11
2as an approximate N(O,l) variate under Ho.
To justify our proposal we note the following three points:
(i) Regardless of what F l and F
2are, under Ho the. distribution of [W-E(W)]/[Var(W)J!/2 is asymptotically N(O,l) under mild restrictions.
For proof and statement of conditions, refer to Hoeffding (1948) or the se- ction 50f PottIioff (1974). The proof is sirill1ai" to that of Potthoff to wari-
~t
ommision.
(ii) Under Ho, no matter what F
land F
2are,
E(W)=1/2
which follows immediately from the symmetry of V about the origin. If Ho- is not true, E(W) *1/2. For the case (32)(31> we have E(W»1/2, and for the case 132<131' we have E(W)<l/2. (See section 3 of Potthoff (1g..
74). )
(iii) For the equally spaced design, which is explained in Section 3, the upper bound of the variance is given by
(2.3) Var(W) ~1/[4 min(m, n)J
which follows from Birnbaum and Klose (1957). When F
l=·F
2and Ho is.
true, W has the usual null distribution of Wilcoxon-Mann-Whitney two- sample test statistics. In this case W has variance (m + n + 1) /12mn. For the case m = n, we find from the equation (2. 6) of Birnbaum and Klose (1957), that
(2.4) Var(W) 2: (2n+ 1) /12n2,
using the symmetry of V about O.
REMARKS: To apply a conservative test of Ho we may use the Wilcoxon statistics, with (m+n+l)/12mn replaced by 1/[4 min(m,n)J. That is, to.
test Ho against alternatives 132>131> if we use the critical region (2.5)
1
C=2[min(m, n)J2 (W-l/2»zl-a
where
ZI-ais the I-a percentile point of N(O, 1), then the test based on.
(2. 5) will be approximately of size a. The C test based on (2. 5) was deve- loped by Potthoff (1963) concerning the use of the Wilcoxon statistic for a.
generalized Behrens-Fisher problem.
3. Monte Carlo study with equally spaced design.
Hollander (1970) has proposed a test of Ho based on
(3.1) . .
H=~riU(Vi) =~ U(Vi + V-)
;=1 i~j J
where V
i= (Y
2i -Y
2i') /(X
2j-X
2i') - (Y
li -Yli') /(X
1j-X
li,),i=l, 2, "., n, and
r jis the rank of I Vi I in the joint ranking from the least to greatest of
1 VII, I V
21, .'., I V" I. Under Ho, the H test statistics has the null distribution.
of Wilcoxon's signed rank statistics.
The Student's t-test of Ho can be based on
t= (b
2-b
1)/sZ,
where
. 2 [ Ni ]
ai=Yi.-biXi., Z2=~ 1/~(Xij-Xi.)2 .
'=1 )=1
When F
1and F
2are normally distributed with the same variance and Ho is true, t has the Student's t-distribution with (N
1+N
2-4) degrees of free- dom.
Potthoff (1974) has suggested a test of Ho based on
p=[ (~1)(~2)]-l~, j~'U[ (Y2j - Y 2j,) / (X2j -X2j,)
- (Y
li -Y u') / (Xli- Xli') ].
and the one-sided test against f32>f31 would have as critical region (3.2) (P-l/2) [(2M+5) /18M(M-l) Ti>Zl-a
where M=min(N
bN 2), Zl-a is the I-a percentile point of a N(O,I) dis- tribution.
Monte Carlo sampling with the equally spaced design, which was sugges- ted by Hollander (1970) for the H test, was used to compare the powers of the Hand W tests. Setting N
1=N
2=N=2kn', we have n' observations at each of 2k points
(3.3) Ci+2cij, j =0, ..., 2k-I,
where Ci, Ci are arbitrary constants with Ci>O, i = 1, 2. Take the k intervals [C
i+ 2cd, Ci+2ci U+k)], j=O, ' .., k-'I
and for each interval obtain n' independent slope estimators of f3i, i = 1, 2.
For the design (3.3) with k=IO, n'=I,
Cl=C2 = l/2, 500 samples with each sample consisting of 20 random values from F
1and F
2are used to es- _.timate powers Parameters are chosen -to compar.e-tAe--nsults -with---- these of
ltottandet (1970, Table 3), and the Monte Carloi-esuIts are summanzeJ In
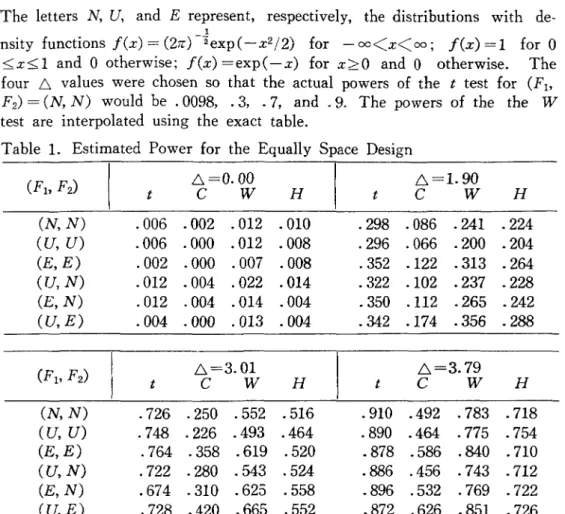
Table 1. The one-sided t, C (based on (2. 5) ), W, and H tests are used
to test Ho against alternatives f32>f3l for various (F b F 2) pairs and several
values of
L1= (pz- Pl) / {[ ((jlZ+
(jZZ)/21t[ 1/:~ (Xij- Xd Z]} ~.
The letters N, U, and E represent, respectively, the distributions with de-
l