Short-term and long-term treatment outcomes with Class III activator
Objective: The purpose of this retrospective study was to investigate short- term and long-term skeletodental outcomes of Class III activator treatment.
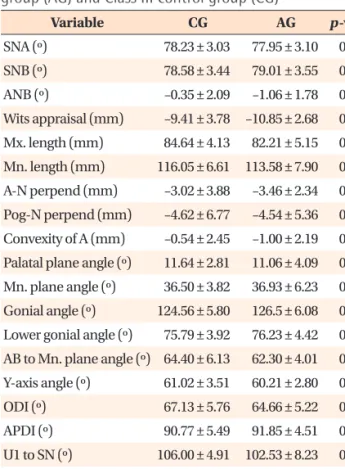
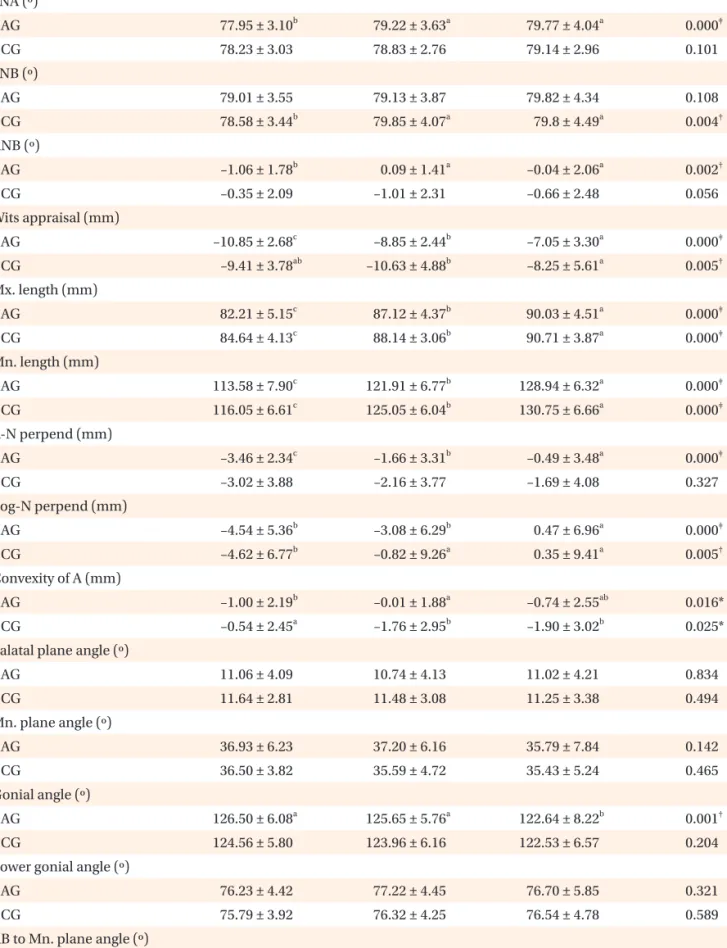
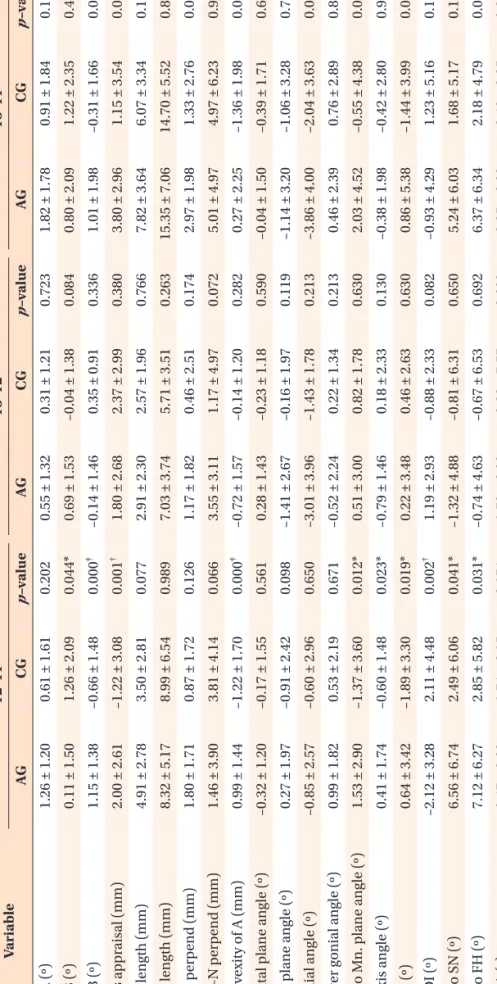
Methods: A Class III activator treatment group (AG) comprised of 22 patients (9 boys, 13 girls) was compared with a Class III control group (CG) comprised of 17 patients (6 boys, 11 girls). The total treatment period was divided into three stages; the initial stage (T1), the post-activator treatment or post-mandibular growth peak stage (T2), and the long-term follow-up stage (T3). Cephalometric changes were evaluated statistically via the Mann-Whitney U-test and the Friedman test. Results: The AG exhibited significant increases in the SNA angle, ANB angle, Wits appraisal, A point-N perpendicular, Convexity of A point, and proclination of the maxillary incisors, from T1 to T2. In the long-term follow-up (T1−T3), the AG exhibited significantly greater increases in the ANB angle, Wits appraisal, and Convexity of A point than the CG. Conclusions: Favorable skeletal outcomes induced during the Class III activator treatment period were generally maintained until the long-term follow-up period of the post-mandibular growth peak stage.
[Korean J Orthod 2015;45(5):226-235]
Key words: Class III activator, Skeletodental changes Hyo-kyung Ryu
aHyun-Jeong Chong
bKi-Yong An
cKyung-hwa Kang
aa
Department of Orthodontics, College of Dentistry, Wonkwang Dental Research Institute, Wonkwang University, Iksan, Korea
b
Private Practice, Iksan, Korea
c
Department of Orthodontics, College of Dentistry, Gangneung-Wonju National University, Gangneung, Korea
Received January 23, 2015; Revised April 16, 2015; Accepted May 1, 2015.
Corresponding author: Kyung-hwa Kang.
Professor and Chair, Department of Orthodontics, College of Dentistry, Wonkwang University, 460 Iksan-daero, Iksan 570-749, Korea.
Tel +82-63-859-2961 e-mail [email protected]
© 2015 The Korean Association of Orthodontists.
The authors report no commercial, proprietary, or financial interest in the products or companies described in this article.
This is an Open Access article distributed under the terms of the Creative Commons Attribution Non-Commercial License (http://creativecommons.org/licenses/by-nc/4.0) which permits unrestricted non-commercial use, distribution, and reproduction in any medium, provided the original work is properly cited.
pISSN 2234-7518 • eISSN 2005-372X
http://dx.doi.org/10.4041/kjod.2015.45.5.226
INTRODUCTION
Class III malocclusion is a more common clinical pro- blem in Mongolian populations than in Caucasian po- pulations.
1The prevalence of Class III malocclusion ranges from 2.3% to 16.7% in Asia,
2-4and in a series of studies undertaken in Korea 38.1% to 48.3% of the patients who visited a clinic seeking orthodontic treat- ment had Class III malocclusion.
5-7Similarly, survey results pertaining to the distribution of orthodontic patients in Wonkwang University Dental Hospital revealed that Class III patients comprised 34.2% of them, and of these, 33.6% were growing patients.
Treatment of Class III malocclusions in growing pa- tients is generally considered one of the most complex challenges in orthodontics.
8-11Early intervention treat- ment in patients with Class III malocclusion is con- troversial, for reasons relating to unpredictable pro- gnoses, reduced efficiency arising from the associated long treatment times, and patient compliance pro- blems.
1,12,13In view of these potential problems, the success or otherwise of several orthopedic treatments including chin caps, facemasks, and functional appliances have been studied.
14-17However, early intervention treat ment of growing patients with skeletal Class III mal occlusion via orthodontic or orthopedic modalities has become a common practice, favored for reasons re lating to effectiveness, functional rehabilitation, and patients’ quality of life; including their emotional develop ment.
18,19Successful clinical results of functional appliance the- rapy have been reported by several authors.
14,20,21Exam-
ples of functional orthopedic appliances for Class III treatment are the Fränkel function regulator III, Bionator III, and Class III activator.
Many previous studies have investigated the effects of Class III activator therapy.
20,22-25Several of these have reported short-term treatment effects, including improvement of patient profile with significant clock- wise rotation of the mandible and proclination of the maxillary incisors.
22-25However, few studies have in- vestigated the long-term effects of this treatment mo- dality.
20In the current study, we investigated the short-term and long-term skeletodental changes associated with Class III activator treatment in growing patients.
MATERIALS AND METHODS
Patient selection
Patients in the study groups were selected from the growing Korean patients diagnosed by the Department of Orthodontics, Wonkwang University Dental Hospital from July 2000 to June 2011. This retrospective study was approved by the institutional review board of the Dental Hospital of Wonkwang University (approval num- ber WKDIRB201408-01).
Patients were classified into either a Class III activator treatment group (AG) or a Class III control group (CG).
The AG was comprised of 22 patients (9 boys, 13 girls) treated with Class III activator over the mandibular growth peak without combination or alteration with other growth modification appliances. The CG was comprised of 17 patients (6 boys, 11 girls) who were not
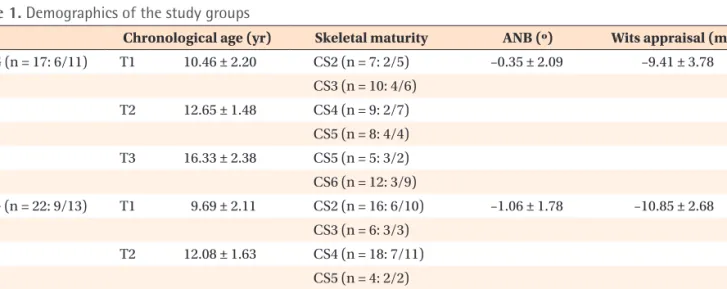
Table 1. Demographics of the study groups
Chronological age (yr) Skeletal maturity ANB (º) Wits appraisal (mm) CG (n = 17: 6/11) T1 10.46 ± 2.20 CS2 (n = 7: 2/5) –0.35 ± 2.09 –9.41 ± 3.78
CS3 (n = 10: 4/6) T2 12.65 ± 1.48 CS4 (n = 9: 2/7)
CS5 (n = 8: 4/4) T3 16.33 ± 2.38 CS5 (n = 5: 3/2) CS6 (n = 12: 3/9)
AG (n = 22: 9/13) T1 9.69 ± 2.11 CS2 (n = 16: 6/10) –1.06 ± 1.78 –10.85 ± 2.68 CS3 (n = 6: 3/3)
T2 12.08 ± 1.63 CS4 (n = 18: 7/11) CS5 (n = 4: 2/2) T3 15.03 ± 1.91 CS5 (n = 3: 2/1)
CS6 (n = 19: 7/12)
Values are presented as mean ± standard deviation or total number: number of boys/girls.
AG, Class III activator treatment group; CG, Class III control group; T1, initial stage; T2, post-activator treatment or post-
mandibular growth peak stage; T3, long-term follow-up stage.
treated with removable appliances that could modify growth or mandibular position (Table 1).
Inclusion criteria included skeletal Class III discrepancy beyond the normal range (normal mean ± 1 standard deviation) based on the ANB angle and Wits appraisal measurements according to individual growth state; pre- mandibular growth peak stage at the time of diagnosis;
no previous orthodontic treatment; no craniofacial anomalies including cleft lip and palate; and availability of adequate specific supplementary data including diagnostic records, treatment progress notes, and lateral cephalometric radiographs.
Skeletal maturity
The total treatment period was divided into three stages; the initial stage (T1), the post-activator treat- ment or post-mandibular growth peak stage (T2), and the long-term follow-up stage (T3). Skeletal ma- turation was determined by lateral cephalometric ra- diographs using a modified version of the cervical ver- tebral maturation method
26(modified CVM method), independently of chronologic age. The stages of cervical vertebral maturation were all classified by the same investigator (HKR).
All patients were in pre-mandibular growth peak stage (CS1 − CS3) at T1, post-mandibular growth peak stage (CS4 − CS5) at T2, and more than a year after mandibular growth peak stage (CS5 − CS6) at T3.
Treatment protocols
In the AG, the construction bite of the activator was taken in the most posterior mandibular position with various heights, according to the patients’ individual conditions. The appliances fitted well in the patients’
mouths. Clinicians instructed the patients to wear the appli ances for at least 14 hours per day. All AG patients were treated via the same protocol by the residents, under the supervision of faculty supervisors. AG patients wore the activator consistently until post-mandibular growth peak stage (T2), at which time the second phase of fixed appliance treatment was recommended. After activator treatment, comprehensive orthodontic treat- ment was initiated in 18 patients (8 boys, 10 girls).
Orthodontic treatment combined with orthognathic surgery was recommended to 4 other patients (1 boy, 3 girls).
CG patients were treated via various means depending on their individual conditions. Four girls were observed for habit control, 5 patients (3 boys, 2 girls) were treated with removable appliances for dental alignment, and 8 patients (3 boys, 5 girls) initially underwent fixed appliance treatment on only their maxillary dentition. After T2, 13 patients (5 boys, 8 girls) received comprehensive orthodontic treatment and 4 patients (1
boy, 3 girls) were observed regularly for possible further growth of the jaws. Orthodontic treatment combined with orthognathic surgery was recommended to 3 patients (1 boy, 2 girls) at T3.
Cephalometric analysis
Lateral cephalometric radiographs were acquired via a Planmeca PM 2002 cc Proline Ceph (Planmeca, Helsinki, Finland) until October 31st 2002, then via a Planmeca Promax Dimax3 Ceph (Planmeca) thereafter, with the patients in natural head position. Lateral cephalometric radiographs were taken at T1, T2, and T3 in each pa- tient. Original films taken with the Planmeca PM 2002 cc Proline Ceph were scanned and converted into a digital format via a Vidar Diagnostic Pro Plus Film Digitizer (Vidar Systems Corporation, Herndon, VA, USA).
All lateral cephalometric radiographs were digitized and calculated using V-ceph 6.0 software (Osstem Implant Co., Ltd., Seoul, Korea) by the same investigator (HKR). Magnification was corrected for all the lateral
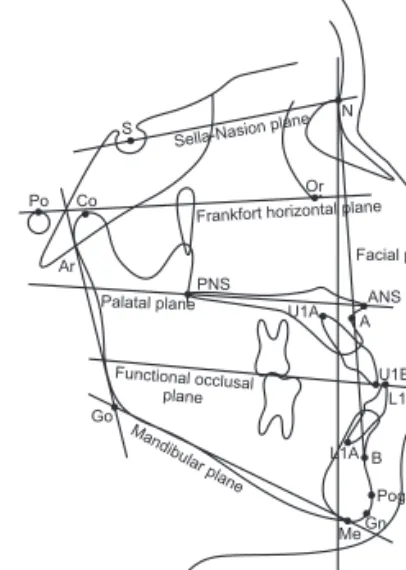
Figure 1. Landmarks and reference planes. S, Sella;
N, Nasion; Po, Porion; Or, Orbitale; Co, Condylion; Ar, Articulare; ANS, anterior nasal spine; PNS, posterior nasal spine; A, Point A; B, Point B; U1E, incisal edge of maxillary central incisor (U1); U1A, root apex of U1; L1E, incisal edge of mandibular incisor (L1); L1A, root apex of L1;
Pog, Pogonion; Gn, Gnathion; Me, Menton; Go, Gonion;
Sella-Nasion plane (SN plane), line from S to N; Frankfort horizontal plane (FH plane), line from Po to Or; Palatal plane, line from PNS to ANS; Functional occlusal plane, line drawn along the maximum intercuspation of the posterior teeth; N-perpendicular plane (N-perp plane), perpendicular line to FH plane passing through Nasion;
Facial plane, line from N to Pog; Mandibular plane, line from Go to Me.
S
Po Co Or
N Sella-Nasionplane
Ar
PNS Palatal plane
Frankfort horizontalplane Facial plane
ANS U1A A
U1E L1E
L1A B
Pog MeGn Go
N-perpendicular plane Mandibular
plane Functional occlusal
plane
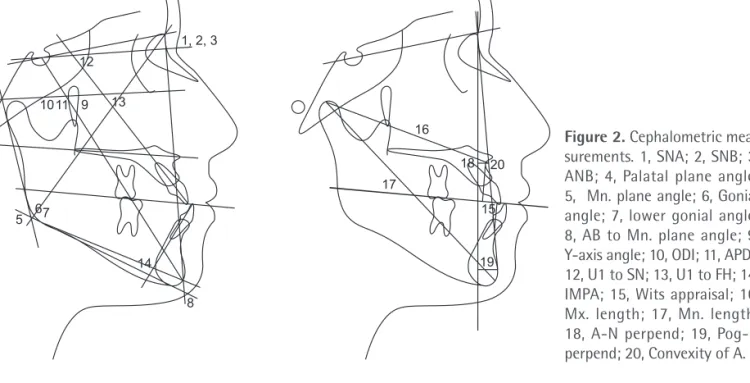
Figure 2. Cephalometric mea- surements. 1, SNA; 2, SNB; 3, ANB; 4, Palatal plane an gle;
5, Mn. plane angle; 6, Gonial angle; 7, lower go nial angle;
8, AB to Mn. plane angle; 9, Y-axis angle; 10, ODI; 11, APDI;
12, U1 to SN; 13, U1 to FH; 14, IMPA; 15, Wits appraisal; 16, Mx. length; 17, Mn. length;
18, A-N perpend; 19, Pog-N per pend; 20, Convexity of A.
1, 2, 3 12
4
1011 9 13
5 67
8 14
17 16
18 20
15
19